Machine Learning Based Crop Drought Mapping System by UAV Remote
Sensing RGB Imagery
*Jinya Su
a†, Matthew Coombes
b, Cunjia Liu
b, Yongchao Zhu
c, Xingyang Song
c, Shibo Fang
c, Lei Guo
d,
Wen-Hua Chen
baSchool of Computer Science and Electronic Engineering, University of Essex, Colchester CO4 3SQ, U.K.
E-mail: [email protected]
bDepartment of Aeronautical and Automotive Engineering, Loughborough University, Loughborough LE11 3TU, U.K.
cInstitute of Ecology and Agrometeorology, Chinese Academy of Meteorological Sciences, China.
dSchool of Automation Science and Electrical Engineering, Beihang University, Beijing 100191, China
Water stress has adverse effects on crop growth and yield, where its monitoring plays a vital role in precision crop management. This paper aims at initially exploiting the potentials of UAV aerial RGB image in crop water stress assessment by developing a simple but effective supervised learning system. Various techniques are seamlessly integrated into the system including vegetation segmentation, feature engineering, Bayesian optimization and Support Vector Machine (SVM) classifier. In particular, wheat pixels are first segmented from soil background by using the classical vegetation index thresholding. Rather than performing pixel-wise classification, pixel squares of appropriate dimension are defined as samples, from which various features for pure vegetation pixels are extracted including spectral and colour index features. SVM with Bayesian optimization is adopted as the classifier. To validate the developed system, a UAV survey is performed to collect high-resolution atop canopy RGB imageries by using DJI S1000 for the experimental wheat fields of Gucheng town, Heibei Province, China. Two levels of soil moisture were designed after seedling establishment for wheat plots by using intelligent irrigation and rain shelter, where field measurements were to obtain ground soil water ratio for each wheat plot. Comparative experiments by three-fold cross-validation demonstrate that pixel-wise classification, with a high computation load, can only achieve an accuracy of 82.8% with poor F1 score of 71.7%; however, the developed system can achieve an accuracy of 89.9% with F1 score of 87.7% by using only spectral intensities, and the accuracy can be further improved to 92.8% with F1 score of 91.5% by fusing both spectral intensities and colour index features. Future work is focused on incorporating more spectral information and advanced feature extraction algorithms to further improve the performance.
Keywords: Area-wise classification; Support Vector Machine (SVM); Unmanned Aerial Vehicle (UAV); Wheat drought mapping.
1. Introduction
Water stress generally has significantly adverse effects on crops such as closing stomata, reducing transpiration rate and up-taking less carbon dioxide, which all inevitably diminish crop growth and productivity resulting in less biomass and yield.1In addition, water scarcity has become
one of the top three global problems and in particular China is a vast country with severe shortage of water. It is re-ported that agriculture takes 62.06% of fresh water for the arable land in the north region of China. Unfortunately, the
current irrigation efficiency in China is only about 52%, well below advanced countries which can achieve an effi-ciency of about 70%–80% of water usage. Therefore, there is an urgent need to optimize irrigation scheduling and strat-egy so that irrigation efficiency can be improved, i.e. sig-nificantly reducing water usage while meeting crop needs and maintaining crop productivity. It is evident that direct or indirect crop drought assessment for the field of inter-est is a prerequisite for optimizing irrigation strategy and maximizing water-use efficiency.2 Consequently, this work
is focused on indirect wheat drought assessment by using
∗Part of the work in this paper has been presented on the 37th Chinese Control Conference, Wuhan, China. The dataset in this work is available upon reasonable request.
†Corresponding author.
machine learning approaches. Comparative experimental wheat fields are carefully designed including wet wheat and dry wheat, based on which both Unmanned Aerial Vehicle (UAV) imageries and ground soil water ratio data are col-lected for system construction and validation.
Various crop drought monitoring approaches are avail-able in the literature, which can be broadly divided into di-rect ground measurement based and indidi-rect remote sens-ing based approaches.3 Ground based approach is
rela-tively accurate, however, usually labour-intensive, time-consuming, with a high cost, and so unable to meet the actual needs for vast land areas. This is because a large amount of uniform sampling points are required to cover a large area of interest, and lab experimental test is further required to determine the crop/soil water stress. As a re-sult, there is a trend to adopt remote sensing technology to timely infer drought information extracted from various in-strumentation including electro-optical and radar sensors.
For example, satellites equipped with multispectral camera can provide useful moisture information regarding the soil and crop, where short-wave infrared bands are di-rectly related to water absorption4and near-infrared band is also closely related to plant water status.5Although
suit-able for large area application, it is also acknowledged that there are certain limitations for satellite based remote sens-ing.6, 7 First, the cost of satellite remote sensing is usually
high. Secondly, the spatial resolution of satellite imagery is usually low, e.g. 10+ meters, leading to the problem of mixed pixel and so not suitable for farmland of small or middle scales. Thirdly, satellite can be easily affected by environmental variations such as cloud. Moreover, the re-visit time of satellite is usually fixed and not flexible.
With user-defined spatial-temporal resolutions, a low cost and flexibility, UAV based remote sensing is drawing ever-increasing research interest, and has become an impor-tant complement for satellite and manned aircraft based remote sensing.6 In this approach, different
instrumenta-tions (e.g. red-green-blue (RGB), multispectral, hyperspec-tral and thermal cameras, and radar) can be installed on UAV flying at different altitudes for various applications including crop classification, estimation of agronomic pa-rameters (e.g. leaf area index, biomass, nitrogen content, plat density), disaster monitoring (e.g. pest, weed, disease,8 lodging and water stress3, 9), among many others.
In particular, RGB imagery, due to its high spatial res-olution, a low price and high accessibility, has recently at-tracted much research interest and been applied to diverse applications. For example, the problem of tomato detection is considered10 by using UAV aerial RGB imageries, where
both spectral and spatial features are accommodated in machine learning algorithm construction. Some other typ-ical applications of RGB image for high-throughput stress phenotyping in plants are referred to a recent survey pa-per,11where different classical machine learning algorithms are discussed for different tasks. Recently, the popular deep learning algorithms, due to its strong capability in auto-matically extracting non-local features, have also been ap-plied in precision agriculture. For example, Fully
Convolu-tional Network (FCN) and SegNet algorithms are applied to aerial RGB image for semantic segmentation (crop and weed discrimination),12, 13respectively. There is also a
sur-vey paper on the application of deep learning in precision agriculture.14 It is noted, however, that no existing work
to date has exploited the potential of aerial RGB image in crop water stress evaluation with experimental validation. Consequently, this work focuses on developing a ma-chine learning based crop drought mapping system by using UAV remote sensing imagery. In particular, RGB camera is chosen due to its high resolution, easy accessibility and practicability in comparison with multispectral and hyper-spectral cameras, where relatively complicated camera and data calibration is required. The main steps of the devel-oped system are summarized below.
(1) Data pre-processing: pre-process UAV imageries to derive an orthomosaic image using the commercial Agisoft software and crop the region of interest; (2) Wheat pixel segmentation: segment wheat pixels
from background using the classical normalized ex-cess green (NExG) index15 to attenuate the
ad-verse effects of soil pixels;
(3) Feature extraction and classifier training: extract appropriate features for wheat pixels, and train classification model.
(4) Deploy the learnt classifier to the field of interest to generate a water stress classification map, based on which follow-up treatment can be performed. Compared to the existing machine learning approaches on related topics (e.g. pixel-wise classification,16deep
learn-ing based image labelllearn-ing12, 17), the developed system,
adopting pixel square and crop segmentation for pure vege-tation pixels, can not only process a large number of aerial survey imageries in an effective, efficient and robust way but also do not rely on a large number of labelled train-ing samples (e.g. deep learntrain-ing based approach) which is expensive and labour-intensive in precision agriculture ap-plications.18
2. Materials
In this section, materials for wheat water stress map-ping experiments are presented including study site, UAV-camera system for airborne imagery acquisition and field measurements for wheat drought ground truth data.
2.1. Study site: experimental wheat field
The study was carried out in the wheat fields (see, Fig 1) of Gucheng Agrometeorological Experimental Centre of the China Meteorological Administration in Dingxing County, Hebei Province, North China Plain (latitude: 39o080N,
longitude: 115o400E, 15.2 m a.s.l.)19, 20 The region is of
warm temperate continental monsoon climate, where the mean annual temperature, rainfall and hours of sunshine
are 11.7oC, 528mm (mostly in June-September) and 2659 hours, respectively.2018 wheat plots of size 4m×2m with soil depth of 3m are considered for soil water ratio experi-ment. The wheat plots are well separated from each other (to avoid horizontal water exchange) and underneath soil (to avoid vertical water exchange) by using brick and con-crete. The soil is typical Haplic Luvisol (FAO) with a pH of 8.1 and a bulk density of 1.35 g×cm−3. The average
field moisture capacity (0-200cm depth soil underneath the ground) is about 23%. The crop under investigation is win-ter wheat (with growth duration 237-245 days) sowed in early October of 2016 using drilling approach with seed rate of about 260kg/hm2(or equivalently 1.5×10⁵seedlings per
hm), where the parallel wheat row distance is 22cm. Con-sidering that the main purpose of the study is to inves-tigate the effect of water stress on winter wheat growth, soil moisture is the key control variable while other treat-ments (e.g. fertilizer) follow the standard of winter wheat in this region.20Soil moisture at seeding time for all wheat
plots are the same, which was about 80% of the field mois-ture capacity. Two types of water treatments were then performed from seedling establishment in March for winter wheat plots, so that the soil moisture of dry wheat plots and wet wheat plots are roughly within 40%-55% and over 80% of field moisture capacity, respectively. In particular, for dry plots irrigation is implemented when soil moisture level is below 40% of field moisture capacity; while for wet plots irrigation is implemented when soil moisture level is below 80% of the field capacity. In this process, neutron moisture gauge is buried at the depth of 2 meters for each plot to measure the soil moisture level. The UAV survey was conducted on 9th, April, 2017, where the winter wheat was in early jointing stage.
Fig. 1. Location of the experimental wheat field.
2.2. UAV-camera system and UAV imagery In this work, a commercial aircraft DJI S1000 (DJI com-pany, Shenzhen, China) and a Sony NEX-7 camera consti-tute a platform of low altitude UAV-camera system (see, right plot of Fig 2). The specification of DJI S1000 is referred to the work.21 The weight, resolution and focal
length of Sony NEX-7 are 560g, 6000×4000 and 16mm, re-spectively. The camera setting is as follows: exposure time (1/1250), ISO (200), WB RGB Levels (637, 256, 381), Field
of view (73.7 deg), light value (12.3). During the flight, the camera was fixed on a gimbal, pointing vertically down-wards.
Fig. 2. Wheat plots (left) and UAV-camera system (right).
The airborne campaign was conducted at about 20 me-ters above the ground. A laptop installed with Ground Con-trolling Station software was used to plan, monitor and con-trol the autonomous UAV flight. The planned flight path, flight velocity and camera triggering are designed so that images with overlap and sidelap up to 75 % could be ob-tained for the purpose of good stitching. 36 high-resolution UAV images were obtained and stitched using commercial software PhotoScan (Agisoft, Russia) so that an orthomo-saic image (covering an area of 3540m2) could be generated as shown in Fig 3. The ground resolution of the orthomosaic image is 0.454cm/pixel.
Fig. 3. Orthomosaic image derived by Agisoft PhotoScan.
RGB image for the Region of Interest (RoI) is man-ually cropped from Fig 3 and shown in Fig 4, where 18 different wheat plots are analysed including 11 wet plots and 6 dry plots. For the sake of simplicity, the left-column plots are termed West 1 to West 6 from top to bottom, similarly, the middle-column plotiand right-column ploti are termed Middleiand East i, respectively.
RGB image 500 1000 1500 2000 2500 500 1000 1500 2000 2500 3000
Fig. 4. RGB image of RoI cropped from orthomosaic image.
2.3. Field measurements of water ratio
Crop physiological parameters (e.g. crop water content, leaf/stem water potential and sap flow22, 23) are ideal in-dicators for crop water status; while soil or substrate water content, indicating water availability in the root zone, is not always directly correlated with plant water status.23
In this work, as highlighted in Section 2.1, soil moisture of different wheat plots are specifically designed into two lev-els from seedling establishment stage in a well controlled environment. The main focus of this work is on qualitative classification11rather than quantitative regression analysis
between drought level and various features. As a conse-quence, soil moisture is chosen to indicate wheat drought status for ground truth data labelling, although it is not suitable for crop drought quantification.
To this end, the raw soil samples of each plot were col-lected on 10th, April, 2017 at the depth of 10 cm and 20 cm respectively to attenuate measurement errors. It should be noted that more sampling points are required for large wheat plots or plots in natural fields due to the spatial in-homogeneity of water distribution. After raw soil samples were weighted by using Electronic Balances BS-423S, they were then processed by using Drying Ovens DHG-9245A to remove water and weighted again so that soil water ratios were calculated by the ratio, where the final soil water ratio was calculated by taking the average as shown in Fig 5.
0 0.05 0.1 0.15 0.2 0.25 Water rate East1East2East3East4East5East6
Middle1Middle2Middle3Middle4Middle5Middle6West1West2West3West4West5West6 Plot name
Fig. 5. Ground truth of soil water ratio for wheat plots.
It follows from Fig 5 that soil water ratios can be broadly divided into two classes, e.g. high and low, and consequently wheat plots are termed wet wheat plot and dry wheat plot respectively depending on its correspond-ing soil water ratio. Considercorrespond-ing that only two levels of soil water ratio are available in the dataset, supervised classi-fication is considered. With more levels of soil water ratio, regression analysis between wheat water stress and vari-ous vegetation indices can also be performed, which will be investigated in the future.
3. Method
There is no explicit relationship between UAV imagery and soil water ratio, therefore their implicit relationship is to be worked out by using data-driven approaches.24 Con-sequently, in this paper, a machine learning based crop drought mapping system is developed, which is validated by high-resolution UAV remote sensing RGB imagery. The complete flowchart of the proposed system is displayed in Fig 6, which mainly consists of image preparation and pre-processing, wheat pixel segmentation, training sample construction including feature extraction, classifier training and classification map generation. In the following subsec-tions, key elements of the developed system are elaborated.
Training region Classification map Aerial images Orthophoto Otsu thresholding NExG Feature extraction Wheat area Soil moisture Ground truth Classifier training Region of interest Noise removal Spectral; Colour indices;
Fig. 6. Flowchart of the proposed machine learning based crop drought mapping system.
3.1. Image pre-processing
With a series of aerial imageries, commercial software Pho-toScan is first adopted to generate an orthomosaic image (see, Fig 3). Then orthomosaic image is processed using Gaussian blur filter to reduce the effect of random noise. On this basis, the region of interest (see, Fig 4) can be cropped from orthomosaic image for the following wheat pixel segmentation and other machine learning tasks.
3.2. Wheat segmentation
Different from conventional studies which evaluate wheat water stress by assessing the status of soil, this paper
di-rectly works on wheat. To this end, it is necessary to sepa-rate wheat pixels from soil and residue background. This is because the presence of soil pixels will bring adverse effects on classification performance, and even if soil pixels im-prove the classification accuracy for this dataset, it might not generalize in other situations, where more explanations are given in Section 3.3.2. Actually, in many precision agri-culture applications including weed detection, disease mon-itoring8 and crop drought assessment, it is a necessity to
extract vegetation (e.g. crops and weeds) from background (e.g. soil, residues and shadows) so that subsequent anal-ysis can be performed.25 A number of methods have been
developed for vegetation segmentation (see, a recent survey paper26).
Crop segmentation is usually achieved by inspecting the differences in spectral reflectance between vegetation and soil pixels. Green plants usually show relatively low values in Red and Blue bands while with a peak in Green band in comparison to background pixels.26 However,
ini-tial studies demonstrate that non-normalised RGB values were not suitable for this task, since they are directly proportional to the total light reflected from a surface and therefore highly sensitive to illuminating intensity.27
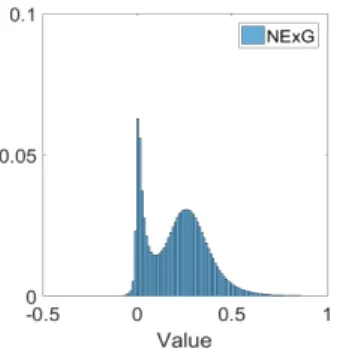
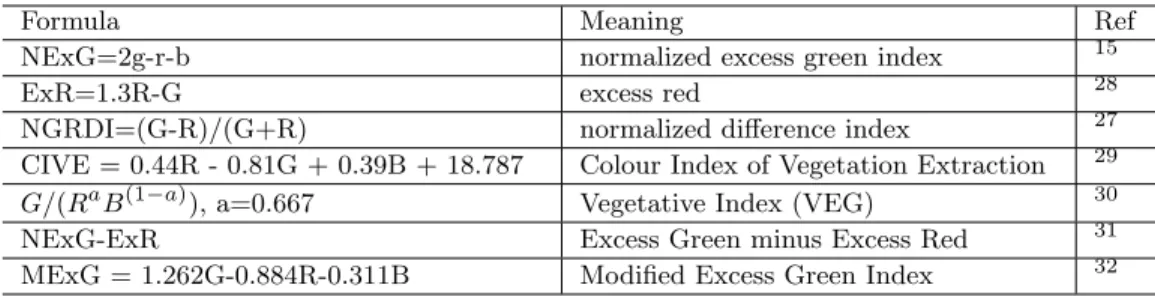
Instead different colour based vegetation indices are fre-quently used in the literature. To ease understanding of the notations, in this work, Red, Green and Blue denote the digit number of RGB channels either in the range of [0,255] or [0,1]; while red, green and blue denote the normalized values (or chromaticity conversion) of Red, Green and Blue by dividing Red, Green and Blue by (Red+Green+Blue). There exist a number of vegetation indices to segment crop from background, which are summarized in Table 1. In this work, NExG is adopted due to its fine performance via trial and error experiments, where visual inspection is adopted to assess the vegetation segmentation perfor-mance;33NExG represents the difference of the divergence of both red from green and blue from green. The prob-ability histogram of NExG for ROI in Fig 4 is displayed in Fig 7. It follows from Fig 7 that there are obvious two peaks in NExG histogram, which correspond to wheat and background pixels, respectively.
Fig. 7. Probability histogram for vegetation index NExG.
To remove background pixels from the RGB imagery including road, soil and shelter above wheat field, it is nec-essary to define an appropriate threshold for the one
di-mensional distribution in Fig 7. In this paper, the well known Otsu’s thresholding method34 is adopted, which finds the optimal threshold by maximizing the weighted sum of between-class variances. The derived threshold is 0.245 and the corresponding wheat segmentation result is shown in Fig 8.
Fig. 8. Wheat segmentation by Otsu’s thresholding: wheat pix-els (white), background pixpix-els (black).
Remark:In this work, a vegetation index is adopted to segment wheat pixels from background pixels due to its simplicity and generality. More advanced algorithms can also be adopted to achieve this task such as unsupervised clustering or supervised classification algorithms.26
3.3. Samples and feature extraction
Machine learning applications rely on training samples. In this section, training samples with features for classification model construction are detailed.
3.3.1. Samples
A vital step in image classification is to define appropriate training samples, from which features can be extracted. In remote sensing application for precision agriculture, there are generally a large number of pixels (in particular for images with a high spatial resolution) and pixel-wise clas-sification is usually time-consuming in both offline training and online classification. In addition, the features in pixel-wise classification are usually limited to pixel values and more representative features, e.g. texture feature, geomet-ric feature and statistical feature, can not be effectively defined (note: the recent deep learning based semantic seg-mentation algorithm12is also a promising approach to
ac-commodate spatial features, however, this approach is not exploited due to the limited labelled data in this study). To improve algorithm effectiveness, efficiency and robustness, in this work, instead of conducting pixel-wise classification a sample is defined by a pixel square of dimensionk×kwith kbeing a pre-defined value based on trial and error test.35
Table 1. Various vegetation indices for crop segmentation.
Formula Meaning Ref
NExG=2g-r-b normalized excess green index 15
ExR=1.3R-G excess red 28
NGRDI=(G-R)/(G+R) normalized difference index 27
CIVE = 0.44R - 0.81G + 0.39B + 18.787 Colour Index of Vegetation Extraction 29
G/(RaB(1−a)), a=0.667 Vegetative Index (VEG) 30
NExG-ExR Excess Green minus Excess Red 31
MExG = 1.262G-0.884R-0.311B Modified Excess Green Index 32
since k2 pixels are treated as one sample. It should also be noted that a pixel square may contain both wheat pix-els and soil pixpix-els, where soil pixpix-els have adverse effects on classification performance. Consequently, wheat pixel seg-mentation is necessary to attenuate the adverse effects.
The ground truth data for soil water rate is given in Section 2.3, however, it is for each plot rather than specific wheat pixels or pixel squares. In this paper, the training samples along with their labels under wet and dry soil plots are determined by Algorithm 1.
Algorithm 1: Steps to prepare samples
(1) Plot selection: The pixels in plots West 1, 2, Middle 1, 2 and East 1, 2 are chosen for wet wheat, and the pixels in West 3, 4 ,5 and East 3, 4 , 5 are for dry wheat; (2) Pixel square: The aforementioned regions are gridded
into pixel squares of dimensionk×k withk= 19; (3) Non-wheat pixel removal: For all pixel squares, only
these pixel squares where the wheat pixel proportion is over 20% are kept as training samples.
(4) Sample label: The remaining pixel squares after non-wheat pixel removal are automatically labelled using the corresponding plot label.
Following Algorithm 1, a training dataset is defined, which is used for feature extraction in the following sub-section.
3.3.2. Feature extraction
With training samples prepared in Section 3.3.1, we fur-ther define appropriate features to maximally represent sample properties. Various features can be extracted from a pixel square. Considering that this work is focused on wheat drought mapping, features related to wheat density (e.g. canopy cover, geometrics) are not to be learnt. This is mainly because many factors may lead to the variation of wheat density such as sowing density, wheat row spacing among many others. Following this line of thought, two sets of features closely related to wheat color and vigour are de-fined including spectral intensities and Colour Index (CI) features, summarized in Table 2. For the sake of simplic-ity, only mean values of spectral bands and colour indices
for vegetation wheat pixels (excluding soil pixels) within a square are defined as features.
Table 2. Various sets of features. Spectral intensities (3) Colour Index features (7)
Red, Green, Blue ExR, CIVE, Green/Red (GoR),
NExG, NGRDI, VEG, MExG
Different features have different discrimination capa-bilities in a given classification task. Therefore, it would be interesting to assess the importance of different features. Various algorithms can achieve this task.8In this work, the
classical feature ranking algorithm is preferred due to its simplicity and efficiency, where mutual information value36
between feature and class label is chosen as the criterion.
3.4. Classifier construction
With labelled training samples for wet and dry wheat, the next step is to train a classifier that can label any new samples automatically. Different classification algorithms are available in the literature. In this work, the classifier is determined by following the below two steps
(1) A built-in App termed “classificationLearner” in Mat-lab is first used to quickly assess the performance of dif-ferent classifiers, including Decision tree, Discriminant analysis, Logistic regression, Support Vector Machine (SVM), K-Nearest Neighbors (KNN) and their vari-ants. The most suitable one in terms of classification accuracy using five-fold cross validation and computa-tion time is identified.
(2) Hyperparameters of the classifier in Step (1) (e.g. ker-nels and their related parameters in SVM) are further optimized by using Bayesian optimization.37 For the
sake of completeness, a classifier with Bayesian hyper-parameter optimization is summarized in Algorithm 2.
Algorithm 2: Classifier with Bayesian hyperparameter optimization
(a) Cross-validation partition: Given a labelled dataset, randomly partition the dataset into K disjoint folds of roughly equal size.
(b) Optimization problem: Define the hyperparameters to be optimized as λ ∈ Ω, for each j = 1,2,· · ·, K, construct classification model with hyperparametersλ to the other K−1 parts and compute the classifica-tion error Ej(λ) in predicting the jth part. The cross validation error is defined by the following objective function f(λ) :=CV(λ) = K X j=1 Ej(λ)/K, (1) and consequently the optimization problem is given by
λopt= arg min λ∈Ω
f(λ). (2) (c) Bayesian optimization: Different from grid search, random search or manual tuning, Bayesian optimiza-tion optimally suggests new parameters by sequentially performing: 1. fitting a Gaussian process model Qfor data points{λi, f(λi)}, and also updating it with new data points; 2. finding the new point for evaluation that maximizes the acquisition function based on the poste-rior distribution functionQ.
(d) Optimized classifier: Stop the evaluation when cer-tain stopping criterion (objective function evaluation limit is chosen as 15 in this work) is satisfied and re-turn the classifier with optimized hyperparameters.
Following Steps (1) and (2), an optimized classifier can be developed, which can be used to assess the effect of dif-ferent sets of features and can also be applied to classify the region of interest for practical applications.
3.5. Performance evaluation
Metrics for performance evaluation are further discussed. In the field of machine learning, True Positive (TP) denotes the correctly predicted positive values; True Negative (TN) denotes the correctly predicted negative values; False Pos-itives (FP) represents the scenario that actual class is no and predicted class is yes; and False Negative (FN) rep-resents the scenario that actual class is yes but predicted class is no. With these four parameters, various metrics can be defined to evaluate model performance. For symmetric datasets, Accuracy is a good measure, which is given by
Accuracy= T P +T N
T P +F P+F N+T N. (3) To handle data with uneven class distribution, Preci-sion, Recall andF1 score are also considered. In this work,
these values are first calculated for each class, and their
average values are chosen as the metrics. Precision, Recall andF1 score for a specific class are defined by
P recision= T P T P+F P, Recall= T P T P +F N, F1score= 2T P 2T P+F P +F N . (4) 4. Results
In this part, experimental validation is performed for the developed machine learning based crop drought map-ping system. Following the results in preceding works33
and,16SVM with Gaussian kernelK
gaussian=exp(−||x− z||2/2σ2) is chosen as the classifier due to its fine
perfor-mance in terms of accuracy and computational time. All the algorithms in this work are implemented in Matlab 2017a on Windows computer using Intel Core i7-6500U [email protected] with RAM 16GB.
It is also noted that in SVM classifier with Gaus-sian kernel, two hyperparameters are optimized by using Bayesian optimization including σ in Gaussian kernel and BoxConstraint C (also termed cost parameter) penalizing the misclassified points. The ranges forσandCare within [e−5, e5]. The maximum objective evaluations are chosen as 20 based on trial and error tests.
4.1. Pixel-wise classification
Pixel-wise classification is first considered for the purpose of algorithm comparison (accuracy and computation time). In this approach, spectral bands including red, green and blue are directly treated as features. The histogram com-parison between wet wheat samples and dry wheat samples in term of spectral bands are displayed in Fig 9.
Fig. 9. Probability histogram of spectral bands for wet (upper plots) and dry (lower plots) wheat pixels: upper plots from left to right are for red, green and blue.
It follows from Fig 9 that the pixel-wise spectral in-tensities between wet wheat pixels and dry wheat pixels
have too much overlap, which will result in a poor classifi-cation performance. The classificlassifi-cation confusion matrix for pixel-wise classification is displayed in Fig 10.
Wet Dry Precison Target Class Wet Dry Recall Output Class SVM (pixel) 80220 72.7% 4356 3.9% 94.8% 5.2% 14652 13.3% 11175 10.1% 43.3% 56.7% 84.6% 15.4% 72.0% 28.0% 82.8% 17.2%
Fig. 10. Confusion matrix for pixel-wise SVM classifier with spectral bands.
In confusion matrix Fig 10, the diagonal cells in green show the number/percentage of correct classification, while the off-diagonal cells show the misclassification. The right-most column presents the accuracy for each predicted class (termed precision), the bottom row shows the accuracy for each true class (termed recall). In particular, Precision, Re-call andF1score for Wet class are 84.6%, 94.8% and 89.4%;
and the ones for Dry class are 72.0%, 43.3% and 54.0%. As a result, the average Precision, Recall and F1 score for
pixel-wise classification are 78.3%, 69.0% and 71.7%, re-spectively. The cell at the right bottom shows the overall accuracy, which for pixel-wise SVM classification is 82.8%.
4.2. Developed system
The developed system is further validated using the col-lected dataset. The labelled areas are first gridded into cor-responding pixel squares using Algorithm 1, so that various sets of features can be extracted including spectral inten-sities and CI features as discussed in Section 3.3.2. In the following performance analysis, the popular three-fold cross validation is used, which takes the problem of overfitting into account.
4.2.1. Spectral features
Experimental results for SVM with spectral intensities are first presented. It is noted that although the spectral bands in this study are the same as pixel-wise classification, the main difference is that original band values are used in pixel-wise classification while mean values of spectral bands for the vegetation pixels in a wheat square are used in the developed system. The estimated cross-validation error function values over various combinations of BoxConstraint C and Gaussian kernel parameter σ are displayed in Fig
11. The confusion matrix of SVM with spectral intensities is displayed in Fig 12.
Fig. 11. Estimated objective function value over various values of BoxConstraint and Sigma.
Wet Dry Precison Target Class Wet Dry Recall Output Class SVM (Spectral) 5779 66.3% 306 3.5% 95.0% 5.0% 575 6.6% 2063 23.7% 78.2% 21.8% 91.0% 9.0% 87.1% 12.9% 89.9% 10.1%
Fig. 12. Confusion matrix for spectral intensities.
It can be calculated from Fig 12 that the average Pre-cision, Recall,F1score and accuracy for SVM with spectral
intensities are 89.0%, 86.6%, 87.7% and 89.9%, respectively.
4.2.2. CI features
The performance of CI features is further evaluated. It is noted that CI features are also applied to pixel-wise clas-sification, however, the result is not presented. This is be-cause the results in Section 4.1 and 4.2.1 have shown that pixel-wise classification is not suitable for wheat drought mapping due to its poor performance and high computa-tion load. The confusion matrix of SVM with CI features is displayed in Fig 13. It follows from Fig 13 that the average Precision, Recall, F1 score and accuracy for SVM with CI
Wet Dry Precison Target Class Wet Dry Recall Output Class SVM (CI) 5795 66.5% 290 3.3% 95.2% 4.8% 355 4.1% 2279 26.1% 86.5% 13.5% 94.2% 5.8% 88.7% 11.3% 92.6% 7.4%
Fig. 13. Confusion matrix for CI features.
4.2.3. Spectral+CI features
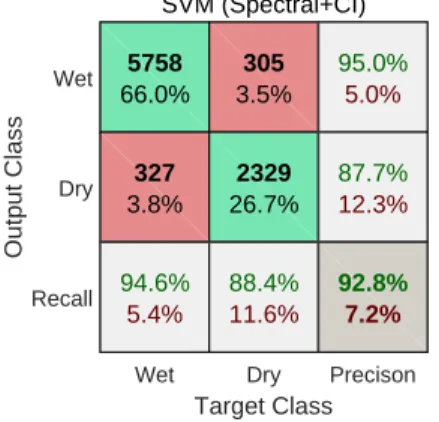
In this part, CI features and spectral intensities are pooled together as the features for SVM classifier of the developed system. The confusion matrix for SVM with both Spectral and CI features is displayed in Fig 14. Similarly, it follows from Fig 14 that the average Precision, Recall,F1score and
Accuracy are 91.4%, 91.5%, 91.5% and 92.8%, respectively. In addition, the top three features identified by the mutual information based feature ranking approach in Section 3.3.2 are GoR, NGRDI, ExR, respectively.
Wet Dry Precison Target Class Wet Dry Recall Output Class SVM (Spectral+CI) 5758 66.0% 327 3.8% 94.6% 5.4% 305 3.5% 2329 26.7% 88.4% 11.6% 95.0% 5.0% 87.7% 12.3% 92.8% 7.2%
Fig. 14. Confusion matrix for spectral and CI features.
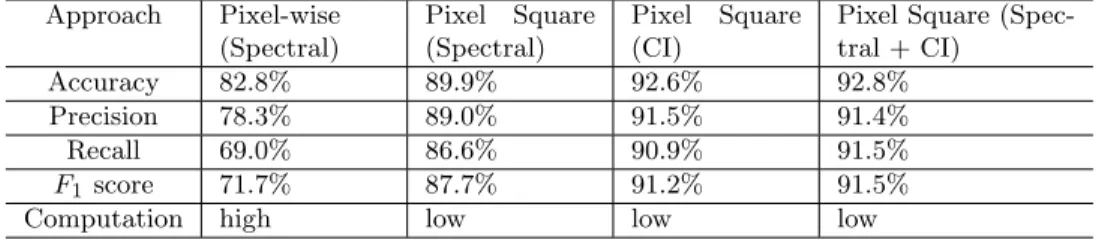
The performance comparison between pixel-wise clas-sification and the developed systems with various sets of features are summarized in Table 3.
It follows from Table 3 that the proposed region-wise classification substantially outperforms the pixel-wise clas-sification in terms of Accuracy, Precision, Recall, F1 score
and computation time. CI features obtain a better perfor-mance than spectral intensities due to the increased fea-ture dimension for data representation. In addition, by aug-menting CI features with spectral intensities, performance metrics except Precision can be further improved to some extent.
4.3. Application to ROI
The developed system in Section 4.2.3 is also applied to the whole ROI for visual assessment. The ROI is first gridded into corresponding pixel squares using Algorithm 1 so that features can be extracted for the wheat pixels within the square. The time for feature calculation and classification is about 2.5 sec and 0.25 sec, respectively. The classification map is displayed in Fig 15. To make the result more inter-pretable, the corresponding ground truth map for different plots is also displayed. It can be visually seen from Fig 15 that the ratio of yellow pixels is very high in dry plots and very low in wet plots and so the classification result is very positive.
Classification map
Fig. 15. Left: ground truth; Right: result with background pix-els (blue), wet pixpix-els (cyan) and dry pixpix-els (yellow).
5. Discussion
Crop water stress monitoring plays a key role in intel-ligent irrigation system and precision crop management. Conventional drought monitoring mainly relies on satel-lite equipped with multispectral equipment. In this regard, a very popular index, Normalized Difference Water Index (NDWI), has been proposed by using NIR band and short-wave infrared band directly related to water absorption.4
Although suitable for large scale applications, satellite re-mote sensing may not be suitable for small-scale farmland due to its low spatial resolution and fixed revisit time. UAV based remote sensing is now drawing increasing attention and has become an important complement to satellite re-mote sensing in various areas including precision agricul-ture due to its user-defined spatial, spectral and temporal resolutions.6Consequently, this work exploits the potential
of UAV in wheat drought monitoring.
Regarding crop water stress monitoring, most of the existing studies rely on multispectral and thermal cam-eras.9, 23, 38 This is because crop water stress generally has
effect on spectral reflectance and crop temperature. How-ever, little work has been done on RGB camera for crop stress monitoring, which is the focus of this work. RGB camera, in comparison with multispectral or thermal cam-era, is easily accessible, much cheaper, with a high spatial resolution and requires simple data preprocessing.39 With
cam-Table 3. Performance comparisons for systems with various sets of features. Approach Pixel-wise (Spectral) Pixel Square (Spectral) Pixel Square (CI)
Pixel Square (Spec-tral + CI)
Accuracy 82.8% 89.9% 92.6% 92.8%
Precision 78.3% 89.0% 91.5% 91.4%
Recall 69.0% 86.6% 90.9% 91.5%
F1 score 71.7% 87.7% 91.2% 91.5%
Computation high low low low
era, the advantage of high spatial resolution of RGB camera is exploited in this work by integrating vegetation segmen-tation and machine learning techniques.
In the developed drought mapping system, various classical techniques are integrated including crop segmen-tation, feature extraction, Bayesian optimization and SVM classifier. In particular, the main novelty lies in spatial grouping of pixels into feature units of pure vegetation pix-els on a field crop. In comparison to conventional pixel-wise classification,7, 16 the developed area-wise
classifica-tion takes wheat spatial informaclassifica-tion (i.e., wheat pixels within a wheat square is more likely to share the same drought status) into account. As a result, the developed system not only improves the classification performance in terms of Precision, Recall,F1score and Accuracy, but also
substantially reduces the computation load due to the sig-nificantly reduced data volume. In particular, the accuracy of the developed system with spectral intensities is 89.9% with F1 score of 87.7%, which is much better than
pixel-wise classification with an accuracy of 82.8% and F1score
of 71.7%.
This work also investigates how to improve the clas-sification performance via feature engineering by generat-ing a number of color indices from original R-G-B bands. CI features obtain a better performance with (i.e. Accu-racy of 92.6% and Recall of 90.9%) than original R-G-B bands. This is because CI features with a higher dimension can better represent data properties. In addition, the com-bination of spectral and CI features can further improve the classification performance (i.e. Accuracy of 92.8%) al-though the improvement is marginal. This is because there may be data redundancy when a large number of features are generated.
To summarize, it can be concluded that remote sens-ing RGB imagery of a UAV flysens-ing at a low altitude (e.g. 20m) can provide valuable information for wheat drought assessment. The main reason is that wheat grew in dry soil condition will reflect different RGB reflectance from the wheat grew in wet soil condition and the differences can be effectively learnt by machine learning algorithms.
Although the results are very positive, there are still certain limitations in the experiment design and room for further improvement. For example, the dataset in this work is relatively small (e.g. single UAV flight), datasets of dif-ferent growing stages (or even difdif-ferent crops) are more desirable. Then new algorithms should be developed to ac-count for the temporal and crop information. Deep learning algorithms12are alternatives to conventional classifier (e.g.
SVM) so that deep and non-local features automatically learnt from big data can be effectively leveraged. In addi-tion, to perform a more reliable and robust crop drought mapping (especially for early drought monitoring), spectral bands such as NIR and Short-wavelength for water absorp-tion should be further considered. To this end, we are plan-ning to adopt the state-of-the-art multispectral RedEdge camera (MicaSense, Seattle, USA; with five wide-bands in-cluding Blue, Green, Red, RedEdge and NIR),8 based on which the cost Vs accuracy trade-off between RGB and multispectral approaches can be analysed. In applying mul-tispectral camera, performing image calibration would also be a vital step to make the results more consistent under various conditions, since camera parameter setting and en-vironmental variations would affect image digital number. Experiments should be further designed so that wheat un-der different levels of drought stress is available so that a regression analysis can be conducted between spectral in-dices and soil water content.
6. Conclusions
In this work, a machine learning based crop drought map-ping system is developed by integrating crop segmentation, feature engineering, Bayesian optimization and classifica-tion algorithms. To validate the effectiveness of the devel-oped system, an experiment has been carefully designed to generate wheat plots under two different levels of soil mois-ture condition. High-resolution UAV remote sensing RGB imageries are collected by using DJI-S1000 with Sony NEX-7 camera along with corresponding ground water ratio data for different wheat plots. Comparative cross-validation ex-perimental results show that
(i) Pixel-wise classification is not suitable for wheat drought mapping due to the non-uniformity of spectral information of wheat leaf and high com-putation load.
(ii) The developed system, relying on pixel square for vegetation feature extraction, outperforms pixel-wise classification in terms of Accuracy, Precision, Recall,F1 score and computation time.
(iii) The accuracy of the developed crop drought stress mapping system with spectral intensities is 89.9%, and the accuracy can be further improved to 92.8% by fusing both spectral and colour indices features.
Acknowledgments
This work was supported by Science and Technology Facil-ities Council (STFC) under Newton fund with grant num-ber ST/N006852/1 and the Newton Network+ NeWMap project. Shibo Fang was supported by National Natural Science Foundation of China (NSFC) with grant number 61661136005.
References
[1] H. Nilsson, Remote sensing and image analysis in plant pathology, Annual Review of Phytopathology
33(1) (1995) 489–528.
[2] M. Rossini, F. Fava, S. Cogliati, M. Meroni, A. March-esi, C. Panigada, C. Giardino, L. Busetto, M. Migli-avacca, S. Amaducciet al., Assessing canopy pri from airborne imagery to map water stress in maize, IS-PRS journal of photogrammetry and remote sensing
86(2013) 168–177.
[3] J. Bellvert, P. Zarco-Tejada, J. Girona and E. Fer-eres, Mapping crop water stress index in a pinot-noirvineyard: comparing ground measurements with thermal remote sensing imagery from an unmanned aerial vehicle,Precision agriculture15(4) (2014) 361– 376.
[4] B.-C. Gao, Ndwia normalized difference water index for remote sensing of vegetation liquid water from space, Remote sensing of environment 58(3) (1996) 257–266.
[5] J. Pe˜nuelas, I. Filella, C. Biel, L. Serrano and R. Save, The reflectance at the 950–970 nm region as an indi-cator of plant water status, International journal of
remote sensing14(10) (1993) 1887–1905.
[6] C. Zhang and J. M. Kovacs, The application of small unmanned aerial systems for precision agriculture: a review,Precision agriculture13(6) (2012) 693–712. [7] T. Zhang, J. Su, C. Liu and W.-H. Chen, Potential
bands of sentinel-2a satellite for classification prob-lems in precision agricultureInternational Journal of
Automation and Computing, Springer (2018).
[8] J. Su, C. Liu, M. Coombes, X. Hu, C. Wang, X. Xu, Q. Li, L. Guo and W.-H. Chen, Wheat yellow rust monitoring by learning from multispectral uav aerial imagery,Computers and electronics in agriculture155
(2018) 157–166.
[9] T. Zhao, B. Stark, Y. Chen, A. L. Ray and D. Doll, Challenges in water stress quantification using small unmanned aerial system (suas): Lessons from a grow-ing season of almond,Journal of Intelligent & Robotic
Systems88(2-4) (2017) 721–735.
[10] J. Senthilnath, A. Dokania, M. Kandukuri, K. Ramesh, G. Anand and S. Omkar, Detection of tomatoes using spectral-spatial methods in remotely sensed rgb images captured by uav,Biosystems
engi-neering146(2016) 16–32.
[11] A. Singh, B. Ganapathysubramanian, A. K. Singh and S. Sarkar, Machine learning for high-throughput stress
phenotyping in plants,Trends in plant science 21(2) (2016) 110–124.
[12] H. Huang, J. Deng, Y. Lan, A. Yang, X. Deng and L. Zhang, A fully convolutional network for weed map-ping of unmanned aerial vehicle (uav) imagery, PloS one13(4) (2018) p. e0196302.
[13] I. Sa, M. Popovi´c, R. Khanna, Z. Chen, P. Lottes, F. Liebisch, J. Nieto, C. Stachniss, A. Walter and R. Siegwart, Weedmap: a large-scale semantic weed mapping framework using aerial multispectral imaging and deep neural network for precision farming,Remote
Sensing10(9) (2018) p. 1423.
[14] A. Kamilaris and F. X. Prenafeta-Bold´u, Deep learn-ing in agriculture: A survey,Computers and
Electron-ics in Agriculture147(2018) 70–90.
[15] D. Woebbecke, G. Meyer, K. Von Bargen and D. Mortensen, Color indices for weed identification under various soil, residue, and lighting conditions,
Transactions of the ASAE38(1) (1995) 259–269.
[16] J. Su, D. Yi, C. Liu, L. Guo and W.-H. Chen, Di-mension reduction aided hyperspectral image classifi-cation with a small-sized training dataset: Experimen-tal comparisons,Sensors17(12) (2017) p. 2726. [17] A. Zeggada, F. Melgani and Y. Bazi, A deep
learn-ing approach to uav image multilabellearn-ing,IEEE
Geo-science and Remote Sensing Letters14(5) (2017) 694–
698.
[18] M. Chi, R. Feng and L. Bruzzone, Classification of hyperspectral remote-sensing data with primal svm for small-sized training dataset problem,Advances in
space research41(11) (2008) 1793–1799.
[19] S. Fang, D. Cammarano, G. Zhou, K. Tan and S. Ren, Effects of increased day and night temperature with supplemental infrared heating on winter wheat growth in north china, European Journal of Agronomy 64
(2015) 67–77.
[20] R. Liao, J. Liu, Y. Bai, S. An, H. Liang, J. Lu, Z. Le and Y. Cao, Spatial distribution of winter wheat root in soil under field conditions in north china plain, J
Meteor Environ30(2014) 83–89.
[21] J. Su, C. Liu, X. Hu, X. Xu, L. Guo and W.-H. Chen, Spatio-temporal monitoring of wheat yellow rust using uav multispectral imagery,Computers and electronics
in agriculture(2019).
[22] A. Elvanidi, N. Katsoulas, T. Bartzanas, K. Ferentinos and C. Kittas, Crop water status assessment in con-trolled environment using crop reflectance and tem-perature measurements, Precision Agriculture 18(3) (2017) 332–349.
[23] I. Garc´ıa-Tejero, J. Costa, R. Egipto, V. Dur´an-Zuazo, R. Lima, C. Lopes and M. Chaves, Thermal data to monitor crop-water status in irrigated mediter-ranean viticulture, Agricultural Water Management
176(2016) 80–90.
[24] D. Yi, J. Su, C. Liu and W.-H. Chen, Personalized driver workload inference by learning from vehicle re-lated measurements,IEEE Transactions on Systems,
[25] P. Lottes, R. Khanna, J. Pfeifer, R. Siegwart and C. Stachniss, Uav-based crop and weed classification for smart farming,Robotics and Automation (ICRA),
2017 IEEE International Conference on, IEEE (2017),
pp. 3024–3031.
[26] E. Hamuda, M. Glavin and E. Jones, A survey of im-age processing techniques for plant extraction and seg-mentation in the field,Computers and Electronics in
Agriculture125(2016) 184–199.
[27] A. Perez, F. Lopez, J. Benlloch and S. Christensen, Colour and shape analysis techniques for weed detec-tion in cereal fields,Computers and electronics in
agri-culture25(3) (2000) 197–212.
[28] G. E. Meyer, T. W. Hindman and K. Lakshmi, Ma-chine vision detection parameters for plant species identification,SPIE, Bellingham, WA, (1998). [29] T. Kataoka, T. Kaneko, H. Okamoto and S. Hata,
Crop growth estimation system using machine vision,
Advanced Intelligent Mechatronics, 2003. AIM 2003. Proceedings. 2003 IEEE/ASME International
Confer-ence on, 2, IEEE (2003), pp. b1079–b1083.
[30] T. Hague, N. Tillett and H. Wheeler, Automated crop and weed monitoring in widely spaced cereals,
Preci-sion Agriculture7(1) (2006) 21–32.
[31] G. E. Meyer and J. C. Neto, Verification of color veg-etation indices for automated crop imaging applica-tions,Computers and electronics in agriculture63(2) (2008) 282–293.
[32] X. P. Burgos-Artizzu, A. Ribeiro, M. Guijarro and G. Pajares, Real-time image processing for crop/weed discrimination in maize fields, Computers and
Elec-tronics in Agriculture75(2) (2011) 337–346.
[33] J. Su, M. Coombes, C. Liu, L. Guo and W.-H. Chen, Wheat drought assessment by remote sensing imagery using unmanned aerial vehicle,Chinese Control
Con-ference, the 37th, IEEE (2018).
[34] N. Otsu, A threshold selection method from gray-level histograms,IEEE transactions on systems, man, and
cybernetics9(1) (1979) 62–66.
[35] T. Liu, R. Li, X. Jin, J. Ding, X. Zhu, C. Sun and W. Guo, Evaluation of seed emergence uniformity of mechanically sown wheat with uav rgb imagery,
Re-mote Sensing9(12) (2017) p. 1241.
[36] T. M. Cover and J. A. Thomas,Elements of
informa-tion theory(John Wiley & Sons, 2012).
[37] J. Snoek, H. Larochelle and R. P. Adams, Practical bayesian optimization of machine learning algorithms,
Advances in neural information processing systems,
(2012), pp. 2951–2959.
[38] V. Alchanatis, Y. Cohen, S. Cohen, M. Moller, M. Sprinstin, M. Meron, J. Tsipris, Y. Saranga and E. Sela, Evaluation of different approaches for esti-mating and mapping crop water status in cotton with thermal imaging, Precision Agriculture 11(1) (2010) 27–41.
[39] R. Makanza, M. Zaman-Allah, J. E. Cairns, C. Magorokosho, A. Tarekegne, M. Olsen and B. M. Prasanna, High-throughput phenotyping of canopy cover and senescence in maize field trials using aerial digital canopy imaging,Remote Sensing10(2) (2018) p. 330.