Application of Economic Equity Value Added (EEVA) and True Value
Added (TVA) in explaining of Modern models derived from Free Cash
Flow (CVFCFF and CVFCFE)
Meysam KavianiDepartment of Accounting, Lahijan Branch, Islamic Azad University, Lahijan, Iran
Maryam Batebi
Department of Accounting, Astaneh Ashrafieh Branch, Islamic Azad University, Astaneh Ashrafieh, Iran
Reza Shahmanosuri
Department of Accounting, Qazvin Branch, Islamic Azad University, Qazvin, Iran
Abstract
Investors and financial managers nowadays expect through use of reliable measures to find out about real business profitability and performance. In response to this need, in recent years, financial experts, inside and outside the country, have tried a variety of performance metrics, including Cash Value Added (CVA), Created Shareholder Value (CSV), Shareholder Value Added (SVA), Residual Income (RI), Market Value Added (MVA), Economic Value Added (EVA), Adjusted Economic Value Added (AEVA), and Refined Economic Value Added (REVA), each of which conveying a different information content regarding company’s value and performance. To the same effect, the current study addresses two other economic performance indicators, namely True Value Added (TVA) and Equity Economic Value Added (EEVA), and their informational worth for CVFCFF and CVFCFE as the two new cash flow based valuation models in the automotive industry operating on Tehran Stock Exchange between 2005 and 2009. The results of the F-test performed in test of the hypotheses confirm significant association of the mentioned cash flow based evaluation models with TVA and EEVA. Keywords: EEVA, TVA, CVFCFF, CVFCFE
1. Introduction
Introduction of the notion of economic profit has led to a general recognition of the economic value added as the source of value creation for businesses and eventual appreciation of share value on the market. Hence, economic profit became indentified with market value of the firm, as other side of the one and same coin, the increase of which is regarded a synonym for a higher equity market value and a greater shareholder wealth. Thus, in light of the concept economic value, a variety of value-oriented performance measures are developed, including Economic Value Added (EVA), Market Value Added (MVA), Refined Economic Value Added (REVA), Adjusted Economic Value Added (AEVA), Shareholder Value Added (SVA), and created shareholder value (CSV), which in fact try to signal one and the same thing, i.e. shareholders’ wealth, but each from a different point of view. In addition to the above mentioned value metrics, there are two other value added based performance measures, i.e. Equity Economic Value Added (EEVA) and True Value Added (TVA), which have not been yet subject to any study within the context of the Iranian capital market. EEVA was proposed by Damodaran (2000), and TVA by Mohanty (2002) as part of the continuous effort in providing reliable metrics desired by investors and financial managers for verification of the information on profitability, liquidity, earnings potentials and permanence, sustainable growth, and risk of the businesses. Accurate application of performance and control measures and achieving company’s objectives thereby, has been long the motive behind the choice of the metrics. To this end, many companies have resorted to the key accounting variables such as sales, profit, and ratio of profit to sales in percents. Although these so called traditional metrics are still in use, they fall short of evaluating performance of managers, because profitability of a division is closely related to the amount of investment which is ignored by all of the traditional approaches (Kaviani, 2012). Considering the possible manipulation and distortion of the traditional measures which are predominantly based on accounting profit, many analysts have had recourse to cash flow based measures as the more concrete criteria which were supposed to be less susceptible to manipulation. And in a further step, they introduce the concept of Free Cash Flow (FCF) for measurement of company’s performance. Based on the FCF concept, various models of performance measurement have been introduced of which, Free Cash Flow to Firm (FCFF) and Free Cash Flow to Equity (FCFE) are the most important ones. The two models are further developed and brought in connection to value creation, resulting in Created Value from Free Cash Flow to Firm (CVFCFF) and Created Value from Free Cash Flow to Equity (CVFCFE) which was proposed and introduced by Meysam Kaviani (2013). Present
research by examining information value of EEVA and TVA for explanation of the free cash flow based valuation models CVFCFF and CVFCFE aims to provide the investors and financial decision makers with effective performance measurement tools as a support to their decision making process, and help reconcile and align interests of the managers with those of the shareholders through a more conscious and deliberate linking of manager’s bonus and remunerations to shareholders’ wealth.
2. FCF-based performance measures
Free cash flow is a performance measurement tool and represents the cash amount held by the firm after payment of the required costs of asset maintenance or development. Free cash flow is important in that it allows manager to seek for the opportunities producing a greater share value. Development of new products, business acquisitions, and payment of dividends and debts are made possible by adequate cash holding. On the other hand, there is a limit on the amount of cash holding, so as it should be kept at a level where a balance is struck between cost of cash holding and cost of insufficient cash holding. Free cash flow to firm (FCFF) is a performance indicator which represents the net amount of cash generated for the firm. This is the amount of cash available to all investors (both shareholders and debt-holders), after purchase and procurement, sales of products and supply of services, cash payment of operational expenditures, and short- and long-term investment. There are different approaches to calculation of FCFF, and in one of these approaches, FCFF is calculated as follows:
FCFF=NI+NCC+ [Int× (1-tax rate)]-FCInv-WCInv Where:
NI = net income NCC = noncash charge Int = interest expense
FCInv = fixed capital investment (capital expenditure) WCInv = working capital investment
Another application of FCF is for evaluation of equity (FCFE). FCFE is the operating cash flow after deduction of investment cost and payment of debt (principal and interest) to lenders. FCFE, more specifically, represents maximum payable earnings to shareholders which, among other methods, are calculable as follows:
FCFE=FCFF – [Int × (1- tax rate)] + net borrowing Where:
Net borrowing = long- and short-term new debt issues − long- and short-term debt repayments
Considering the use of free cash flow in the discounted cash flow methods for evaluation of companies, the required rate of return (discount rate) in case of FCFE would be cost of equity, and in case of FCFF, which is payable both to creditors and shareholders, the discount rate to be used would depend on the risk debt and equity. Therefore, in the latter case, weighted average cost of capital (WACC) is used as the discount rate. Cost of equity can be calculated by such equations as CAPM and APT models, or the method of return on bonds plus risk premium, or even by Gordon’s Growth Model. Free cash flow yield (FCFY) is obtained from dividing FCF by equity market value (EMV) in the beginning of the period. FCFY is a basically similar concept to share return which is normally calculated as dividend per share divided by price per share (according to generally accepted accounting principles). Hence, by replacing FCFF and FCFE per share with return per share, Free Cash Flow to Firm Yield (FCFFY) and Free Cash Flow to Equity Yield (FCFEY) can be calculated.
Free cash flow yields (FCFYs) convey the information of much use in investment decisions, and many financial analysts claim that company free cash flow compared to other accounting performance measures including Earnings Per Share (EPS) are less readily susceptible to manipulation.
As was discussed earlier, different discount rates are used for evaluation by FCFF and FCFE models. In case of FCFE, cost of equity is used, whereas in case of FCFF, the discount rate will depend both on the risk of equity and debt, therefore, a Weighted Average Cost of Capital (WACC) will be applied as the discount rate.
According to FCFF and FCFE models, value is created when the yield on FCFF (FCFFY) and FCFE (FCFEY) for a given period is greater than the expected return on investment (i.e. cost of capital and cost of equity). Hence, the created value obtained from the FCF-based models (firm created value in one year) is realized when the firm’s performance increases in excess of the expected amount. This model which was proposed by Meysam Kaviani (2013) is calculated based on the following equations:
CVFCFF= EMVt × [(FCFFt+1/ EMVt) - WACC] Or
Where,
CVFCFF: Created Value from Free Cash Flow to Firm EMVt: Equity Market Value at the beginning of the year
FCFFt+1: Free Cash Flow to Firm in one year
WACC: Weighted Average Cost of Capital And also:
CVFCFE= EMVt × [(FCFE t+1/ EMVt) - r)] Or
CVFCFE= FCFE t+1 (EMVt × r) Where:
CVFCFE: Created Value from Free Cash Flow to Equity EMVt: Equity Market Value at the beginning of the year
FCFEt+1: Free Cash Flow to Equity in one year
R: Required Return to Equity 3. Research background
Early in 1990, a number of studies on the relationship of free cash flow with business performance were conducted. Baskin (1989) demonstrates a negative correlation between profitability and debt ratio of companies. His findings do not support the assumption made by the FCF model which suggests control of debt contributes to increased firm performance. In addition, several papers address the relation of performance measures and MVA. For instance, Fingan (1991) documents a significant relationship between EVA and MVA in comparison to other performance measures, such as EPS, cash flows, capital growth, and ROE. O’Byrne (1996), in study of the relationship of share return with EVA, earnings (profit) measures, and FCF, concluded that unlike EVA, earnings measures were significantly correlated with share return.
Milunovich and Tseui (1996) report stronger correlation of MVA with EVA relative to EPS, EPS growth, ROE, FCF, and FCF growth.
Goetzman and Garstka (1999) maintain that long term survival of companies may depend on accounting profit for which EPS is the preferred measure over other accounting performance metrics and even above EVA for prediction of the firm’s future performance.
The findings of Turvey et al (2000) in the study of the relationship between EVA and share market return in a sample of 14 Canadian food companies did not suggest any association between the mentioned indicators.
Gunter et al (2000) in study of the German’s stock market gives a better account of EVA, DCF, CVA, and Tobin’s Q compared to the traditional accounting measures ROE, ROA, and ROS.
A number of researchers particularly focused valuation function of EVA. Shrieves and Wachowicz (2001) in comparative study of EVA, FCF, NPV (net present value) as three competing valuation measures do not observe any particular advantage in EVA relative to other ones and suggest a more or less identical valuation capability for all the three measures.
Worthington and West (2001) using cumulative time series examine the data of 110 Australian firms during 1992 through to 1998 and demonstrate stronger association of earnings to return (yield) relative to NCF (net cash flow), retained earnings and EVA. In another comparative study, Worthington and West (2004) examine the accounting measures Earnings Before Extraordinary items (ERN) and Net Operating Cash Flow (NCF) in comparison to the economic value measures residual income (RI) and EVA. Their results indicate EVA with the highest relevant information content relative to other indicators.
The earlier works, reviewed above, with contradictory results evidently signify lack of a general convergence round the best set of performance and evaluation measures. In a meta-analysis, Sharma and Kumar (2010) stated that only a few studies in developing countries could not provide evidence on superior performance of EVA relative to other measures. However, a recent study by Meysam Kaviani (2013) on information content of EVA in interpreting CVFCFF and CVFCFE as the new cash flow based valuation models for the Iranian automotive industry on Tehran Stock Exchange documents a positive and significant relationship between EVA and CVFCFF and CVFCFE models, suggesting EVA as a suitable indicator which can be applied by managers to assessment of CVFCFF and CVFCFE.
4. Hypotheses
- TVA and EEVA are significantly correlated with the created value from free cash flow to firm (CVFCFF) in the Iranian automotive industry of Tehran Stock Exchange.
- TVA and EEVA are significantly correlated with the created value from free cash flow to equity (CVFCFE) in the Iranian automotive industry of Tehran Stock Exchange.
5. Variable measurement and research model
The assumed relationship of TVA and EEVA with CVFCFF and CVFCFE was tested using the following regression models: it it it it it
it
EEVA
TVA
SIZE
GROWTH
CVFCFF
=
β
0+
β
1+
β
2+
β
3+
β
4+
ε
it it it it itit
EEVA
TVA
SIZE
GROWTH
CVFCFE
=
β
0+
β
1+
β
2+
β
3+
β
4+
ε
5.1. Dependent variables:
CVFCFFit: Created value from free cash flow to firm i in year t
CVFCFEit: Created value from free cash flow to equity
5.2 Independent variables:
Equity economic value added (EEVA) = (Return on equity – Cost of equity) x (equity invested) True value added (TVA) = Free cash flow – Capital gains – (market value x (1 + WACC)) Weighted Average Cost of Capital (WACC) = d + e
D: Total debt E: Total equity kd: Cost of debt
ke: Cost of equity
For calculation of cost of equity, it is made use of the Gordon Model (Dividend Discount Model) as follows: ke = + g
In which, ke denotes equity shareholder expected rate of return, D1 dividends during the first growth period, Po share current price, and g dividend growth rate.
5.3.Control variables:
Sizeit: Natural logarithm of total equity market value for firm i in year t
Growth: growth opportunities as measured by Tobin’s Q (i.e. market value of firm divided by replacement value of the equity book value)
6. Data analysis
6.1. Test of correlation between variables
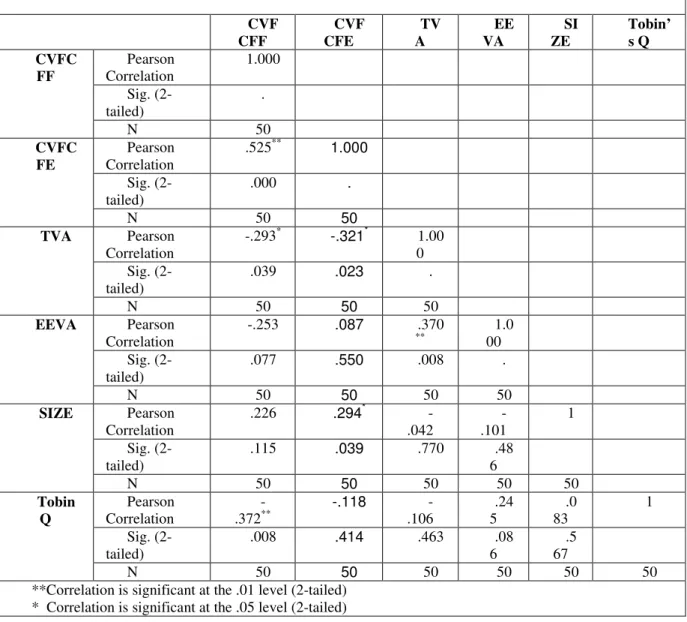
Table 1 presents the matrix of correlation between independent and dependent variables according to Spearman Correlation test at significance levels of .01 and .05.
Table 1: The results of Correlations Matrix for Dependent and Independent Variables CVF CFF CVF CFE TV A EE VA SI ZE Tobin’ s Q CVFC FF Pearson Correlation 1.000 Sig. (2-tailed) . N 50 CVFC FE Pearson Correlation .525** 1.000 Sig. (2-tailed) .000 . N 50 50 TVA Pearson Correlation -.293* -.321* 1.00 0 Sig. (2-tailed) .039 .023 . N 50 50 50 EEVA Pearson Correlation -.253 .087 .370 ** 1.0 00 Sig. (2-tailed) .077 .550 .008 . N 50 50 50 50 SIZE Pearson Correlation .226 .294* -.042 -.101 1 Sig. (2-tailed) .115 .039 .770 .48 6 N 50 50 50 50 50 Tobin Q Pearson Correlation -.372** -.118 -.106 .24 5 .0 83 1 Sig. (2-tailed) .008 .414 .463 .08 6 .5 67 N 50 50 50 50 50 50
**Correlation is significant at the .01 level (2-tailed) * Correlation is significant at the .05 level (2-tailed)
The results of correlation test presented in table 1 indicate an indirect and significant correlation between TVA and the free cash flow based indicators CVFCFF and CVFCFE, but no significant correlation between EEVA and CVFCFF and CVFCFE.
6.2. Model verification
Using F-test reliability of the first hypothesis which assumes a significant relationship between TVA and EEVA (independent variables) and CVFCFF (dependent variable) is verified. The F-value (Sig.) of the regression model presented in table 2 is smaller than 0.05, which confirms the assumption of a linear relationship between the variables, implying the model reliability. Also the provided results in table 3 regarding coefficient of determination (R2) suggest a significant relationship between TVA and EEVA (independent variables) and CVFCFF (dependent variable), since 74.3 percent of changes in the dependent variable (CVFCFF) are explainable by the independent variables (TVA and EEVA).
Table 2: The results of Model 1 Summary Model R R Square Adjusted
R Square Std. Error of the Estimate Change Statistics R Square Change F Change df1 df2 Sig. F Change 1 .862a .743 .721 1927015.42009 .743 32.586 4 45 .000
a. Predictors: (Constant), EEVA, TVA, SIZE , Tobin Q b. Dependent Variable: CVFCFF
Table 3: The results of Coefficients for Model 1 Model Unstandardized Coefficients
Standardized Coefficients t Sig. B Std. Error Beta 1 (Constant) -17697601.873 4662179.961 -3.796 .000 TVA -.476 .057 -.926 -8.372 .000 EEVA 4.295 .755 .593 5.692 .000 SIZE 662803.927 168280.273 .341 3.939 .000 Tobin Q -525758.486 770307.806 -.052 -.683 .498 a. Dependent Variable: CVFCFF
Based on the results of the above table (table 3) and the data of the statistical test, the relationship of TVA and EEVA with CVFCFF can be expressed as follows:
CVFCFF= -17697601.873 - .476 TVA + 4.295 EEVA + 662803.927SIZE
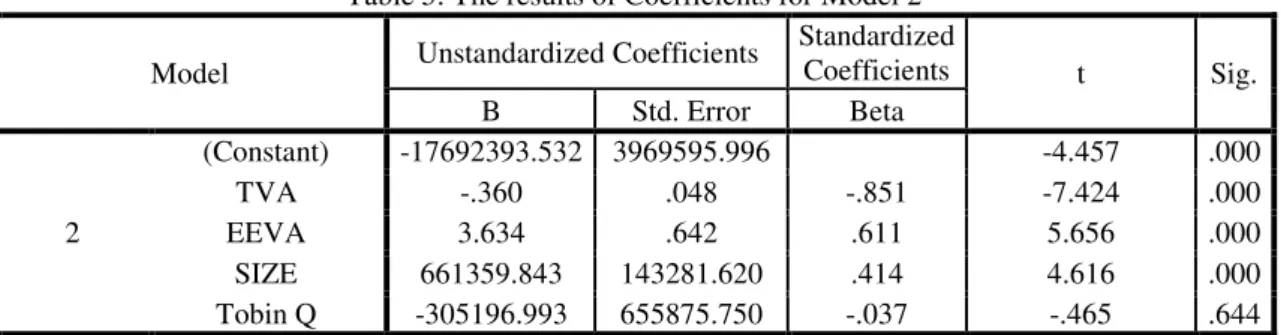
Further, for test of the second hypothesis assuming a significant association between TVA and EEVA (independent variables) and CVFCFE (dependent variable), the same procedure as in the case of the first hypothesis is followed. The F-value (Sig.) in table 4 is smaller than .05 which confirms the statement made by the second hypothesis, and the model is reliable. And given the coefficient of determination (R2 = .752) in table 5, it can be established that TVA and EEVA are significantly correlated with CVFCFE, so as 72.5 percent of changes in the dependent variable (CVFCFE) is defined by the independent variable (TVA and EEVA).
Table 4: The results of Model 2 Summary
Model R R Square Adjusted R Square Std. Error of the Estimate Change Statistics R Square Change F Change df1 df2 Sig. F Change 2 .851a .725 .700 1640750.19829 .725 29.605 4 45 .000
a. Predictors: (Constant), EEVA, TVA, SIZE , Tobin Q b. Dependent Variable: CVFCFE
Table 5: The results of Coefficients for Model 2 Model Unstandardized Coefficients
Standardized Coefficients t Sig. B Std. Error Beta 2 (Constant) -17692393.532 3969595.996 -4.457 .000 TVA -.360 .048 -.851 -7.424 .000 EEVA 3.634 .642 .611 5.656 .000 SIZE 661359.843 143281.620 .414 4.616 .000 Tobin Q -305196.993 655875.750 -.037 -.465 .644 a. Dependent Variable: CVFCFE
Based on the results of the above table and the data of the statistical test, the relationship of TVA and EEVA with CVFCFE can be formulated as the following equation:
CVFCFE= -17692393.532 - .360 TVA + 3.634 EEVA + 661359.843 SIZE Conclusion
The results of the present research suggest that the indicators TVA and EEVA like EVA basically serve the same purpose and can be used by decision makers as the predictors of the new free cash flow based value indicators. This is important in that companies are on their way toward creation of a new economic framework which would reflect the created value and profitability better than the preceding indicators. Hence, finding an indicator which would enable us to assess performance of businesses with a fairly reasonable certainty is an imperative to the degree that failure of the efforts by those managers who are enthusiastic about improvement of their organization performance is partly attributed to the lack of appropriate business performance measures in these organizations. The results also indicate that despite the general unawareness in the capital market about the proposed free cash flow valuation models, the participant in the financial markets may profit from information content of TVA and EEVA, since in the new free cash flow measures, shareholder created value is evaluated from the perspective of free cash flow. Therefore, these models can be employed as reliable indicators of CSV, especially because the operating companies in the Iranian capital market for creation of shareholder value added require an amount of free cash flow yield in excess of the return required by their investors.
Future research is required to focus on the way the free cash flow based models provided in this paper will deal with and resolve the issue of possible distortion and manipulation of performance (profitability) indicators. Moreover, future studies are expected to examine the accounting performance measures ROA, ROE and ROS in combination with performance ratios P/E, P/CF, P/S, and E/P for the purposes of operational, financial, and investment decision makings.
Reference
Baskin: An Empirical Investigation of the Pecking Order Hypothesis, Financial Management (1989), p.26. Damodaran, A, (2002) Investment Valuation: Tools and Techniques for Determining The Value of Any Assets, New York, John Wiley & Sons Inc.
Fingan, M. (1991). Extension of the EVA and MVA applications. Financial Analysts Journal, 1(1), 554-556. Goetzmann, W. N. and S. J. Garstka. (1999). the Development of Corporate Performance Measure: Benchmarks Before EVATM, Yale ICF Working Paper, 99-06, July 12, New Haven: Yale School of Management.
Günther, T., B. Landrock and T. Muche (2000), ‘Genwing versus Unternehmenswertorientierte performance - Eine Empirische Untersuchung auf Basis der Korrelation von Kapitalmarktrenditen für die Deutsche DAX100 -Unternehmen’ [Profit versus Value Based Performance Measures. An Empirical Investigation Based on the Correlation with Capital Market for German DAX-100 Companies], Controlling, 1(2), pp. 69-75 and 2(3), pp. 129-134.
Sharma and Kumar, “Economic Value Added (EVA)—Literature Review and Relevant Issues,” Inter- national Journal of Economics and Finance, Vol. 2, No. 2, 2010, pp. 200-220.
Kaviani, M. (2012). Study of and explain the relationship between the Financial Leverage and new Performance Metrics (EVA, MVA, REVA, SVA, CVA): Evidence from Automotive Industry Tehran Stock Exchange. Thesis of financial management, Islamic Azad University, Science and Research Branch, Tehran, Iran.
Kaviani, M. (2013). Study of Information content Economic Value Added in Explain new models based on Free Cash Flow (CVFCFF and CVFCFE). International Journal of Accounting and Financial Reporting, Vol 3, No 1 ,pp. 277-292. http://dx.doi.org/10.5296/ijafr.v3i1.3767.
Milunovich, S. and A. Tsuei (1996), ‘EVA in the Computer Industry’, Journal of Applied Corporate Finance, 9(2), pp. 104-115.
Mohanty, P. (2003) “In Defense EVA” Social Science Research Network Working Paper Series.
O'Byrne, S. F. (1996). EVA and market value. Journal of Applied Corporate Finance, 9, 116 25. http://dx.doi.org/10.1111/j.1745-6622.1996.tb00109.x
Shrieves, E. R., & Wachowicz, M. J. (2001). Free Cash Flow (FCF), Economic Value Added (EVA ™), And Net Present Value (NPV): A Reconciliation Of Variations Of Discounted-Cash-Flow (DCF) Valuation. The engineering economist, 46(1). http://dx.doi.org/10.1080/00137910108967561.
Turvey, C. G., L. Lake, E. Van Duren and D. Sparing. (2000). ‘The Relationship between Economic Value Added and the Stock Market Performance of Agribusiness Firms’, Agribusiness, 16(4), pp. 399-416.
Worthington, A., & West, T. (2004). Australian Evidence Concerning the Information Content of Economic Value Added. Australian Journal of Management, 29(2), 201-242. http://dx.doi.org/10.1177/031289620402900204 .
Worthington, A.C. & West, T. 2001, 'Economic value-added: A review of the theoretical and empirical literature', Asian Review of Accounting, vol. 9, no. 1, pp. 67-86.http://dx.doi.org/10.1108/eb060736.