Effective Environmental Protection in the Context of Government Decentralization
35
0
0
Full text
(2) SUSTAINABLE DEVELOPMENT Series Editor: Carlo Carraro Effective Environmental Protection in the Context of Government Decentralization By ZhongXiang Zhang, Senior Fellow Research Program East-West Center, USA Summary China has shifted control over resources and decision making to local governments and enterprises as the result of the economic reforms over the past three decades. This devolution of decision-making to local levels and enterprises has placed environmental stewardship in the hands of local officials and polluting enterprises who are more concerned with economic growth and profits than the environment. Therefore, effective environmental protection needs their full cooperation. Against this background, this paper discusses a variety of tactics that China’s central government has been using to incentivize local governments, and a number of market-based instruments, supporting economic policies, environmental performance ratings and disclosure and cooperation with financial institutions to promote long-lasting, improved corporate energy-saving and environmental performance. It concludes that there is a clear need to carefully examine those objective and subjective factors that lead to the lack of local official’s cooperation on the environment, and provides some suggestions for appropriated incentives to get their cooperation.. Keywords: Effective Environmental Protection, Incentive Structure, Economic Instruments, Industrial Policy, Financial Institutions, Government Decentralization, China JEL Classification: Q53, Q56, Q58, Q43, Q48, H23, H75, R51 Revised based on an invited presentation at the 17th Annual Lincoln Conference on “Urban Development and the Environment in China”, Cambridge, MA, May 17, 2010.. Address for correspondence: ZhongXiang Zhang Senior Fellow Research Program East-West Center 1601 East-West Road Honolulu, HI 96848-1601 United States Phone: +1 8089447265 Fax: +1 808944 7298 E-mail: ZhangZ@EastWestCenter.org. The opinions expressed in this paper do not necessarily reflect the position of Fondazione Eni Enrico Mattei Corso Magenta, 63, 20123 Milano (I), web site: www.feem.it, e-mail: working.papers@feem.it.
(3) The previous version: April 30, 2010 This version: October 2010. Effective Environmental Protection in the Context of Government Decentralization1 ZhongXiang Zhang, Ph.D in Economics 张中祥 美国东西方中心研究部资深研究员、经济学博士 Senior Fellow Research Program East-West Center 1601 East-West Road Honolulu, HI 96848-1601 United States Tel: +1-808-944 7265 Fax: +1-808-944 7298 Email: ZhangZ@EastWestCenter.org. Abstract China has shifted control over resources and decision making to local governments and enterprises as the result of the economic reforms over the past three decades. This devolution of decision-making to local levels and enterprises has placed environmental stewardship in the hands of local officials and polluting enterprises who are more concerned with economic growth and profits than the environment. Therefore, effective environmental protection needs their full cooperation. Against this background, this paper discusses a variety of tactics that China’s central government has been using to incentivize local governments, and a number of market-based instruments, supporting economic policies, environmental performance ratings and disclosure and cooperation with financial institutions to promote long-lasting, improved corporate energy-saving and environmental performance. It concludes that there is a clear need to carefully examine those objective and subjective factors that lead to the lack of local official’s cooperation on the environment, and provides some suggestions for appropriated incentives to get their cooperation.. JEL classification: Q53; Q56; Q58; Q43; Q48; H23; H75; R51 Keywords: Effective environmental protection; Incentive structure; Economic instruments; Industrial policy; Financial institutions; Government decentralization; China 1. Revised based on an invited presentation at the 17th Annual Lincoln Conference on “Urban Development and the Environment in China”, Cambridge, MA, May 17, 2010..
(4) 1. Introduction Confronted with the rising costs and health risks of environmental degradation associated with rapid economic growth, the central governments in Asian countries have gradually recognized that the conventional path of encouraging economic growth at the expense of the environment cannot be sustained. It has to be changed. They are convinced of the need to clean up their countries’ development act. Accordingly, they set environmental goals and environmental performance requirements. Environmental ministries or equivalent agencies are empowered to take the responsibility. But they are often illequipped with their tasks of enforcing existing regulations and designing, implementing, monitoring, inspecting and enforcing new effective environmental polices. The National Environmental Protection Agency of China was for years seen as a powerless entity. While the Chinese President Hu Jintao and Prime Minister Wen Jiabao gave a new lease on life and elevated it from a low vice-ministry rank, then to full ministerial status (named as the State Environmental Protection Agency (SEPA)) and currently to the Ministry of Environmental Protection (MEP) under the State Council (China’s Cabinet), the MEP still does not have the authority to suspend proposed projects violating environmental laws and regulations or to remove officials who should be held accountable for this noncompliance. It also lacks the authority to manage local environmental bureaus (Zhang, 2007a).. Table 1 Maximum Fines by Category of Violators of Environmental Laws and Regulations in China Applicable Laws Atmosphere Pollution Prevention and Control Act Air pollution accidents Atmosphere Pollution Prevention and Control Act EIA violators, imposed only Environmental Impact after the grace period Assessment (EIA) Law Extraordinarily Water Pollution Prevention and environmental accidents Control Act. Maximum Fines Allowed (10000 Yuan). Exceed the pollution limit. 10 50 20 100. Source: Zhang (2008).. Should the MEP decide to impose a penalty on violators of EIA (environmental impact assessment) laws and regulations, as indicated in Table 1, the maximum fine at its disposal is just Yuan 200,000 (about US$29,500). Even for environmental accidents as serious as the benzene contamination of the Songhuajiang River spill in November 2005 in Northern China, the incident that had unprecedented international implications as well as domestic social, economic and environmental ramifications, the maximum fine by China’s current environmental laws is just Yuan 1 million (about US$150,000), which. 2.
(5) was actually imposed one year after that incident. Moreover, the fine is only allowed to be imposed once (Zhang, 2007a). As a result, this low and one-time penalty is hardly a deterrent to environmental offenders. To make things worse, even these weak punishments allowed by current environmental laws are still weakly enforced in China because environmental protection agencies at all levels of the governments are underfunded and inadequately staffed. As a result, poor compliance and weak enforcement are common in developing Asian countries. Correcting such a problem requires a major investment in strengthening the institutions of environmental governance to ensure that they have the adequate institutional, financial and technical capabilities to do the job. This is a necessary step, but not enough. The full participation of all stakeholders is needed in protecting the environment. Over the past three decades, many Asian countries have decentralized in the allocation and responsibility and have shifted control over resources and decision-making to local governments and enterprises. This devolution of decision-making to local levels and enterprises has placed environmental stewardship in the hands of local officials and polluting enterprises. However, under the current evaluation criterion for officials in China, local officials typically have been promoted based on how fast they expand their local economies. This distorted incentive system tempts officials to disregard environmental costs of growth. Moreover, objectively speaking, the current fiscal system in China plays a part in driving local governments to seek higher GDP growth because that system makes it hard to reconcile the interests of the central and local governments (Zhang, 2008 and 2010a). Since the tax-sharing system was adopted in China in 1994, taxes are grouped into taxes collected by the central government, taxes collected by local governments, and taxes shared between the central and local governments. All those taxes that have steady sources and broad bases and are easily collected, such as the consumption tax, tariffs, vehicle purchase tax, are assigned to the central government. VAT and income tax are split between the central and local governments, with 75% of VAT and 60% of income tax going to the central government. As a result, the central government revenue increased by 200% in 1994 relative to its 1993 level. This led the share of the central government in the total government revenue to go up to 55.7% in 1994 from 22.0% in the previous year (see Table 2). In the meantime, the share of the central government in the total government expenditure just rose by 2%. By 2009, local governments only accounted for 47.6% of the total government revenue, but their expenditure accounted for 80.0% of the total government expenditure in China. To enable to pay their expenditure for culture and education, supporting agricultural production, social security subsidiary, etc, local governments have little choice but to focus on local development and GDP. That in turn enabled them to enlarge their tax revenue by collecting urban maintenance and development tax, contract tax, arable land occupation tax, urban land use tax, etc. Therefore, effective environmental protection must be placed in this context of government decentralization. In this regard, local government’s cooperation is crucial to the overall outcomes. As often is the case, what the center wants is not necessarily what. 3.
(6) the center gets. An old Chinese saying goes, “The mountains are high, and the emperor is far away”. Central governments need to let go of the notion that they should or even can do it all. Instead, they need to recognize that without local governments’ cooperation to get these policies implemented, it is meaningless to set and defend national environmental goals, no matter how stringent they are.. Table 2 Shares of the Central and Local Governments in the Government Revenue and Expenditure in China, 1993-2009. 1993 1994 1995 1996 1997 1998 1999 2000 2001 2002 2003 2004 2005 2006 2007 2008 2009. Government Revenue Central Local Government Governments (%) (%) 22.0 78.0 55.7 44.3 52.2 47.8 49.4 50.6 48.9 51.1 49.5 50.5 51.1 48.9 52.2 47.8 52.4 47.6 55.0 45.0 54.6 45.4 54.9 45.1 52.3 47.7 52.8 47.2 54.1 45.9 53.3 46.7 52.4 47.6. Government Expenditure Central Local Government Governments (%) (%) 28.3 71.7 30.3 69.7 29.2 70.8 27.1 72.9 27.4 72.6 28.9 71.1 31.5 68.5 34.7 65.3 30.5 69.5 30.7 69.3 30.1 69.9 27.7 72.3 25.9 74.1 24.7 75.3 23.0 77.0 21.3 78.7 20.0 80.0. Source: National Bureau of Statistics of China (2010).. Taking China as a focus and in the context of government decentralization, this paper first discusses a variety of tactics that the Chinese central government has been using to incentivize local governments. The paper then examines a number of economic policies aimed to engage the private sector and promote its long-lasting, improved corporate energy-saving and environmental performance. Finally, it concludes that there is a clear need to carefully examine those objective and subjective factors that lead to the lack of local official’s cooperation on the environment, and provides some suggestions for appropriated incentives to get their cooperation.. 2. Incentives for local governments to be more environmentally responsible. 4.
(7) While China has been calling for energy saving since the early 1980s, the country has set, for the first time, the goal of cutting energy intensity by 20% in its current five-year (2006-10) economic plan. Industry accounts for about 70% of China’s total energy consumption (Zhang, 2003), so that this sector is crucial for China to meet its own set energy-saving goal. To that end, China established the “Top 1000 Enterprises Energy Conservation Action Program” in April 2006. This program covers 1008 enterprises in nine key energy supply and consuming industrial subsectors. These enterprises each consumed at least 0.18 million tons of coal equivalent (tce) in 2004, and all together consumed 33% of the national total and 47% of industrial energy consumption in 2004. The National Development and Reform Commission (NDRC), China’s top economic planning agency, sets energy-saving target for each of these enterprises, and all together these enterprises are required to achieve the overall energy saving of 100 million tce cumulatively during the period 2006-10, thus making a significant contribution to China’s overall goal of 20% energy intensity-improvement (NDRC, 2006a). In May 2006, empowered by the State Council (China’s Cabinet), the NDRC signed energy-saving responsibility agreements with governments of 31 provinces or equivalent to allocate the overall energy-saving target of those Top 1000 enterprises in each province or equivalent. These governments in turn signed with those Top 1000 enterprises located in their region. To ensure that the goal is met, achieving energy efficiency improvements has become a criteria for job performance evaluations of the heads of these enterprises. This will help them realize that they should take their jobs seriously because they have a very real stake in meeting energy-saving goals. While there are areas that need further improvements (Price et al., 2010), this program goes very much as planned as far as energy saving goal is concerned. The first-year’s results of its implementation show that more than 95% of these enterprises appointed energy managers, and the program achieved the energy savings of 20 million tce in 2006 (NDRC and NBS, 2007). In 2007, the energy savings of 38.17 million tce were achieved, almost doubling the amount of energy savings in 2006 (NDRC, 2008). The results in the first two years suggest that the Top 1000 Enterprises Energy Conservation Action Program is already more than half way to meet the goal set for 2010. While China has not publicly released the results of the program’s performance afterwards, the Chinese Minister of Industry and Information was quoted as saying that “those key enterprises that each consumes at least 0.18 million tce achieved the overall energy saving of 130 million tce cumulatively during the first four years of the 11th five-year plan period” (Liu, 2010), which has been 30% more than the cumulative goal for the program over the fiveyear period. This achievement has not been possible without cooperation of local governments because they have taken the responsibility for overseeing a successful implementation of those Top 1000 enterprises in their region. However, this high-profile Top 1000 program should not be generalized when it comes to central-local relations. The common case is that local governments’ inability, or noncooperation, has been a major reason for the failure to meet energy efficiency and environmental goals set by the national government. The Chinese national government has implemented policies to shut down plants that are inefficient and highly polluting, and to keep the frenzied expansion of offending industries under control (Zhang, 2010a,c).. 5.
(8) Local officials strongly resist, because these companies provide jobs and create tax revenues as well as personal payoffs. Forcing companies out of business could even trigger local unrest. One case in point is the differentiated tariffs. The NDRC ordered provincial governments to raise power tariffs for eight energy-guzzling industries including cement, aluminum, iron and steel, and ferroalloy from October 1, 2006 onwards. Companies classified as “eliminated types” or “restrained types” in these industries are required to pay surcharges that will increase over time, with “encouraged” and “permitted” ones charged for the normal tariffs (see Table 3). However it was reported that by mid-April 2007, not only had many local governments failed to implement the differentiated tariffs that charge more for companies in the “eliminated” or “restrained” categories, but 14 of them even continued to offer preferential power tariffs for such industries (Zhang, 2007a). In fact, this is not the only time that China’s provinces and regions violated this nationwide policy. Some provinces and regions have been offering preferential power tariffs to struggling, local energy-intensive industries (Stanway, 2009).. Table 3 Differentiated Tariffs for Eight Energy-guzzling Industries in China Existing Additional Charge (Yuan/kWh) Eight energyguzzling industries. Eliminated types Restrained types. 0.05. Additional Charge since October 1, 2006 (Yuan/kWh) 0.10. Additional Charge since January 1, 2007 (Yuan/kWh) 0.15. Additional Charge since January 1, 2008 (Yuan/kWh) 0.20. 0.02. 0.03. 0.04. 0.05. Source: NDRC (2006b).. The results have also been mixed in the closure of small, inefficient coal- and oil-fired power plants and energy-inefficient and highly-polluting plants. As the largest coal consumer, power generation is currently consuming over half of the total coal used in China. This share is expected to rise well above 60% in 2020, given the rapid development of coal-fired power generation (Zhang, 2010c). Thus, efficient coal combustion and power generation is of paramount importance to China’s endeavor of energy-saving and pollution-cutting. To that end, China has adopted the policy of accelerating the closure of thousands of small, inefficient coal- and oil-fired power plants. Units facing closure include those below 50 MW, those below 100 MW and having in operation of over 20 years, and those below 200 MW and having reached the end of their design life, those with a coal consumption of 10% higher than the provincial average or 15% higher than the national average, and those that fail to meet environmental standards (Zhang, 2010c). The total combined capacity that needs to be decommissioned is set at 50 GW during the period 2006-10. Relative to a total capacity of 8.3 GW decommissioned. 6.
(9) during the period 2001-05, by the end of the first half year of 2009, China had closed small plants with a total capacity of 54 GW, having met the 2010 target of decommissioned 50 GW one and half years ahead of schedule (Sina Net, 2009b; Zhang, 2010c). By mid-July 2010, the total capacity of decommissioned smaller and older unites had increased to 70 GW, more than the entire current power capacity of the Great Britain (Yang, 2010). However, China has been less successful in the areas to shut down energyinefficient and highly-polluting plants than in the closure of small, inefficient coal- and oil-fired power plants. Following a major pollution incident in July 1994 in the Hui River, the central government launched a national campaign to close down some 72000 highlypolluting town and village industrial enterprises in 15 sub-sectors. However, some 2030% restarted, either illegally or after bringing their enterprises into compliance with relevant discharge standards (Ma and Ortolano, 2000 and OECD, 2001). Another case is the closure of small, inefficient and highly-polluting coal mines for environmental reasons and then the reopening of many of these plants for economic reasons. These coal mines were ordered to shut down through a widely-publicized nationwide campaign beginning in 1998. However, many had reopened because in many cases local governments had pushed back to preserve local jobs and generate tax revenues as well as personal payoffs. As a result, the coal consumption figures had been revised upwards to reflect the unreported coal production mainly from these reopened small, inefficient and highly-polluting coal mines. Table 4 shows the preliminary and final values for total primary energy consumption and coal consumption in China between 1990 and 2008. The preliminary figures for total energy use in 1999-2001 were revised upwards by 810%. In all three years, these adjustments were driven by upward revisions of 8-13% made to the coal consumption figures. Thus, to gain local officials’ cooperation on the environmental issues, incentives need to be provided. Under the current evaluation criterion for officials in China, local officials typically have been promoted based on how fast they expand their local economies. That has created an incentive for officials to tempt to disregard the environmental costs of economic growth. To correct this distorted view of local officials’ accomplishments and to implant environmental consequences in their minds, environmental performance has to be considered as well. If environmental quality does not get improved during the official’s tenure, that official should not be promoted. This will help the local officials realize that they should take their jobs seriously because they have a very real stake in meeting environmental goals. To that end, the central government of China has been using a variety of tactics to incentivize local governments (Zhang, 2007b and 2008). China State Council issued in 1982 provincial measures for collecting pollution discharge fees. The measures allow local environmental protection bureaus (EPB) to retain 20% of the fees charged for pollutants exceeding allowable standards. The fees retained, referred to as selfconstruction fees, can be used for environmental monitoring, research, training and awards. This may motivate local EPBs to increase monitoring and ensure compliance. However, local governments consider economic development a priority, and view the strict implementation of the over-standard fees as a severe burden on local firms, thus hampering local development. This intervention restricts effectiveness of the incentive.. 7.
(10) Moreover, the incentive itself is an issue open to question. Given their budget shortfalls as a result of the central government’s call for self-supporting government agencies and local government cuts in their funding, some local EPBs, if not all, have misused this incentive as a mechanism to maximize their fee-based revenues and expand their budgets. They monitor to collect fees rather than ensure compliance, and reduce monitoring frequency and stop monitoring for months once a firm is determined to violate effluent standards (Ma and Ortolano, 2000).. Table 4 Preliminary and Final Values for Total Primary Energy Consumption and Coal Consumption in China, 1990-2008a Year. 1990 1991 1992 1993 1994 1995 1996 1997 1998 1999 2000 2001 2002 2003 2004 2005 2006 2007 2008. Total primary energy consumption Preliminary Final Adjustment value value (%) (Mtce) (Mtce) 987.03 980.00 0.7 1037.83 1023.00 1.4 1091.70 1089.00 0.2 1159.93 1117.68 3.8 1227.37 1227.37 0.0 1311.76 1290.00 1.7 1389.48 1388.11 0.1 1377.98 1420.00 -3.0 1322.14 1360.00 -2.8 1338.31 1220.00 9.7 1385.53 1280.00 8.2 1431.99 1320.00 8.5 1517.97 1480.00 2.6 1749.90 1678.00 4.3 2032.27 1970.00 3.2 2246.82 2233.19 0.6 2462.70 2462.70 0.0 2655.83 2655.83 0.0 2850.00b. Total coal consumption Preliminary Final Adjustment value value (%) (Mtce) (Mtce) 752.12 1.5 740.88 789.79 1.6 777.48 826.42 1.3 815.66 866.47 6.5 813.67 920.53 0.0 920.53 978.57 1.1 967.50 1037.94 -0.3 1041.08 988.01 -5.3 1043.70 920.21 -5.5 973.76 924.77 13.0 818.62 939.39 9.5 857.60 955.14 8.0 884.40 1006.41 2.9 978.28 1196.93 6.3 1125.94 1381.94 3.6 1333.69 1552.55 0.9 1538.67 1709.11 0.0 1709.11 1845.80 0.0 1845.80 1957.95b. Notes: Mtce (million tons of coal equivalent). a National Bureau of Statistics of China is expected to adjust both preliminary and final values for energy and coal uses to make all statistics consistent, based on the second nationwide economic census. But such an adjustment in a comparable way will have little effect on a difference between their preliminary and final values. b Data on energy and coal consumption in 2008 are preliminary value. Sources: Zhang (2010d,e).. 8.
(11) Since 1997, the SEPA (the current MEP) has run a model environmental city program. Any city, which both meets about 30 specified environmental indicators over the past three consecutive years and is among the three best performers of environmental quality in a province, is awarded the title. Out of 629 cities in China, 67 had been placed on the honor roll by the end of 2008 (MEP, 2009). To further push local governments on the environmental front, for the first time, on July 13, 2004, the SEPA unveiled its blacklist of the ten most polluted cities to discourage environmentally irresponsible decisions. That shocked local officials who had always worked on the assumption that “evil deeds” very seldom saw the light of day (Zhang, 2007a,b). This public disclosure works effectively because it puts more pressure on local officials to take responsibility for the health of their people and to take action. Since 2006, the blacklist was expanded to include cities with air quality below the class III standard designed for industrial areas. According to the evaluation on the environmental quality of Chinese 595 cities in 2006, despite four cities less than the number of those blacklisted in the previous year, there were still 39 cities on the SEPA’s blacklist (SEPA, 2007a). In the latest evaluation on 629 cities’ environmental quality in 2008, released on December 21, 2009, the number of the blacklisted cities went down to 7.2 Moreover, the category of blacklisted cities was further expanded to include unveiling those cities that were unable to undertake online automatic monitoring, were found to have not taken the required urban sewage treatment and to have discharged substandard waste water, and do not take proper treatment of urban garbage, etc (MEP, 2009). Aimed to help the general public and officials alike to understand how severely the rising environmental degradation associated with its rapid economic growth is, the SEPA and the National Bureau of Statistics of China (2006) in September 2006 jointly released the first-ever report on economic costs of pollution in 2004. Despite the shortcomings in basic data, methodologies and the coverage of items, this report estimates that the environmental pollution still costs China US$ 64 billion, or 3.05% of GDP in 2004. This sends a warning signal that China’s rampant environmental pollution problem is undermining its long-term economic growth. The SEPA is promoting to use the. 2. China’s national air quality standards for residential areas is termed the Chinese class II standards. The national standards for residential areas are set at the annual average TSP (total suspended particulate) and PM10 (particulate matter less than 10 microns in diameter) concentrations of 200 and 100 micrograms per cubic meter (µg/m3), respectively. In its latest evaluation of Chinese cities’ environmental quality in 2008, 76.8% of the Chinese cities were able to meet or go beyond that class II standards (MEP, 2009). That figure was only 37.6% in 2006 (SEPA, 2007a). This suggests that while there is a significant progress in urban air quality, about 23% of the Chinese cities still suffer from air pollution resulting in being unable to meet the class II standards that are much lower than the WHO guidelines of 90 µg/m3 for TSP until it was abandoned for this particulate form in 2000 (The WHO (2000) abandoned the standards for this particulate form because time-series epidemiological studies were unable to define a threshold below which no health effects occur) and 20 µg/m3 for PM10. 9.
(12) calculated green GDP instead of traditional GDP as the economic criterion to evaluate the real performance of local officials. The SEPA decided in July 2006 to establish the six regional environmental protection inspection centers. Unlike local environmental protection agencies budgeted by local governments, these regional centers are directly under the leadership of the national environmental regulatory agency. Moreover, they are independent of local governments in terms of their budgets and staffs. Thus, they can confront local government’s shortterm intents to better represent national, long-term and general interests, have the enhanced capability to inspect and coordinate serious environmental disputes cross provincial borders and river basins, correct the distorted information on local environmental quality, and rein in the increasing local protectionists (Sina Net, 2007b). This is another way to coerce cooperation between the central government and local governments as well as cooperation among local governments. To further enhance the environmental awareness of local officials, the SEPA has tightened approval of construction projects by implementing the regional permit restrictions. The so-called regional permit restrictions are based on an ancient Chinese punishment of incriminating relatives and associates related to the main suspect. On January 10, 2007, the SEPA made an unprecedented move, suspending EIA approval of any new construction projects in four cities (Tangshan in Hebei province, Luliang in Shanxi province, Liupanshui in Guizhou province, and Laiwu in Shandong province) and four major national power-generating groups (Datang International, Huaneng Group, China Huadian Corp, and China Guodian Corp) until they bring their existing facilities into compliance with environmental regulations. Once their EIA approval rights are suspended, no new construction projects are allowed to be built in these cities and by these power-generating groups until all violators are in compliance with environmental regulations. Given that China’s economy is investment-driven, local governments are fully aware of the consequences of the suspension of their right to approve new construction projects. To disregard the environmental problems in their regions now can cost them a lot (Zhang, 2007a). In fact, this is not for the first time for the SEPA to impose administrative measures to punish offenders. Since January 2005, the SEPA has unleashed a series of the so-called environmental protection storms. Its first ever such a storm unleashed on January 18, 2005, blacklisted 30 industrial projects worth Yuan 119.7 billion. Many of these projects were considered the so-called “national key projects” approved by the powerful NDRC, China’s top economic planning agency. While these projects themselves were not necessarily highly polluting, the SEPA called for a halt to these industrial projects, on the ground that they had not undergone proper environmental impact assessments. This first environmental protection storm served as a public education campaign, increasing the awareness of the EIA law. In the second environmental storm in 2006, the EIA law is further strengthened, taking it from project level to the deeper level of planning. 163 proposed projects worth Yuan 774.6 billion were put on hold on enforcing EIA law alone. But, the restriction of regional permits is the strictest administrative measure ever taken by the SEPA in its 30 years of existence (Zhang, 2007a,b).. 10.
(13) The underlying reason for suspending EIA approval rights is thought to be the desire to promote technology upgrading, industrial restructuring and sustainable development. Whether it becomes an effective means depends on how local governments and companies succeed in changing their attitudes and practices and whether local environmental protection agencies work together with the national agency. Otherwise, suspending the approval rights only has temporary effects, but does not lead to a longterm efficacy. The new regional permit restrictions seem to be effective. Only one month after the restrictions suspended approval rights for the four cities, one city, Laiwu, quickly responded to the SEPA warnings and recovered its rights; and only two months after the suspension, Huaneng Group and China Guodian Corp, the two national power-generating groups, came into compliance and recovered their rights (Zhang, 2007a). While there are hardly any reports on environmental protection storms in China’s media since the fourth environmental protection storm unleashed in July 2007 and targeted at river basins, the MEP continues to suspend the right of those corporations and provinces to approve any new construction projects if there are any violators of environmental regulations within these corporations and provinces. For example, once the Ludila hydropower project by Huadian Power, and the Longkaikou project by Huaneng Power, both located in Lijiang, Yunnan province, were found to illegally block the river for the construction effort in January 2010 without reviewing their environmental impact, the MEP in June 2010 had ordered the country’s two largest power producers to stop building the dams immediately. Moreover, the MEP suspended approval of hydropower projects along the middle reaches of Jinsha River, and suspended EIA approval of any new construction projects (except for renewable and pollution-abating projects) for the two national power-generating groups. Weifang Steel Group Corp in Shandong province started constructing a project of producing 5 million tons of steel. Given that this project violates the national industrial policy and development plan of steel industry, the MEP is suspending EIA approval of any new construction projects in the whole steel sector for the whole province (Sina Net, 2009a). China started implementing the bulletin system to release data on energy use per unit of GDP and other indicators by provincial region in 2006 (People’s Daily, 2005). According to the first bulletin on energy use per unit of GDP and other indicators for 2006, which was released in July 2007, among the 31 Chinese provinces or equivalent, only Beijing met energy-saving and emissions-cutting goals in 2006, cutting its energy use per unit of GDP by 5.25%, followed by Tianjin, another metropolitan city in China, with the energy intensity reduction of 3.98%, Shanghai by 3.71%, Zhejiang by 3.52% and Jiangsu by 3.50% (NBS et al., 2007). In 2007, despite concerted efforts towards energy saving, the country cut its energy intensity by 4.04% (NBS et al., 2009). There are still big variations in energy-saving performance among the 31 Chinese provinces or equivalent. Beijing continued to take the lead, cutting its energy intensity by 6%, followed by Tianjin by 4.9% and Shanghai by 4.66% (NBS et al., 2008). This clearly indicated Beijing’s commitments to the 2008 Green Olympic Games. In the meantime, however, there were. 11.
(14) seven provinces whose energy-saving performances were below the national average. 2008 was the first year in which China exceeded the overall annualized target (4.4%) for energy saving, cutting its energy intensity by 4.59% (NBS et al., 2009). This was due partly to the economic crisis that reduced overall demand, in particular the demand for energy-intensive products. Overall, the energy intensity was cut by 14.38% in the first four years of the plan relative to its 2005 levels (Xinhua Net, 2010). In July 2010, China released its energy intensity number for 2009, and its final energy intensity numbers for the years 2005, 2006, 2007 and 2008, which are revised based on the second nationwide economic census. Based on these revised numbers, China’s energy intensity fell by 15.61% from 2006-2009 (NBS et al., 2010). The country would meet its energy-saving goal if it could cut its energy intensity by 4.39% in 2010. However, China’s energy use rose faster than its economic growth in the first half of 2010, with seven provinces becoming even more energy intensive during this period. This suggests that the country as a whole needs to accomplish the goal set for the whole year only within a half year, with some provinces required to fill even big remaining gaps during this period. Given the annual energy-saving rate of 5.25% during the period 1980-2000 in which China achieved a quadrupling of its GDP while cutting its energy intensity by about three quarters (Zhang, 2003), achieving such high energy-saving rate within a half year poses a significant challenge for the country as well as for those provinces that lagged behind schedule. In this regard, local government’s cooperation is crucial to the overall outcomes of cutting the energy intensity target by 20% between 2006 and 2010 relative to its 2005 level.3 The SEPA could use its power to suspend the right to approve new construction projects in those provinces if they continue noncompliance with the energy-saving and environmental goals (Zhang, 2007a). Moreover, shifting control over resources and decision making to local governments and enterprises as the result of the economic reforms in China over the past three decades has led to insufficient investment in energy saving, with its share in the total investment in the energy industry in China declining from about 13.4% in 1983 to the level of about 3% in 2005 (Zhang, 2010a). China needs to increase investment in energy conservation and energy efficiency improvements. Faced with the prospect for the failure to meet the ambitious energy intensity target, the central government embarked additional Yuan 10 billion in mid-2007, following Yuan 11.3 billion already allocated in early that year (the total of Yuan 21.3 billion, about US$ 3.2 billion or 4.5% of the total investment in the energy sector in 2005) specifically for energy saving, of which Yuan 9 billion to support the Ten Key Energy-saving Projects, 13 times that of the funding support in 2006 (Yuan 0.68 billion). This is a helpful step in promoting energy conservation, but the amount of fund allocated for energy saving needs to further increase. To encourage local governments to eliminate outdated production capacities, there have been repeated calls by policy experts for payment of transfer both from the central government to provincial governments in the less developed regions and from the provincial governments to those 3. The reliability of both energy use and GDP data matters in meeting this energy intensity target. See Zhang (2010d,e) for discussions on the reliability and revisions of China’s statistical data on energy and GDP, and their implications for meeting China’s existing energy-saving goal in 2010 and its proposed carbon intensity target in 2020. 12.
(15) cities and counties in which a large amount of outdated production capacities have been closed down. Moreover, the amount of that transfer needs to be indexed with the real energy saving as the result of closing down the production capacities (Zhang, 2008 and 2010a). The Chinese government has gradually recognized the importance of the payment of transfer in getting local government’s cooperation. This is reflected by the central government’s decision in November 2007 to transfer Yuan 2 billion to provincial governments. This is a very positive development, but this amount of payment transfer is far short of the needs. It needs to further increase, in particular given that the central government only accounts for less than 25% of the country’s total government expenditure but receives over 50% of the total government revenue in China (see Table 2). The good news is that the Chinese central government has recognized these needs, increasing the amount of its fund allocated for energy saving to Yuan 41.8 billion in 2008 (including funding support for urban sewage treatment that was allocated to Yuan 4 billion in 2007) from Yuan 23.5 billion in 2007 (The State Council, 2008). 2010 is the final year of China’s energy efficiency drive of the 11th five-year plan, but as discussed above, China still needs to fill in the big remaining gap to meet its energy saving goal for 2010. Recognizing how challenging it is, the Chinese central government has doubled the amount of its allocated fund for energy saving relative to its level in 2008, earmarking Yuan 83.3 billion in 2010 (Xinhua Net, 2010).. 3. Economic policies and engagement of the private sector While governments determine the rules under which businesses act, set environmental goals and commit to international environmental agreements, they count on enterprises’ full cooperation. After all, the enterprises themselves are entities that make investment, use natural resources, produce products and emit pollution. In this regard, having the right economic policies is crucial because it sends clear signals to these energy consumers, helping polluting enterprises to hold accountable for their environmental behavior as well as their profits and costs. Given the widespread use of fossil fuel subsidies in developing Asian region, removing these subsidies is essential to provide incentives for efficient fuel use and adoption of clean technologies that reduce emissions at sources. By definition, a subsidy lowers the cost of production, increases the price received by producers or lowers the price paid by consumers. By lowering the prices of fossil fuels, such fossil fuel subsidies not only are widely considered to distort international trade, but also increase the amount of such fuels consumed and thus the amount of harmful emissions (Zhang and Assunção, 2004). China, Indonesia and Malaysia are among the developing Asian countries that have since 2005 raised domestic energy prices to bring them more into line with international prices. This has led to sharp fall in overall energy subsidies in these countries despite rising international prices. For example, China cut its total energy subsidies to around US$ 11 billion in 2006. This corresponds to a reduction of 58% compared to its 2005 level of around US$ 26 billion (IEA, 2006 and 2007). China has since raised its producer prices of gasoline and diesel several times. On June 1, 2010, China increased domestic producer price of natural gas by 25% (Wan, 2010). In October 2010, the NDRC was soliciting opinions nationwide regarding the two proposed options to set up tier-tariffs for household electricity use. Despite these long-awaited actions, removing such subsidies is but a first step in getting. 13.
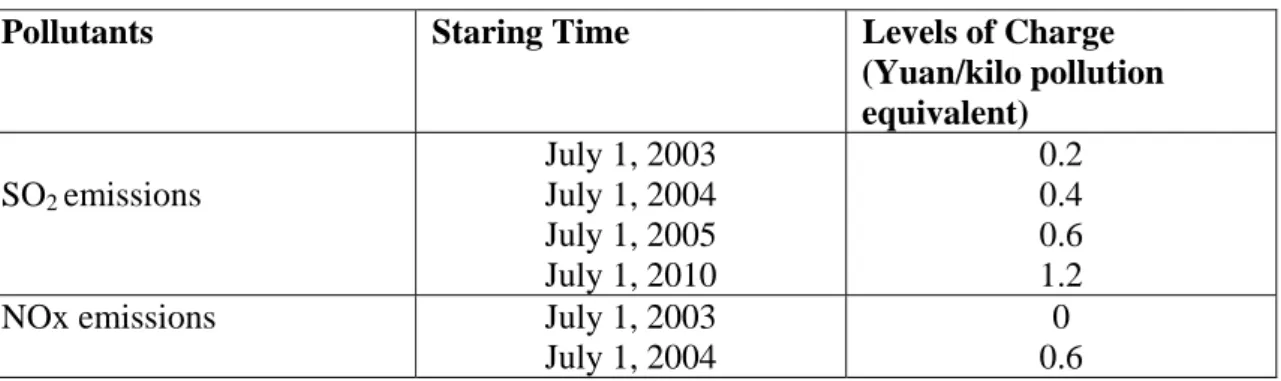
(16) the energy prices right. Further steps to be taken include incorporating the costs of resources themselves to reflect their scarcity and internalizing the costs of externalities. For example, current royalties on coal resources in China are based on extraction. That is, a coal miner pays certain amount of fees for each ton of coal extracted. As a result, once a coal miner obtains mining permits, it mines recklessly. This irresponsible mining behavior is very common for small coal mines, and has led to a severe waste of coal resources, even to the destruction of coal resources. As would be expected, the coal recovery rate is reported to be only 10-15% for small coal mines, implying that more than 6 tons of coal get wasted for each ton of coal extracted. For the country as a whole, the average recovery rate is about 30%,4 only 60% of the advanced level abroad (He, 2006). To avoid wasteful extraction and use of coal, current way in levying royalties on coal resources in China should be changed. The rational royalties on coal resources should be levied based on revenues rather than volume, indexed with both the quality of reserves and recovery rate of coal mines. 3.1 Market-based instruments Market-based instruments, such as pollution charges, green taxes, tradeable petmits, and penalties for the infringement of environmental regulations, are common ways to internalize externality costs into the market prices. Many Asian countries have traditionally relied on rigid command-and-control (CAC) approaches. With the poor environmental performance of such approaches and the cost and complexity associated with their implementation, more and more countries in this region are transforming from current reliance on CAC regulations to market-based policy instruments. The added abatement costs will be imposed on polluting companies as part of production cost that can be reduced by cutting pollution. This is seen to increase not only cost-effectiveness but also flexibility in complying with the set environmental regulations. With one-third of China’s territory widely reported to be affected by acid rain, the formation of which SO2, along with NO2, contributes to, reducing SO2 emissions has been the key environmental target in China. By amending the 1987 Atmospheric Pollution Prevention and Control Act in August 1995, which newly added SO2 emissions from coal combustion as the regulated pollutant, China has since 1996 started levying the charges for SO2 emissions in the so-called Two Control Zones5 based on the total quantity of emissions and at the rate of 0.20 Yuan per kilo of pollution equivalent (Yu, 2006). As indicated in Table 5, since July 1, 2003, this charge was applied nationwide and the level of this charge was raised step by step. From July 1, 2005 onwards, the 4. Coal recovery rates differ with scale of mines, the level of mining technologies, and type of mines. For key state-owned coal mines, the rate is 50%. The corresponding figure for surface mines reaches as high as 95%. But their output only accounts for 4.5% of the national total production (He, 2006). 5 The so-called Two Control Zones refer to acid rain control zone and SO2 control zone. The former mainly covers the southern and southwestern parts of China where precipitation is acid most of the time, whereas the latter covers the northeastern and eastern parts of the country where SO2 emissions are very intensive but the acid rain is not apparent partly because of the alkaline soils in these areas. 14.
(17) charge was applied at the level of 0.60 Yuan per kilo of pollution equivalent. The pollutants that are subject to pollution charges are broadened to include NOx as well, which is charged at the rate of 0.60 Yuan per kilo of pollution equivalent since July 1, 2004 (SDPC et al., 2003). To help to meet the energy saving and environmental control goals set for the 11th five-year economic plan, the Chinese government plans by three steps to double the charges for SO2 emissions from the existing level to 1.2 Yuan per kilo of pollutant equivalent within the next three years (The State Council, 2007). Local governments are allowed to raise pollution charges above the national levels. Since 1999, Beijing levied charges 1.2 Yuan per kilo of pollution equivalent for SO2 emissions from coals of high sulfur content (SDPC et al., 2003). Jiangsu province raised charges for SO2 emissions from the existing level of 0.6 to 1.2 Yuan per kilo of pollution equivalent from July 1, 2007 onwards, three years ahead of the national schedule (People Net, 2007; Sina Net, 2007a). China’s Ministry of Finance, the State Administration of Taxation and the MEP have proposed for levying environmental taxes to replace current charges for SO2 emissions and chemical oxygen demand, a water pollution index. This proposal is subject to the approval of the State Council. While their exact implementation date has not been set yet, it is generally expected to be introduced during the 12th five-year plan period running from 2011 to 2015. As experienced in environmental taxes in other countries (Zhang and Baranzini, 2004), such taxes will initially be levied with low rates and limited scope, but their levels will increase over time. Once implemented, the long-awaited environmental taxes will have the far-reaching effects on technology upgrading, industrial restructuring and sustainable development in China.. Table 5 Levels of Charges for Atmospheric Pollutants in China Pollutants. SO2 emissions. NOx emissions. Staring Time. July 1, 2003 July 1, 2004 July 1, 2005 July 1, 2010 July 1, 2003 July 1, 2004. Levels of Charge (Yuan/kilo pollution equivalent) 0.2 0.4 0.6 1.2 0 0.6. Sources: SDPC et al. (2003); The State Council (2007).. China has been experimenting with SO2 emissions trading in Hubei, Hunan, Jiangsu, and Zhejiang provinces and Tianjin metropolitan city. Zhejiang province has implemented provincial wide trial SO2 emissions quotas that can be purchased and traded since 2009. It as well as Jiangsu is experimenting with trading COD (chemical oxygen demand) permits in Taihu Basin. In its Jinxing city, 890 enterprises were reported to participate in the paid use and trade of pollution quotas by mid-November 2009, representing rising trends of both volumes and prices of quotas transacted (CAEP, 2009). Even in Shanxi. 15.
(18) province, China’s coal and power base, power-generating plants sold SO2 emissions quotas to the State Grid. This marks that tradeable permits scheme enters the essentially operational stage in the province after years of preparation. No doubt, economic instruments internalize the externality costs of production, and thus provide positive incentives to abate emissions. However, these economic instruments do not work to their full potential, although they have a solid economic foundation. In theory, cost-conscious companies will generally tolerate pollution up to the point where the expected penalty for pollution becomes greater than the cost of cutting emissions. However, the charges and fines are often set too low as have been the case in many developing countries. The average charge for urban sewage treatment was reported to be Yuan 0.7 per ton for 36 large and medium cities in China by the end of 2008, whereas the corresponding treatment cost is Yuan 1.1 per ton (NDRC, 2009; CAEP, 2009). Even for the aforementioned case of Jiangsu province, where the charges for SO2 emissions at 1.2 Yuan per kilo of pollution equivalent were levied from July 1, 2007 onwards, three years ahead of China’s national schedule, this charge is still less than half of the real abatement cost, which is reported to be 3 Yuan per kilo of pollution equivalent for abating SO2 emissions from coal-fired power plants (Sina Net, 2007a). As a result, many polluting companies see their compliance costs higher than the fines, and accordingly choose to pay the fines rather than to reduce their pollution. As discussed in Introduction, the low penalty is hardly a deterrent to environmental offenders in China. To change this situation, pollution charges should be raised to reflect the cost of abating pollution, and the fines for offenders should be set higher than the abatement cost. This two together will really create incentive for pollution reduction. 3.2 Supportive economic policies The central government is also providing supportive economic policies to encourage technical progress and strengthen pollution control to meet the energy-saving and environmental control goals. To support the Ten Energy-saving Projects, China’s Ministry of Finance and the NDRC (2007) award enterprises in East China Yuan 200, and enterprises in the Central and Western part of the country Yuan 250 for every tce saved per year since August 2007. Such payments are made to enterprises that have energy metering and measuring systems in place that can document proved energy savings of at least 10000 tce from energy-saving technical transformation projects. Moreover, in its current economic blueprint for 2006 to 2010, China incorporated for the first time the goal of reducing SO2 emissions by 10% by 2010. With burning coal contributing 90% of the national total SO2 emissions and coal-fired power generation accounting for half of the national total, the Chinese central government has mandated that new coal-fired units must be synchronously equipped with a flue gas desulphurization (FGD) facility and that plants built after 1997 must have begun to be retrofitted with a FGD facility before 2010. Empowered by the State Council, the MEP (then SEPA) in May 2006 signed SO2 emissions-cutting responsibility agreements with seven provincial governments and six top national power-generating groups, which together account for two-third of total SO2 emissions in China. And, policies favorable to FGD-equipped power plants are being implemented, e.g., the on-grid tariff incorporating desulphurization cost, priority given to be connected to grids, and being allowed to. 16.
(19) operate longer than those plants that do not install desulphurization capacity. Some provincial governments provide even more favorable policies, leading to priority dispatching of power from units with FGD in Shandong and Shanxi provinces. Moreover, the capital cost of FGD has fallen from 800 Yuan/kW in the 1990s to the level of about 200 Yuan/kW (Yu, 2006), thus making it less costly to install FGD facility. As a result, newly installed desulphurization capacity in 2006 was greater than the combined total over the past 10 years, accounting for 30% of the total installed thermal (mostly coalfired) capacity. This helped to slow down the growth rate of SO2 emissions significantly in 2006, which was 11.3% less than that in 2005. By 2007, the coal-fired units installed with FGD increased to 266 GW from 53 GW in 2005. Generation units with FGD further rose to 379 GW in 2008 and 470 GW in 2009. Accordingly, the portion of coal-fired units with FGD rose to 51% in 2007, 66% in 2008 and 78% in 2009 of the total installed thermal capacity from 13.5% in 2005 (Sina Net, 2009b; Zhang, 2010c; X. Zhu, 2010). As a result, by the end of 2009, China had cut its SO2 emissions by 13.14% relative to its 2005 levels (Xinhua Net, 2010), having met the 2010 target of a 10% cut one year ahead of schedule. 3.3 Industrial policies In addition to supportive economic policies and market-based environmental instruments, governments are exploring industrial policies to promote industrial upgrading and energy conservation. With surge in energy use in heavy industry, China’s Ministry of Finance and the State Administration of Taxation started levying export taxes from November 2006 on a variety of energy and resource intensive products to discourage exports of those products that rely heavily on energy and resources and to save scarce energy and resources. This includes a 5% export tax on oil, coal and coke, a 10% tax on to nonferrous metals, some minerals and 27 other iron and steel products, and a 15% tax charged on copper, nickel, aluminum and other metallurgical products. Simultaneously, imports tariffs on a range of items, including 26 energy and resource products such as oil, coal and aluminum, were cut from their current levels of 3-6% to 0-3%. From July 1, 2007, China’s Ministry of Finance and the State Administration of Taxation (2007) eliminated or cut export tax rebates for 2831 exported items. This is considered as the boldest move to rein in exports since China joined the World Trade Organization in December 2001. Among the affected items, which account for 37% of all traded products, are 553 “highly energy-consuming, highly-polluting and resource-intensive products”, such as cement, fertilizer and non-ferrous metals, whose export tax rebates were completely eliminated. This policy will help to enhance energy efficiency and rationalize energy- and resource-intensive sectors as well as to control soaring exports and deflate the ballooning trade surplus. From the point of view of leveling the carbon cost playing field, such export taxes increase the price at which energy-intensive products made in China, such as steel and aluminum, are traded in world markets. For the EU and U.S. producers, such export taxes imposed by their major trading partner on these products take out at least part, if not all, of the competitive pressure that is at the heart of the carbon leakage debates. Being converted into the implicit carbon costs, the estimated levels of CO2 price embedded in the Chinese export taxes on steel and aluminium are very much in the same range as the average price of the EU allowances over the same period. Zhang (2009 and 2010b) have argued that there is a clear need within a climate. 17.
(20) regime to define comparable efforts towards climate mitigation and adaptation to discipline the use of unilateral trade measures at the international level. As exemplified by export tariffs that China applied on its own during 2006-08, defining the comparability of climate efforts can be to China’s advantage (Zhang, 2010b). China’s Ministry of Commerce and the SEPA (2007) in October 2007 were in an unusual collaboration to jointly issue the antipollution circular. Targeted at its booming export industry, this new regulation would suspend the rights of those enterprises that do not meet their environmental obligations to engage foreign trade in the period of more than one year and less than three years. A significant portion of China’s air pollution can be traced directly to the production of goods that are exported. In the Pearl River delta, a major manufacturing region in Southern China, as indicated in Figure 1, Streets et al. (2006) found that 37% of the total SO2 emissions in the region, 28% of NOx, 24% of particulate matter (PM), and 8% of volatile organic compounds (VOCs) are caused by export-related activities. In the city of Shenzhen alone, the regional leader in industrial development and trade, 75% of VOCs, 71% of PM, 91% of NOx, and 89% of SO2 emissions from the industrial sector were released in manufacturing of exported goods. Effectively implemented, this policy will help polluting enterprises that export their products to pay attention to the environmental effects of their products and produce more environmentally friendly products.. Figure 1 Percentage of Air Pollutants Tied to Export Manufacturing in the Pearl River Delta and Shenzhen, China. 18.
(21) Source: Streets et al. (2006).. Shenzhen. Pearl River delta. Sulfur dioxide emissions 37% 89% Nitrous oxide emissions 28% 91% Particulate matter 24% 71% Volatile organic compounds 8% 75%. 3.4 Environmental performance ratings and disclosure The central government is also exploring other ways to enhance the efficacy of environmental monitoring and compliance. Naming and shaming polluters is one vehicle. In April 2010, China’s MEP for the first time unveiled offending polluters and blacklisted state-owned enterprises.6 Out of 7,043 major polluting enterprises under the national environmental monitoring system, 2,713 were found to have discharged substandard waste water or exhaust emissions in 2009, accounting for about 40% of the total monitored major polluting enterprises. The offending polluters include the state-owned China Power Investment Corp, China Huaneng Group and China Guodian Corp, the three major national power-generating groups. This fact will help change the general public’s perception that it is the small, private enterprises that are the country’s main sources of pollution. The listing of some sewage treatment plants was another remarkable sign in the report as 47% of 1,587 monitored waste water facilities were found guilty of substandard discharges (Deng, 2010).. Table 6 Environmental Performance Ratings of the Participating Firms under the Green Watch Program in Jiangsu Province, China, 2001-2006. 6. It is reported that, according to Jairam Ramesh, India Environment Minister, India plans to launch a public database of the country’s worst polluters, modeled on a list compiled by China (Hille and Lamont, 2010). 19.
(22) Green Blue Yellow Red Black Total. 2001 77 (7.27) 512 (48.35) 288 (27.20) 141 (13.31) 41 (3.87) 1059. 2002 182 (7.26) 1196 (47.69) 655 (26.12) 398 (15.87) 77 (3.07) 2508. 2003 267 (8.69) 1545 (50.26) 789 (25.67) 367 (11.94) 106 (3.44) 3074. 2004 329 (6.46) 2659 (52.20) 1467 (28.80) 525 (10.31) 114 (2.24) 5094. 2005 530 (6.62) 4016 (50.17) 2614 (32.65) 702 (8.77) 143 (1.79) 8005. 2006 702 (6.26) 5414 (48.27) 3944 (35.17) 1000 (8.92) 155 (1.38) 11215. Note: 1 Green is for superior performance; blue for full compliance; yellow for meeting major compliance standards but violating some minor requirements; red for violating important standards; and black for more extreme non-compliance. 2 The dates in parentheses are percentage representation of all the participating firms in a given year. Source: Legislative Affairs Office of the State Council (2007).. Governments can go beyond simple naming and shaming polluters by implementing environmental performance ratings and disclosure (PRD). The PRD relies on nonregulatory forces to create incentives for (mainly industrial) facilities to improve environmental performance. Some environmental economists call disclosure programs the third wave in pollution control policy after the first two waves that are legal regulations and market-based instruments, respectively (Tietenberg, 1998). Such programs will motivate polluters to reduce emissions, even in developing countries where regulatory infrastructures are insufficiently developed or even absent or are subjected to corruption, but where enough information can be reliably obtained to provide credible performance ratings (Dasgupta et al., 2006; World Bank, 2000). Modeled on Indonesia’s successful Program for Pollution Control, Evaluation and Rating (PROPER), the first PRD program in developing countries launched in June 1995 (World Bank, 2000), China introduced the Green Watch program in Zhengjiang, a relatively well-off city in Jiangsu province in June 1999, and Hohhot city, Inner Mongolia. This program develops colorcoded systems to rate corporate environmental performance. The first Green Watch ratings were disclosed through the media in 1999. The program was extended from Zhenjiang city to all over Jiangsu province in 2001, and to eight other provinces in China during 2003-2005. Nationwide implementation of the Green Watch program has been promoted since 2005 (Legislative Affairs Office of the State Council, 2007; Jin et al., 2010). Just like the Indonesian companies under the PROPER program, the companies under the Green Watch programs have dramatically changed their corporate environmental behavior. The Green Watch program in Jiangsu province indicates both increasing participation by firms and improvement in their compliance rates, with the number of rated firms increasing more than tenfold, from 1,059 in 2001 to 11,215 in 2006; and the percentage of firms with positive ratings (green, blue, and yellow). 20.
(23) increasing from 83% in 2001 to 90% in 2006 (Table 6). Moreover, the Jiangsu case suggests that Green Watch ratings have stronger effects on firms with red ratings (moderate noncompliance) than those with black ratings (extreme noncompliance) (Legislative Affairs Office of the State Council, 2007; Jin et al., 2010). 3.5 Cooperation with financial institutions Drawing the support of financial institutions is another avenue to promote improved corporate environmental performance. From April 1, 2007, China’s SEPA works with the People’s Bank of China, China’s central bank, on a new credit-evaluation system under which companies’ environmental compliance records are incorporated into the bank’s credit-evaluation system. This information will serve as a reference for commercial banks’ consideration of whether or not to provide loans. The bank could turn down requests for loans from firms with poor environmental records (Zhang, 2007a). In midJuly 2007, the SEPA announced the “green credit” policy jointly with the People’s Bank of China and China Banking Regulation Commission. They will work together to enforce it, with the financial bodies denying loans to firms that the SEPA identifies as failing to meet environmental standards. The SEPA later posted on its web site and notified China’s central bank and top banking regulatory commission 30 offending companies that will be barred from receiving credits (Xinhua Net, 2007). Some bank branches go further. Jiangyin Branch of the People’s Bank of China in Jiangsu province issued the color-coded lending guidance, favoring those companies of superior environmental performance. For those green-rated companies, banks will enhance their lending scale and give priority to their financial needs. By contrast, the lending scale for those red-rated ones at best remains current level unless lending is requested for environment-improving equipments and technical transformation. Even strict lending condition is attached to those black-rated companies. They cannot receive any new borrowing, and if they still fail to comply with the environmental regulations within a given period, banks will cut their borrowing and in the worst case even they are asked to return all their borrowing (Legislative Affairs Office of the State Council, 2007). Clearly, this concerted action by the central bank and the SEPA is expected not only to reduce the risks borne by commercial banks, but also to encourage companies to think about more about the environmental effect of their operation and self-discipline their environmental behavior. Currently, aided by the International Finance Corporation, the finance arm of the World Bank Group, China is experimenting with the green credit policy in the steel industry in Sichuan province (CAEP, 2009). In August 2007, the SEPA (2007b) also clearly stipulated that highly polluting enterprises are subject to its auditing of their environmental records in case these enterprises want to list shares in the Chinese stock markets or get re-financed. China Securities Regulation Commission will incorporate information on their environmental auditing into its decision on whether or not to allow these enterprises to be listed or get refinanced. Moreover, investors in capital markets can be an important ally, reacting to the disclosure of environmental performance related to the companies that they invest. The Shanghai Stock Exchange has disclosed environmental information since late 2009, in line with rules based on a May 2008 notice issued by the exchange to disclose corporate information (Ban, 2008). The reports from companies like PetroChina and Sinopec for example are still incomplete, because they have just released discharge data, but have no mention of records of violations and the. 21.
(24) subsequent penalties (Chung, 2010). Anyhow using a stock exchange as a vehicle to enhance environmental information disclosure represents the right direction. With the socalled H-shares from companies incorporated in Mainland China traded on the Hong Kong Exchanges and Clearing, it could amend its listing rules to require all those listed companies to disclose environmental information.. 4. Conclusions Confronted with the rising costs and health risks of environmental degradation associated with rapid economic growth, China has gradually recognized that the conventional path of encouraging economic growth at the expense of the environment cannot be sustained. It has to be changed. Accordingly, the central government sets environmental goals and environmental performance requirements. However, the environmental regulatory agency is ill-equipped either to enforce existing regulations or to design, implement, monitor, inspect and enforce new effective environmental polices to fulfill its tasks. This has led to poor compliance and weak enforcement. Correcting such a problem requires a major investment in strengthening the institutions of environmental governance to ensure that they have the adequate institutional, financial and technical capabilities to do the job. This is a necessary step, but not enough. Given that China has decentralized in the allocation and responsibility and has shifted control over resources and decision making to local governments and enterprises as the result of the economic reforms over the past three decades, the full participation of all stakeholders is also needed in protecting the environment in the context of government decentralization. In this regard, local government’s cooperation is crucial to the overall outcomes. To that end, the central government of China has been using a variety of tactics to incentivize local governments. They include placing those cities that meet the specified criteria on the honor role (the so-called model environmental city program), publicly naming the backlist of “the 10 most polluted cities” and those cities that failed to meet the specified environmental standards, having officials hold accountable for major environmental accidents, energy saving and pollution cutting in their turfs, releasing the first-ever report on economic costs of pollution (the so-called green GDP) to help the general public and officials alike to understand how severely China is confronting the rising environmental costs and health risks of environmental degradation, establishing the six regional environmental protection inspection centers independent of local governments, blacklisting those industrial projects (some even being considered the so-called “national key projects”) that had not undergone proper EIAs, and suspending those local governments’ rights to approve new projects in case there are offenders of environmental laws and regulations in their turfs. However, under the current evaluation criterion for officials in China, local officials typically have been promoted based on how fast they expand their local economies. This distorted incentive system tempts officials to disregard environmental costs of growth. Moreover, objectively speaking, the current fiscal system in China plays a part in driving local governments to seek higher GDP growth, because under the current tax-sharing system local governments have little choice but to focus on local development and GDP. 22.
(25) in order to cover a disproportional portion of the government expenditure. Another example of the improper tax-sharing scheme in China is related to differentiated tariffs mentioned in Section 2. The NDRC ordered provincial governments to raise power tariffs for eight energy-guzzling industries from October 1, 2006 onwards, but many local governments failed to implement the differentiated tariffs that charge more for companies classified as “eliminated types” or “restrained types” in these industries, with 14 of them even continuing to offer preferential power tariffs for such industries. Partly for strengthening China’s longstanding efforts to restructure its inefficient heavy industries, and partly faced with the prospect for the failure to meet the ambitious energy intensity target set for 2010, the NDRC and other 5 ministries and agencies jointly ordered utilities to stop offering preferential power tariffs to energy-intensive industries by June 10, 2010. Such industries will be charged with the punitive, differentiated tariffs. Those utilities that fail to implement the differentiated tariffs will have to pay a fine that is five times that of differentiated tariffs multiplied by the volume of sold electricity (Zhu, 2010). The reason for this failure is the lack of incentive for local governments to implement this policy, because all the revenue collected from these additional charges goes to the central government. To provide incentive for local governments, these revenue should be designed to be assigned to local governments, but the central government requires local governments to use the revenue specifically for industrial upgrading, energy saving and emissions cutting (Zhang, 2008 and 2010a). The evidence above suggests the need to carefully examine those objective and subjective factors that lead to the lack of local official’s cooperation on the environment, and to provide appropriated incentives to get their cooperation. One way to ensure local officials realize that they should take their jobs seriously is developing criteria that incorporate energy conservation and environmental performance into the overall evaluation of local officials’ performances. Something that will affect their promotions. To ensure the energy-saving goal to be met under the Top 1000 Enterprises Energy Conservation Action Program, achieving energy efficiency improvements has become a criteria for job performance evaluations of the heads of these enterprises. This will help them realize that they should take their jobs seriously because they have a very real stake in meeting energy-saving goals. This should be strengthened, and is extended to have local officials to hold accountable for energy saving and pollution cutting in their regions. Evaluation of local officials should abandon the unique importance of GDP. Instead, evaluation needs to look not only at economic growth of a region, but even more at the model and quality of its development. To that end, the central government not only needs to develop criteria that incorporate energy conservation and environmental performance into the overall evaluation of local officials’ performances, more importantly applies that criteria consistently to ensure energy saving and pollution cutting in a rational way to avoid current last-minute shutdown operation of factories cross the country for meeting the energy-saving goal. Alleviating the financial burden of local governments is another avenue to incentivize them not to eye on economic growth alone. Enlarging their tax revenue is the key to helping them cover a disproportional portion of the aforementioned government expenditure. The central government really needs to cultivate steady and sizeable sources. 23.
(26) of revenues for local governments. Enacting property taxes or real estate taxes for local governments is urgently needed. In the tax-sharing system adopted in 1994, onshore resource taxes are assigned to local governments, while the central government is collecting revenues from resource taxes off the shore. In this regard, broadening the current coverage of resource taxation and significantly increasing the levied level also help to increase local government’s revenues while conserving resources and preserving the environment. China also needs to take serious efforts towards planning and designing nationwide functional zoning. In the 11th five-year economic plan, this nationwide functional zoning concept has been sketched out. The underlying basis is that a region can be classified as optimized development zone, prioritized development zone, restrained development zone or prohibited development zone, depending on its population, resource endowment and environmental assimilating capacity. Each functional zoning is given differing development objectives. The latter are in turn aligned with different evaluation criteria for officials. For a region that needs to develop its industry, evaluation of local officials would see how fast they expand their local economies, while a region whose service sector needs to develop, evaluation would target the contribution of high-tech value added. By contrast, a region whose ecology services need to be preserved, evaluation would focus on green GDP. Planning and designing nationwide functional zoning may go beyond current administrative regions. Clearly, it is easier said than done. There has not since made much progress. But put in place and implemented effectively, a functional zoning policy not only helps to correct the current distorted incentive system, more importantly puts China towards a more sustainable development path. The active engagement of the private sector is essential for success as well. After all, the enterprises themselves are entities that use natural resources, make products and emit pollution. Having the right economic policies is crucial for polluting enterprises to hold accountable for their environmental behavior. China needs to get rid of energy subsidies, which have been reduced over time but still exist, in order to provide incentives for efficient fuel use and adoption of clean technologies that reduce emissions at sources. But removing such subsidies is but a first step in getting the energy prices right. Further steps include incorporating the costs of resources themselves to reflect their scarcity and internalizing the costs of externalities. Currently, resource taxes in China are levied on the basis of extracted volume of resources. Starting in 1984, resource taxes have been levied at Yuan 2-5 per ton of raw coal and Yuan 8 per ton of coking coal, with the weighted average of Yuan 3.5 per ton of coal. For crude oil, the corresponding tax is levied at Yuan 8-30 per ton. While the prices of coal and oil have significantly increased since 1984, the levels of their resource taxes have remained unchanged over the past 25 years. As a result, the resource taxes raised amounted to only Yuan 30 billion, accounting for about 0.56% of China’s total tax revenues and about 21% of the national government expenditure for environmental protection that amounted to Yuan 145 billion in 2008 (National Bureau of Statistics of China, 2009). Therefore, to avoid wasteful extraction and use of resources while alleviating the financial burden of local governments, current way in levying taxes on resources in China should be changed. Such taxation should be levied based on revenues. In addition, current resource taxes are only levied on seven. 24.
Figure


+3

Related documents
Methods: A sample of 59 adult high risk males detained in a high secure hospital completed questionnaires at baseline and post treatment to assess violent attitudes, anger,
Assessing the Impact of Biodiversity Conservation in the Management of Maize Stalk Borer (Busseola f
Field experiments were conducted at Ebonyi State University Research Farm during 2009 and 2010 farming seasons to evaluate the effect of intercropping maize with
повышается также скорость входа протонов в матрикс (рис.. Влияние МрТр на трансмембранный обмен ионов в митохондриях. Открывание МРТР, как уже было показано нами
It was decided that with the presence of such significant red flag signs that she should undergo advanced imaging, in this case an MRI, that revealed an underlying malignancy, which
Also, both diabetic groups there were a positive immunoreactivity of the photoreceptor inner segment, and this was also seen among control ani- mals treated with a
diagnosis of heart disease in children. : The role of the pulmonary vascular. bed in congenital heart disease.. natal structural changes in intrapulmon- ary arteries and arterioles.
For example, under Policy and Legal issues: A= existing National SDI coordinating body, B= good Policy establishing NGDI coordinating Agency, C= available NGDI Champion
The paper is discussed for various techniques for sensor localization and various interpolation methods for variety of prediction methods used by various applications
