Durham Research Online
Deposited in DRO:20 July 2015
Version of attached le:
Accepted Version
Peer-review status of attached le:
Peer-reviewed
Citation for published item:
Hashimzade, N. and Myles, G. (2015) 'Risk-based audits in a behavioural model.', Public nance review. .
Further information on publisher's website:
http://dx.doi.org/10.1177/1091142115602062
Publisher's copyright statement: Additional information:
Use policy
The full-text may be used and/or reproduced, and given to third parties in any format or medium, without prior permission or charge, for personal research or study, educational, or not-for-prot purposes provided that:
• a full bibliographic reference is made to the original source • alinkis made to the metadata record in DRO
• the full-text is not changed in any way
The full-text must not be sold in any format or medium without the formal permission of the copyright holders. Please consult thefull DRO policyfor further details.
Risk-Based Audits in a Behavioural Model
July 2015
Abstract
The tools of predictive analytics are widely used in the analysis of large data sets to predict future patterns in the system. In particular, predictive analytics is used to estimate risk of engaging in certain behaviour. Risk-based audits are used by revenue services to target potentially non-compliant taxpayers, but the results of predictive analytics serve predominantly only as a guide rather than a rule. “Auditor judgement” retains an important role in selecting audit targets. The paper assesses the effectiveness of using predictive analytics in a model of the compliance decision that incorporates several components from behavioural economics: subjective beliefs about audit probabilities, a social custom reward from honest tax payment, and a degree of risk aversion that increases with age. Simulation analysis shows that predictive analytics is successful in raising compliance and that the resulting pattern of audits is very close to being a cut-off rule.
Acknowledgements: We are grateful to James Alm, James Gordon, two anonymous referees, and participants at the Murphy Center Workshop “Advancing the Frontiers of Behavioural Public Economics” for helpful comments.
1 Introduction
Behavioural economics is playing an increasingly important role in the understanding of tax compliance. There is considerable evidence that social factors - such as the compliance behaviour of contemporaries - matter for the individual compliance decision (Spicer and Lundstedt, 1976, Baldry, 1986). There is also evidence that the preferences of taxpayers change over time. In particular, it is widely accepted that the typical person becomes increasingly risk averse with age and this is supported in the empirical (Wenzel, 2002) and experimental evidence on compliance (Alm et al., 2010). Furthermore, taxpayers cannot know the probability with which a return will be audited since the internal processes of the revenue service are not public information. These features reveal the limitations of the standard analysis of tax compliance in Allingham and Sandmo (1972) and Yitzhaki (1974) framework, and have led to the substantial body of research on behavioural model of compliance surveyed in Hashimzade et al. (2013).
The purpose of this paper is to explore the compliance and revenue consequences of a revenue service basing the decision to audit upon the application of predictive analytics with behavioural assumptions. Predictive analytics, in general, refers to a set of statistical tools used to identify historical patterns in large data sets and to use these patterns for prediction of the future behaviour. Tax authorities, in particular, the HMRC in the UK and the IRS in the United States, use predictive analytics to identify individuals and legal entities with higher risk of non-compliance, in order to inform audit strategies and to allocate audit resources in an efficient way. We make use of recent advances in the behavioural analysis of tax compliance to construct an agent-based model that can be used to simulate the implementation of predictive analytics. It is central to our compliance model that taxpayers do not know the audit rules of the revenue service. Instead, each taxpayer must form a belief about their probability of being audited that is based on experience and interaction with other taxpayers. This is consistent with the behavioural idea that individuals generally do not use the objective probabilities of events to make decisions but instead construct subjective probabilities that may systematically differ from the objective probabilities (Kahneman and Tversky, 1979). It is also assumed that taxpayers develop a social
attitude toward tax compliance. Formally, we model this as a social custom (Myles and Naylor, 1996), but it can also be interpreted more generally as capturing tax morale (Daude et al., 2012). The analysis is undertaken in an agent-based model with a social network that governs the interaction and the exchange of information among taxpayers. The information consists of attitudes towards compliance and beliefs about audits, and each taxpayer updates their personal information after an exchange. Taxpayers choose either to be an employee or to enter one of two forms of self-employment based on the distribution of income from each occupation. Working as an employee guarantees a safe income but because of third-party reporting or withholding precludes non-compliance. In self-employment income is uncertain, but non-compliance is
possible. The choice between occupations takes into account the non-compliance opportunities in self-employment. Risk aversion, attitudes, and beliefs affect the choice of occupation, so each taxpayer continually reviews the choice as new information is obtained and aging changes preferences over risk. Those least averse to risk (for given attitudes and beliefs) will choose self-employment and be the least compliant. Occupational choice acts as a self-selection device to ensure taxpayers who will exploit opportunities for non-compliance enter occupations where non-compliance is possible.
The predictive analytics investigated in the model are based on a Tobit regression model. The simulation collects data from tax audits and uses the data to estimate a model of compliance. The estimated model is then used to predict the extent of non-compliance based upon the data on tax returns. Taxpayers are ranked according to predicted non-compliance and the highest-ranked are audited. This process is repeated, and the compliance model re-estimated each period with new data. The results show that the predictive analytics are successful in increasing compliance and tax revenue. Interestingly, when only the reported incomes of the audited taxpayers are considered it is seen that the predictive analytics are effectively implementing an income cut-off rule for audits: above a cut-off level of income the proportion of returns audited is very low. This finding is in agreement with results on optimal auditing with commitment (see Reinganum and Wilde 1985, 1986, and Chander and Wilde 1998).
The paper is structured as follows. Section 2 describes the concepts that are built into the model. Section 3 provides analytical details on how these concepts are implemented. Sections 4 and 5 describe the simulation results under a random audit rule and when the audit rule is informed by predictive analytics. Section 6 concludes.
2 Conceptual Approach
This section places the separate components of the simulation model into the context of the existing literature on modelling tax compliance.
2.1 Subjective beliefs
Current economic literature often makes a distinction between risk and uncertainty. The situation is referred to as one of risk when the decision maker knows the probabilities of events. However, these probabilities can be distorted into “decisions weights” to form the expected payoff. Rank dependent expected utility framework (Quiggin, 1981, 1982; Quiggin and Wakker, 1994) uses a particular weighting scheme to transform the objective probabilities of events into subjective probabilities and has been applied to the evasion decision by Arcand and Graziosi (2005), Bernasconi (1998) and Eide (2001). Prospect theory (Kahneman and Tversky, 1979; Tversky and Kahneman, 1992) also uses a weighting scheme but payoffs are determined by gains and
losses relative to a reference point. Applications to compliance include al-Nowaihi and Dhami (2007), Bernasconi and Zanardi (2004), Rablen (2010), and Yaniv (1999).
Uncertainty occurs when the decision maker does not know the probabilities. One way to model uncertainty is by assuming the decision maker forms a probability distribution over possible probabilities of outcomes. This gives rise to the concept of “ambiguity” which has been surveyed in Camerer and Weber (1992) and applied to tax compliance by Snow and Warren (2005).
Non-expected utility models can better predict the patterns in evasion than the standard framework based on the expected utility. This is in part because they permit the subjective probability of audit (the weight on the payoff when audited) to be greater than the objective probability. They also open the possibility of designing compliance policy to manipulate the subjective nature of the decision (Elffers and Hessing, 1997). We incorporate these ideas into the analysis by assuming the probability is subjective and by explicitly modelling a process through which the subjective belief is formed. The model therefore provides an endogenous explanation of subjective probabilities that are systematically different from the objective probabilities.
2.2 Social customs
The experiments of Baldry (1986) suggest that the evasion decision is fundamentally different from a straightforward gamble described in the standard framework. One explanation for this finding is that choosing to evade results in costs being incurred. For instance, Lee (2001) assumes a taxpayer can reduce the assessed income after audit by paying an additional cost, such as a reduction in return from using concealed investments or the cost of professional advice for securing income in non-taxable forms.
An alternative approach is to view these costs as psychic, rather than financial. Such psychic costs might arise through the fear of detection or the shame of being exposed. Their magnitude may, therefore, reflect an individual’s underlying attitudes towards compliance – an important feature of psychological theories of tax evasion (e.g. Kirchler et al., 2008; Weigel et al., 1987). Gordon (1989) formally incorporates psychic costs into the evasion decision. He interprets such psychic costs as arising from the social setting in which the taxpayer operates, so the costs result from the loss of social prestige or reputation. An alternative to the psychic cost is the “conscience parameter” of Eisenhauer (2006, 2008). In this formulation of the compliance decision an individual recognizes that evading tax results in free-riding on taxes paid by compliant taxpayers. This generates a sense of guilt for the evader. The guilt is represented by discounting the untaxed income by the moral equivalent of a tax rate.
An alternative interpretation of the psychic cost is that it represents the loss of the payoff from following a social norm of honest tax payment. Under this interpretation it becomes natural
to assume that the additional cost is generated by explicit social interaction, with the cost being an increasing function of the proportion of taxpayers who do not evade. This formulation captures the fact that more social prestige will be lost, the more out of step the taxpayer is with the society. This approach – developed by Fortin et al. (2007), Kim (2003), Myles and Naylor (1996), and Traxler (2010) – shows that reputation effects can lead to multiple equilibria and epidemics of evasion.
The existence of additional costs seems essential for explanation of some features of the tax evasion decision. To capture underlying attitudes towards compliance we choose to include in the model a social custom of honest tax payment, so that there is a utility gain when tax is paid in full. The social custom is influenced by interaction in networks, which emphasizes the importance of the links among individuals.
2.3 Occupational choice
There are two reasons why occupational choice is important in the context of evasion. Firstly, there are differences in the possibility of concealing income in different occupations. This is partly due to the operation of the tax system. Most countries around the world use withholding system in which income tax is deducted directly from the salaries of employees. This prevents any opportunity for evasion (except in collaboration with the employer). Secondly, the nature of the occupation can explain whether there is a tradition of payment in cash not observed by tax authorities, and different occupations can support different social customs. It is, therefore, important to build into the model the choice of occupation. Occupational choice is not an issue that has featured prominently in the literature on tax evasion, although Cowell (1981), Isachsen and Strøm (1980), and Trandel and Snow (1999) consider the choice between work in the regular and informal economy.
The choice of occupation also has another aspect that is of interest from a theoretical perspective. It is standard to assume that occupations differ in the combination of risk and reward that they offer. For instance, salaried employment can be taken as the least risky occupation with all forms of self-employment having greater risk. Individuals allocate to occupations according to their ability at that occupation and their attitude to risk. This is the basis of the analysis of Kanbur (1979) and Black and de Meza (1997) that addresses social efficiency of aggregate risk-taking. In particular, they are concerned with whether an inefficiently low proportion of individuals enter risky occupations and, if so, whether tax and subsidy policy can be used to raise welfare.
Evasion has been incorporated into a model of occupational choice by Pestieau and Possen (1981). The possibility of evasion in the risky occupation has an interesting implication: if there is too little risk-taking without tax evasion then the possibility of evading encourages risk-taking.
In this case, setting policy to reduce evasion will drive risk-taking further from the social optimum. At the same time, more relaxed tax enforcement would serve as an indirect subsidy and may, therefore, improve welfare. The converse of this argument is that taxation has a variance-reducing effect on earnings from self-employment (government engages in risk-sharing), and, therefore, encourages self-employment. Evasion has the opposite effect and raises the variance again. So, from this argument, policy should try to reduce evasion.
2.4 Risk Aversion
As noted in Section 1, there is evidence that older taxpayers are more compliant. A similar phenomenon has been observed in other areas. For example, Morin and Suarez (1983) investigated the household demand for risky assets for a large sample of Canadian households and found that risk aversion increases uniformly with age. Bakshi and Chen (1997), using the aggregate U.S. time series data, find that risk aversion increases as population ages. Wang and Hanna (1997) studied the effect of age on risk tolerance using the 1983-89 panel of the U.S. Survey of Consumer Finances. In this study risk tolerance is measured by the ratio of risky assets to total wealth, where total wealth is comprised of human capital and net worth. Contrary to the previous studies, they find that, controlling for other variables, risk tolerance increases with age. These findings are not necessarily inconsistent with the assumption of unchanging preferences. It is possible they can be explained by changes in wealth levels over the lifecycle; but, as wealth typically accumulates with age, positive effect of age in risk aversion would require the latter to be an increasing function of wealth which is generally counter to evidence. In fact, as pointed out by Riley and Chow (1992), various studies find that risk aversion increases, decreases or does not change with wealth depending on how wealth is defined. Alternative potential explanations include shortening of the time interval over which any bad outcomes could be corrected or limitations on borrowing to smooth consumption after adverse realizations.
The most direct explanation is simply that preferences change over the lifecycle. Older people are more easily injured and take longer to heal, so it makes sense, from the evolutionary viewpoint, that they should be less willing to face physical danger. Translated into the contemporary setting, the ancestral reluctance to face physical danger manifests itself in the unwillingness to take risks of all kinds, including the financial risks involved in investment or in tax non-compliance.
These arguments are incorporated in the model by assuming that risk aversion is determined by a process that has a deterministic age-related growth component and a zero-mean random shock. Hence, the expected value of risk aversion increases with age but its realization does not increase equally for all taxpayers nor definitely increase in every period for every taxpayer. The increase in risk aversion affects compliance behaviour and occupational choice. In the model, as
a taxpayers ages, he or she is more likely to choose to be an employee and, consequently, to become fully compliant.
2.5 Social network
Tax evasion is an illegal act which has to be concealed from public view. Similarly, revenue services have an incentive not to reveal their audit strategies. Together, these imply that taxpayers are not fully informed about evasion and audits, and can gain from obtaining additional information. It seems natural to assume that information will not be publicly traded, but will be passed between taxpayers who are in a position of mutual trust. It is this situation that is modelled by the social network.
The importance of social contacts is supported by empirical evidence. There is a positive connection between the number of tax evaders known to a taxpayer and the level of that taxpayer’s own evasion (De Juan et al., 1994; Geeroms and Wilmots, 1985; Spicer and Lundstedt, 1976; Wallschutzky, 1984; Webley et al., 1988). This suggests that the compliance decision is made not in isolation by each taxpayer but with reference to the norms and observed behaviour in the general environment of the taxpayer.
This social interaction is captured through the application of network theory, as described in Goyal (2009) and Jackson (2004). In particular, recent advances in the endogenous formation of networks (Page and Wooders, 2009) allow tracking changes in the network over time, such as changes produced by switches in occupational choice. There is some emerging literature that uses networks in tax evasion analysis. Korobow et al. (2007) present agent-based simulations in a simple network. Franklin (2009) looks at more complex networks but with a simpler model of the compliance decision. Networks have also been applied to the analysis of crime more generally (Glaeser et al., 1996).
The social network plays two roles. First, it transmits the social custom from one person to another. If two non-evaders (evaders) meet then the importance of the social custom of honest payment is increased (reduced) for both, but if a non-evader meets an evader then it is reduced for the non-evader and increased for the evader. Second, the network transmits information about audit policy. Typically, the audit policy of the revenue service is not public information, and private individuals infer its policy partly from their own experience and partly by receiving information about the experiences of others. The simulation approach we employ can be seen as an application of agent-based modelling (Bloomquist, 2004; Tesfatsion, 2006) with agent interaction controlled by network structure.
3 Network Model
In this section we model the formation of attitudes and beliefs as the outcome of social interaction, and opportunities as the outcome of occupational choice. This is achieved by applying the theory of network formation to track the links between taxpayers and the transmission of attitudes and beliefs, and combining this with agent-based modelling which employs a behavioural approach to describe individual choices.
There are n individuals, indexed j = 1, ... , n, interacting repeatedly in discrete time, t = 1, ... ,
T. Each individual enters the economy and works for a finite number of periods. Once the maximum working lifespan is reached, the individual is replaced. Each individual, j, at time t is described by a vector of characteristics
wj,s1j,s2j,zj;aj,t,j,t,p1j,t,p2j,t,j,t
. (1)At the start of an individual’s life all the individual characteristics are randomly assigned by making draws from independent distributions. The first four characteristics remain constant throughout the working life of the taxpayer. These characteristics are wj , the wage in employment (occupation 0); sj , the skill in self-employed occupation α, = 1, 2; and zj, the payoff from following the social custom. The remaining six characteristics change with time and so are indexed by time index, t. The age, aj,t, increases by 1 in every period. The coefficient of
relative risk aversion, j,t, follows the process
1
, ,1
,t jt t
j g
where g is a deterministic growth rate and t is a white-noise random variable. The remaining characteristics are updated through interaction with the revenue service and with other taxpayers in the social network. These are: pj,t , the perceived (subjective) probability of audit in
occupation , held by individual j at time t, and j,t, the weight attached to payoff from complying with the social custom by individual j at time t.
We now describe how these variables enter into the choice problem of a taxpayer and how the subjective probability and weight attached to social custom are updated.
In each period, t, every individual chooses their preferred occupation1 and, once income is
realized, the optimal level of evasion. Individual j has a choice of entering employment or one of
1It may seem unrealistic to have an occupational choice in every period but in the simulations
the two self-employment occupations. If employment is chosen the wage, wj, is obtained with certainty. The outcome of self-employment for individual j in occupation α at time t is given by
sjyj,t where yj,t is a random draw at time t from the probability distribution function F
.The choice of occupation is taken on the basis of F
but the choice of evasion is made after the realization of yj,t. It is assumed that E
y1 E y2 and Var(y1)Var(y2), so if s1j s2joccupation 2 is riskier than occupation 1 but offers a higher expected income. Both self-employment occupations are riskier than employment, in the sense that for each agent the wage in employment is constant, i.e. Var(wj)0.
It is not possible to evade tax in employment because incomes are subject to third-party reporting or to a withholding tax. Evasion only becomes possible when self-employment is chosen. Taxpayer j has belief at time t that the probability of evasion in occupation α being detected is pj,t. The belief about the probability of detection is updated through the experience
of the taxpayer with audits and through the exchange of information when meeting other taxpayers. The attitude of taxpayer j toward evasion is summarized inj,t, the weight given to the social custom. This attitude is also updated through meetings with other taxpayers. We describe the processes for updating attitudes and beliefs in detail after discussing the choice of occupation for given attitudes and beliefs.
The choice of occupation and the choice to evade tax involve risk. Taxpayer j has relative risk aversion measured by the risk aversion parameter, j,t.The taxpayer chooses occupation and evasion level at time t to maximize subjective expected utility given beliefs {pj,t} . For analytical
tractability, we assume a CRRA form for utility:
t j jt jt t j Y Y U , 1 1 1 , (2)where Yjt is the taxpayer j’s (disposable) income at time t. The attitude toward evasion determines the utility value of following the social custom of honest tax payment. The payoff from the social custom is given by zj and the individual weight, or the importance, assigned to this payoff by the taxpayer is determined byj,t. Hence, compliance with tax payment at time t
generates an additional utility ofj,tzj.
, 1 1 1 , , 1 0 , j t j t j j z w V t j where is the constant marginal tax rate. We assume j,t is non-negative and finite, and without loss of generality normalize it to be between zero and one.
The possibility of tax evasion makes the choice of self-employment a compound lottery: the income is random, as is the outcome of choosing to evade. Define the expected payoff from the optimal choice of evasion in self-employment occupation α for a given realization of yj,t as
1
1
, 1 max 0 , , , , , , 0 , , j i t j i j i j E j t j j t j j t j j t j j t j y s E t j e z E y s U p E f y s U p y V 1 where f > 1 is the fine levied on unpaid tax if evasion is detected. The term 1 A is an indicator
function that takes the value of one if A is true and zero otherwise: the payoff from the social custom is obtained only if tax is paid in full. The level of evasion will be a function Ej
yj,t ofthe realized income yj,t in occupation α. The expected payoff from the compound lottery
describing occupation α is then
ydF
y . V V Y e The choice of occupation is made by comparing the utility levels from employment and from self-employment. Hence, the chosen occupation is given by selecting the maximum of
0 1 2
, ,V V
V .
After self-employment occupation
1,2 is chosen at time t an outcome ~yj,t is realizedaccording to the probability distribution function F
. Given the outcome, the optimal evasion decision is implemented, as described above. Denote the optimally chosen level of evasion by E~j,t Ej,t
~yj,t . Tax returns are submitted, and a number of those inself-employment occupations are then audited, according to a process chosen by the revenue service. If evasion is discovered, unpaid tax is reclaimed and the fine at rate f is imposed on unpaid tax.
The social network is modelled as a set of bidirectional links described by an nn
. 0 1 0 0 1 0 1 0 0 1 0 1 0 0 1 0 A
The first row, representing the links of individual 1, has a single 1 in column 2 which means that 1 is linked to 2. There is a corresponding 1 in the first column in the second row representing the links of individual 2 with 1. That is, the element in row i and column j of matrix A is defined as
otherwise. 0 network; in the linked are and if 1 i j Aij
In the simulation, the network matrix is created at the outset and does not change.2 The network determines who is likely to meet and exchange information. In each period a random selection of meetings occur described by a matrix t
C of zeros and ones which is randomly drawn in every period. Individuals i and j meet during period t if AijCijt 1. At a meeting of i and
j there is a probability that information is exchanged on the subjective beliefs about audit rates and whether the taxpayers were compliant in that period. The probability of information exchange depends on the occupational groups to which i and j belong; the probability is the highest when they are in the same occupation. Let i be engaged in occupation α and j in occupation . The probabilities of information exchange occurring at a meeting are given by
q where , = 0, 1, 2. We assume q q for any .
Recall that individuals hold beliefs about the probability of being audited in each occupation. We assume there are two ways in which beliefs are updated. Consider taxpayer j who has worked in occupation in period t. After submission of the tax return, the taxpayer may or may not be audited. On the basis of the outcome the belief about the audit probability, pj,t, in
that occupation is then adjusted. The belief about the audit probability in the other occupation,
t j
p , , , remains unchanged at this stage. Following this, the taxpayer may meet with a
contact in the network. Let the meeting be with a taxpayer who is engaged in occupation . At the
2 Here the network is fixed, but the probabilities of information exchange between the linked
individuals change if they switch occupations, as described below. Another possibility would be to have the network itself revised as a consequence of chosen actions, i.e. agents in different
meeting information is exchanged with probabilityq. This information is then used to update the belief about the audit probabilities, ,
,t j
p , in both occupations.
The choice of occupation in period t+1 is made on the basis of the beliefs
2
, 1,t, jt
j p
p
updated after the audits and the information exchange. The updating process immediately after the audit is qualitatively similar to Bayesian updating, and is to assume that individuals feel marked as targets if they are audited, so that one audit is believed likely to be followed by another. We term this the target effect. In contrast, those not audited in a given period believe they are less likely to be audited in the next period. Empirical support for this assumption can be found in Advani et al. (2015). Formally, if audited in period t, an individual’s belief about being audited in the next period is raised to probability P, otherwise it decays. The updating rule for the subjective probability is therefore
. ; ~ , 0,1 , 0,1 ; 1 ~ , 1 , , , , 1 , t j t j t j t j t j t j p p P p A P A p (3) where Aj,t=1 if taxpayer j was audited in period t and Aj,t=0 otherwise. This can also be written as
otherwise. , 0,1 ; ~ , at audited if , 0,1 ~ 1 , 1 , t j t j p t P p (4)We refer to the case of P = 1 as the maximal target effect.
After the audit process is completed the taxpayer may meet with a contact. The information that may (or may not) be exchanged at a meeting includes the subjective probabilities and whether or not the agents were audited. If taxpayer j in occupation meets individual i who works in occupation the subjective probability is updated according to the rule
. 1 y probabilit with , ~ , y probabilit with , ~ 1 ~ ~ , , , , , , , 1 , αβ t j t i t j t j -q p q p p p (5)The importance assigned to the social custom is also determined by interaction in the social network. The weight,j,t, is updated in period t if information exchange occurs between j and some other taxpayer in that period. Assume individual j meets individual i at time t and information exchange takes place. If i evaded (E~i 0), j’s weight on honesty is adjusted
downwards. Conversely, if i was honest, j’s weight on honesty is adjusted upwards. The magnitude of adjustment is assumed to be larger for the intermediate weights (j,t close to 0.5)
and smaller for low (close to 0) and high (close to 1) weights. The updating process is described by
. 1 y probabilit with , , y probabilit with , 2 1 1 2 , , 5 . 0 , 0 ~ , 1 , , αβ t j t j t j E t j t j -q q t j i 1 1 where E~i is the level of evasion of i, is the speed of adjustment, and 1 A is an indicator
function with value of 1 if A is true and 0 otherwise. Hence, j,t1j,t if information is exchanged with a compliant taxpayer, j,t1j,t if information is exchanged with an evader, and j,t1j,t if no information exchange has taken place.
In a summary, the time line of the model is the following. (1) An individual makes his or her occupational choice, based on private information about the wage he or she will earn with certainty in paid employment, his or her productivity (skill) in each of the self-employment occupation, and the distribution of earnings per unit skill in each occupation. He or she also knows that in self-employment there is an opportunity to evade tax, and has a belief about the chance of being audited in each occupation, as well as some weight on honesty, or an additional utility from paying tax in full. (2) After the occupation is chosen, the earnings are realized and the evasion decision is made. (3) A fraction of self-employed individuals are audited and any evasion is fully detected and penalized. (4) Each taxpayer updates his or her own belief about the probability of being audited after having or not having experienced an audit. (5) Taxpayers meet in their network, exchange information, and update their beliefs about the audit rates, now based on the experience of their peers. They also update social custom by adjusting weight on honesty in their utility function, according to honesty or dishonesty of their peers.
4 Baseline Simulations
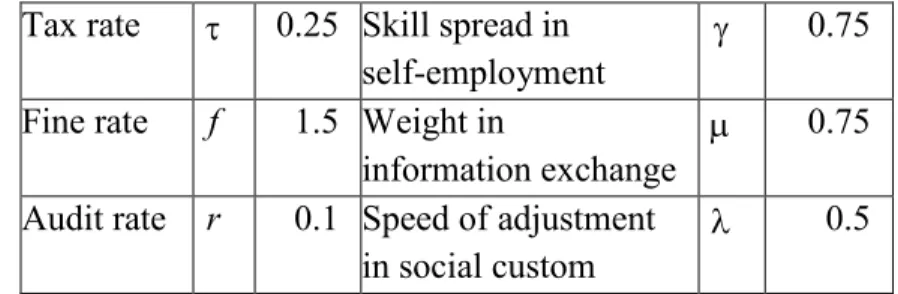
We first conduct a simulation of the network model described above under the assumption of random audits to obtain a baseline outcome. This allows an investigation of the nature of the equilibrium and the consequences of the alternative updating rules for beliefs. The parameter values and the distributions for the random variables that remain constant across the simulations are given in the Appendix. As seems realistic, we set the parameter values such that, on average, the payoff from self-employment will exceed that from employment.3
3 The value of the social custom z is measured in units of utility. Therefore, although z appears
We assume that earnings in occupation , 0,1,2 , are drawn from lognormal
distribution,
2
,
logN , and that skills in self-employment are given by
x 1 1 , where skill factor, x, is a uniform
0,1 random variable, and skill spread,
0,1 , is a constant parameter.Each individual knows their wage in employment, y0j,t wj, skill, sj in the self-employment
occupations 1,2 , and the distribution of outcomes, F
, in the self-employedoccupations. At time 0 each individual is randomly assigned a vector of subjective beliefs,
2
0 , 1 0 , , j j pp , the level of importance of social custom, j,0, both drawn independently from a
uniform
0,1 distribution, and age, aj,0 (years of work), drawn from a uniform
0,T distribution; we use T 19. Taxpayer j works until the age of Tjmax before being replaced by anew taxpayer with a randomly drawn set of characteristics; the retirement age, max j
T , is drawn
from a uniform
T1,T10
. The first 70 periods of the simulation are conducted with randomaudits of self-employed taxpayers. The audit rate for all self-employed is r=0.1; the employed are not audited. Data from audit outcome is recorded from period 21 onwards to avoid initial condition effects. Audits based on predictive analytics are implemented from period 71 onwards; the proportion of audited self-employed is kept constant at r.
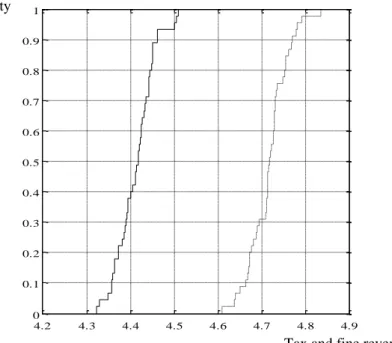
The simulation involves the random realization of the self-employment outcome in every period for every self-employed taxpayer. As a consequence, the outputs of the simulation (compliance levels, audit outcomes, tax revenues etc.) are random variables. For this reason the level of tax and fine revenues are contrasted in Figure 1 by plotting the (empirical) cumulative distribution functions for random auditing and for audits targeted using predictive analytics where revenue is on the horizontal axis.4 The cumulative distribution function for targeted audits
exhibits first-order stochastic dominance over that for random audits, which implies that the expected value of tax revenue is higher under the targeted audits than under the random audits. In fact, the worst outcome for targeted is better than the best outcome for random. Furthermore, any positive monotonically increasing function of the tax revenue has higher expected value under
the utility function in (2). Thus, with given parameterisation, a true report increases the utility of an “average” individual by about 10 per cent.
4 Each point shows the probability (on the vertical axis) that revenue collected in any period is
less than or equal to a given value (on the horizontal axis). For example, with probability 0.4 tax revenue collected in one period is 4.4 units, or less, under random audits and about 4.71 units, or less, under targeted audits.
the targeted audits than under the random audits. This is important, because the objective function of the tax authority or of the government need not necessarily be the tax revenue itself, but it may be positively related to the amount of revenue. This comparison shows clearly that predictive analytics successfully target audits and achieve higher revenue – or any objective increasing in revenue.
Figure 1: Cumulative distribution functions for tax and fine revenues (random: solid; targeted: dashed)
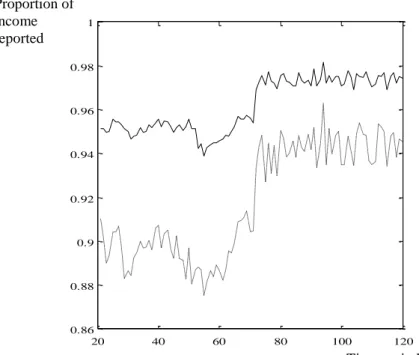
The change in compliance behaviour that lies behind the increase in revenue from targeting is shown in Figure 2. This shows proportion of income reported by the self-employed for each of the periods of the simulation. The compliance levels show the link between risk aversion and compliance: occupation 2 is riskier and the compliance level is lower. The change in compliance after the implementation of predictive analytics after period 70 is very clear. Furthermore, the predictive analytics reduce the compliance gap between the two groups.
4.2 4.3 4.4 4.5 4.6 4.7 4.8 4.9 0 0.1 0.2 0.3 0.4 0.5 0.6 0.7 0.8 0.9 1
Tax and fine revenue Probability
Figure 2: Compliance levels (occupation 1: solid; occupation 2: dashed)
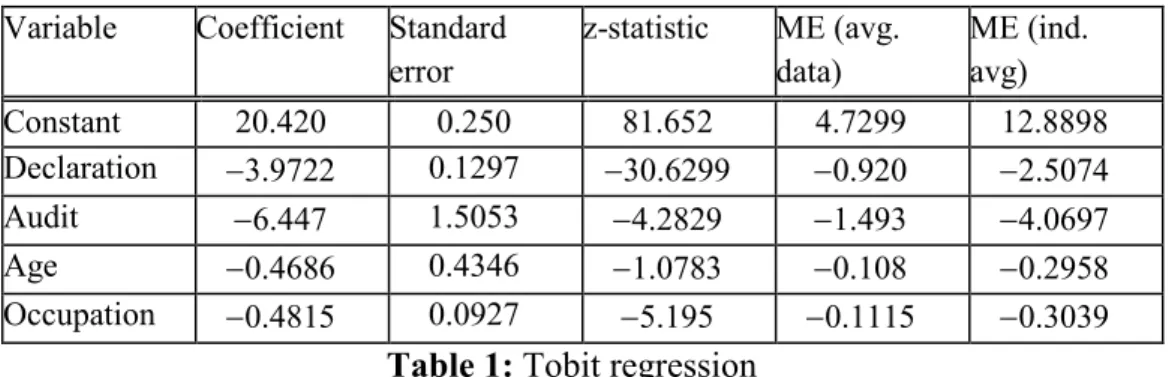
The predicted level of evasion for each taxpayer is estimated using a Tobit model; the regression equation is re-estimated in every period using the information from the new audits. Table 1 shows the output of the Tobit regression estimated in the last period of simulations. The dependent variable for the model is the amount of evasion. Declaration is the income declared on the tax return. Audit is a dummy with value 1 if the taxpayer was audited in the previous period.
Occupation is a dummy with value 1 if the taxpayer is working in occupation 1. All estimated coefficients have the expected signs: predicted non-compliance is greater when declared income is lower, the taxpayer was not audited in the previous period, the taxpayer is younger, and is engaged in self-employment occupation 2. All coefficients are statistically significant at 1 per cent level, except for the coefficient on age. The last two columns show the marginal effects estimated for the sample average characteristics and the estimated marginal effects averaged across individuals in the sample.
It is interesting to compare this regression result with that of Feinstein (1999) obtained using IRS data. Feinstein reports a negative coefficient on “retired” and a positive coefficient on “farmers”. Other occupational groups also have statistically significant coefficients. In this respect, the two sets of results are in agreement about the role of age and the fact that occupational dummies matter. Where they disagree is in the sign of the estimated coefficient on declared income. In our model this has a negative sign but in Feinstein a positive sign. This can be a consequence of our model over-predicting the level of hidden income by each
20 40 60 80 100 120 0.86 0.88 0.9 0.92 0.94 0.96 0.98 1 Time period Proportion of income reported
non-compliant taxpayer, or the data in Feinstein (which is obtained from audit outcomes) not capturing all of the non-compliance. We assume that audits are completely successful in detecting omitted income whereas the data are the outcome of imperfect audits.
Variable Coefficient Standard error z-statistic ME (avg. data) ME (ind. avg) Constant 20.420 0.250 81.652 4.7299 12.8898 Declaration 3.9722 0.1297 30.6299 0.920 2.5074 Audit 6.447 1.5053 4.2829 1.493 4.0697 Age 0.4686 0.4346 1.0783 0.108 0.2958 Occupation 0.4815 0.0927 5.195 0.1115 0.3039
Table 1: Tobit regression
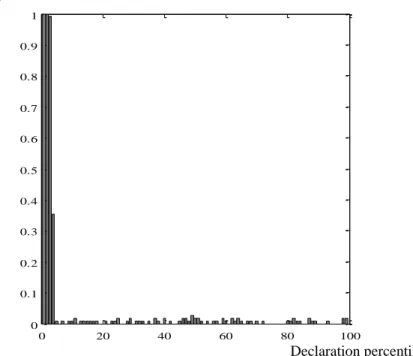
The consequences of following the audit recommendation of the predictive analytics can be understood by analysing the characteristics of the audited taxpayers in each percentile of the declared income distribution. Figure 3 shows the proportion of audited taxpayers in self-employment occupation 1 in the population of the audited. Approximately one half of the taxpayers who are audited are in self-employment occupation 1, but this group are about twice as numerous as occupation 2. Consequently, a greater proportion of the taxpayers in occupation 2 are audited. 20 40 60 80 100 0 0.1 0.2 0.3 0.4 0.5 0.6 0.7 Declaration percentile Proportion in occupation 1
Figure 3: Proportion of audited in occupation1 by percentile of declaration
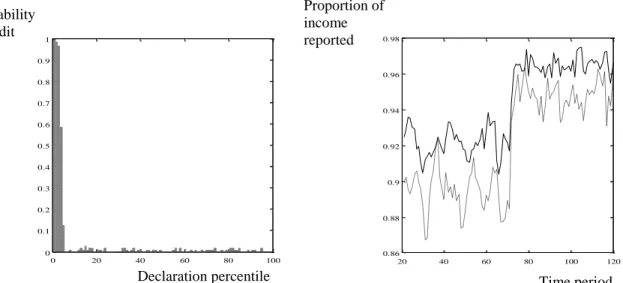
Theoretical characterizations of optimal audit rules have been developed in models in which declared income is the only distinguishing characteristic of taxpayers. When the tax authority can commit to an audit function (probability of audit as a function of income) then the optimal rule is to operate a cut-off (Reinganum and Wilde, 1985). Without commitment, the rule is a decreasing function of declaration (Reinganum and Wilde, 1986). Figure 4 plots the audit rates implied by the predictive analytics for each percentile of the declaration distribution for all self-employed taxpayers in two occupations. While there is some probability of audit throughout the whole range of declared incomes, the pattern is very close to a cut-off rule based on declared income. Almost all taxpayers are audited in the lowest three percentiles, with the probability falling away rapidly for higher percentiles. Although the revenue service is selecting for audit on the basis of several characteristics the effective rule is close to an income cut-off. In the Tobit regression declared income has strong explanatory power for evaded tax (as shown in Table 1), so low declared income is a good predictor for a higher evaded tax. This leads to the selection of taxpayers for audit based strongly, although not exclusively, on declared income.
Figure 4: Probability of audit by declaration percentile
0 20 40 60 80 100 0 0.1 0.2 0.3 0.4 0.5 0.6 0.7 0.8 0.9 1 Declaration percentile Probability of audit
5 Robustness
The effective of predictive analytics is made clear in the figures of the previous section. However, these figures reflect only one particular choice of parameter values and realization of the random variables. To provide some support for the argument that they indicate general features a robustness check is now reported. This check varies the audit rate and the social custom.
The first revision is to reduce the audit rate from 10 per cent to 5 per cent. Figure 5 shows that this does not affect the relationship between audit probability and declared income nor the impact upon compliance.
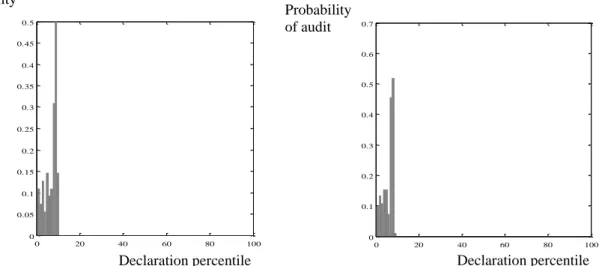
Figure 5: Reduced probability of audit (left hand: audit probability; right hand: compliance) Figure 6 reports the effect of further reducing the probability of audit to 1 per cent and also considering a lower value of the payoff from the social custom. The audit probabilities in Figure 6 show that neither of these causes any significant change in the shape of the distribution; it retains the form of a cut-off rule.
0 20 40 60 80 100 0 0.1 0.2 0.3 0.4 0.5 0.6 0.7 0.8 0.9 1 20 40 60 80 100 120 0.86 0.88 0.9 0.92 0.94 0.96 0.98 Probability of audit
Declaration percentile Time period
Proportion of income reported
Figure 6: Probability of audit (left: lower social custom; right: baseline social custom) The predictive analytics are based on the use of an occupational dummy variable in a single Tobit regression. An alternative specification would be to estimate a separate Tobit regression for each of the two potentially non-compliant occupations. There would be some gain in efficiency from doing this since it would allow the estimated parameters to vary between occupations. However, it is not clear that this gain would be significant. Recall that the process is to estimate the regression, use the estimate to predict the expected level of non-compliance, and use the ranking of taxpayers by predicted non-compliance to select audit targets. Running two separate regressions would only have a significant effect if it were to alter the ranking compared to that obtained in a single regression using a dummy variable for occupation. The dummy variable is essentially capturing the effect of the unobserved degree of risk aversion on compliance choices, and this variable would still remain unobserved with two separate regressions. For this reason we conjecture that separate regressions would not significantly affect the model predictions.
6 Conclusions
The process for the selection of audit targets is important for a revenue service aiming to maximize the effectiveness of use of audit resources. The tools of predictive analytics have been adopted by many revenue services, including HMRC and the IRS, – although in practice the results of predictive analytics serve predominantly only as a guide rather than a rule, and an “auditor judgement” retains an important role in selecting audit targets. The paper has investigated the consequences of predictive analytics in a rich network model that employs ideas from behavioural economics to model the compliance decision of taxpayers. The behavioural
0 20 40 60 80 100 0 0.05 0.1 0.15 0.2 0.25 0.3 0.35 0.4 0.45 0.5 0 20 40 60 80 100 0 0.1 0.2 0.3 0.4 0.5 0.6 0.7 Probability of audit Declaration percentile Probability of audit Declaration percentile
aspects of the model are the formation of a subjective belief about the audit rates and a social custom toward tax compliance through experience and social interaction. Since attitudes and beliefs emerge endogenously they can differ systematically across occupational groups. Given this fact, there is likely to be a benefit to the revenue service of selecting audit targets on the basis of occupation as well as the declared income level. The existing theoretical models of optimal auditing have not been able to explore this issue because they do not identify different occupations or sources of income.
The results of the simulation show that audit rules based on predictive analytics are more effective in raising revenue when compared to a strategy of random audits. The underlying feature of the outcome of the simulation model is that taxpayers self-select into occupations on the basis of risk aversion. There is, therefore, little surprise that the predictive analytics focuses audits disproportionately upon taxpayers in the riskier occupation. The predictive analytics reduce the difference in compliance rates between occupations but does not eliminate it entirely. Interestingly, the outcome of the predictive analytics has the form of a cut-off rule: almost all audit effort is focussed on declarations of low income.
In this paper the audit rule is based on the predicted amount of evaded tax calculated using Tobit regression: the tax authority audits top ten per cent (or any other chosen proportion) of the predicted largest evaders. An alternative audit rule could be based on a probit (or logit) regression. Namely, for each taxpayer the tax authority can calculate the predicted probability of evasion and audit top ten per cent (or any other chosen proportion) of the most likely evaders. Furthermore, these two rules can be combined, and the set of explanatory variables in each regression can be varied, thus generating different other rules, all based on predictive analytics. Exploring the properties of various audit rules and identifying the most effective ones, either by collected revenue or by the achieved compliance rates, is left for the future research.
References
Advani, A., Elming, W., and Shaw, J. (2015) “How long-lasting are the effects of audits”, Discussion paper 015-15, Tax Administration Research Centre.
Allingham M., and Sandmo, A. (1972) “Income tax evasion: A theoretical analysis”, Journal of Public Economics, 1, 323–338.
Alm, J., Cherry, T., Jones, M.L. , and McKee, M., (2010) “Taxpayer information assistance services and tax compliance behaviour”, Journal of Economic Psychology,31, 577 – 586. al-Nowaihi, A., and Dhami, S. (2007) “Why do people pay taxes: Expected utility theory versus prospect theory”, Journal of Economic Behavior and Organization, 64, 171–192.
Arcand, J.-L., and Graziosi, G. R. (2005) “Tax compliance and rank dependent expected utility”,
Bakshi, G.S., and Chen, Z. (1997) “Baby boom, population aging, and capital markets”, Journal of Business, 67, 163–202.
Baldry, J. C. (1986) “Tax evasion is not a gamble”, Economics Letters, 22, 333–335.
Bernasconi, M. (1998) “Tax evasion and orders of risk aversion”, Journal of Public Economics,
67, 123–134.
Bernasconi, M., and Zanardi, A. (2004) “Tax evasion, tax rates and reference dependence”,
FinanzArchiv, 60, 422–445.
Black, J., and de Meza, D. (1997) “Everyone may benefit from subsidising entry to risky occupations”, Journal of Public Economics, 66, 409–424.
Bloomquist, K. M. (2004) “Multi-agent based simulations of the deterrent effects of taxpayer audits”, in: Kalambokidis, L. (Ed.), Proceedings of the 97th Annual Conference on Taxation (pp. 159–173). Washington, DC: National Tax Association.
Camerer, C., and Weber, M. (1992) “Recent development in modelling preferences: Uncertainty and ambiguity”, Journal of Risk and Uncertainty, 5, 325–370.
Chander, P., and Wilde, L. L. (1998) “A general characterization of optimal income tax enforcement”, Review of Economic Studies, 65, 165–183.
Daude, C., Gutierrez, H., and Melguzio, A. (2012) “What drives tax morale?” OECD Development Centre Working Papers, No. 315, OECD Publishing.
De Juan, A., Lasheras, M. A., and Mayo, R. (1994) “Voluntary tax compliant behaviour of Spanish income tax payers”, Public Finance, 49, 90–115.
Eide, E. (2001) “Rank dependent expected utility models of tax evasion”, International Centre for Economic Research Working Paper ICER 27/2001.
Eisenhauer, J. G. (2006) “Conscience as a deterrent to free riding”, International Journal of Social Economics, 33, 534–546.
Eisenhauer, J. G. (2008) “Ethical preferences, risk aversion, and taxpayer behaviour”, Journal of Socio-Economics, 37, 45–63.
Elffers, H., and Hessing, D. J. (1997) “Influencing the prospects of tax evasion”, Journal of Economic Psychology, 18, 289–304.
Feinstein, J.S. (1991) “An econometric analysis of income tax evasion and its detection” RAND Journal of Economics, 22, 14–35.
Fortin, B., Lacroix, G., and Villeval, M. -C. (2007) “Tax evasion and social interactions”,
Journal of Public Economics, 91, 2089–2112.
Franklin, J. (2009). Networks and taxpayer non-compliance. London: H. M. Revenue and Customs.
Geeroms, H., and Wilmots, H. (1985) “An empirical model of tax evasion and tax avoidance”,
Glaeser, E., Sacerdote, B., and Scheinkman, J. (1996) “Crime and social interactions”, Quarterly Journal of Economics, 111, 507–548.
Gordon, J. P. F. (1989) “Individual morality and reputation costs as deterrents to tax evasion”,
European Economic Review, 33, 797–805.
Goyal, S. (2009). Connections: An introduction to the economics of networks. Princeton: Princeton University Press.
Hashimzade, N., Myles, G. D., and Tran-Nam, B. (2013) “Applications of behavioural economics to tax evasion”, Journal of Economic Surveys, 27, 941–977.
Isachsen, A. J., and Strøm, S. (1980) “The hidden economy: The labor market and tax evasion”,
Scandinavian Journal of Economics, 82, 304–311.
Jackson, M. O. (2004) “A survey of models of network formation: Stability and efficiency”, in: Demange, G. and Wooders, M. (Eds.) Group Formation in Economics; Networks, Clubs and Coalitions (pp. 11–57). Cambridge: Cambridge University Press.
http://www.hss.caltech.edu/æjacksonm/netsurv.pdf
Kahneman, D., and Tversky, A. (1979) “Prospect theory: An analysis of decision under risk”,
Econometrica, 47, 263–293.
Kanbur, S. M. (1981) “Risk taking and taxation: An alternative perspective”, Journal of Public Economics, 15, 163–184.
Kim, Y. (2003) “Income distribution and equilibrium multiplicity in a stigma-based model of tax evasion”, Journal of Public Economics, 87, 1591–1616.
Kirchler, E., Hoelzl, E., and Wahl, I. (2008) “Enforced versus voluntary tax compliance: The ‘slippery slope’ framework”, Journal of Economic Psychology, 29, 210–225.
Korobow, A., Johnson, C., and Axtell, R. (2007) “An agent-based model of tax compliance with social networks”, National Tax Journal, 60, 589–610.
Lee, K. (2001) “Tax evasion and self-insurance”, Journal of Public Economics, 81, 73–81. Morin, R. A., and Suarez, A.F., (1983) “Risk aversion revisited”, The Journal of Finance, 38, 1201–1216.
Myles, G. D., and Naylor, R. A. (1996) “A model of tax evasion with group conformity and social customs”, European Journal of Political Economy, 12, 49–66.
Page, F. H. Jr., and Wooders, M. H. (2009) “Endogenous network dynamics”, CAEPR Working Paper No. 005-2009.
Pestieau, P., and Possen, U. M. (1991) “Tax evasion and occupational choice”, Journal of Public Economics, 45, 107–125.
Quiggin, J. (1981) “Risk perception and the analysis of risk attitudes”, Australian Journal of Agricultural Economics, 25, 160–169.
Quiggin, J. (1982) “A theory of anticipated utility”, Journal of Economic Behavior and Organization, 3, 323–343.
Quiggin, J., and Wakker, P. (1994) “The axiomatic basis of anticipated utility: A clarification”,
Journal of Economic Theory, 64, 486–499.
Rablen, M. D. (2010) “Tax evasion and exchange equity: A reference-dependent approach”,
Public Finance Review, 38, 282–305.
Reinganum, J., and Wilde, L. (1985) “Income tax compliance in a principal-agent framework”,
Journal of Public Economics, 26, 1–18.
Reinganum, J., and Wilde, L. (1986) “Equilibrium verification and reporting policies in a model of tax compliance”, International Economics Review, 27, 739–760.
Riley Jr., W. B., and Chow, K.V. (1992) “Asset allocation and individual risk aversion”,
Financial Analysts Journal, 48, 32–37.
Snow, A., and Warren, R. S. Jr. (2005) “Ambiguity about audit probability, tax compliance, and taxpayer welfare”, Economic Inquiry, 43, 865–871.
Spicer, M. W., and Lundstedt, S. B. (1976) “Understanding tax evasion” Public Finance, 31, 295–305.
Tesfatsion, L. (2006) “Agent-based computational economics: A constructive approach to economic theory”, in: Tesfatsion, L. and Judd, K. L. (Eds.) Handbook of Computational Economics Vol. II (pp. 831–880). Amsterdam: North-Holland.
Trandel, G., and Snow, A. (1999) “Progressive income taxation and the underground economy”,
Economics Letters, 62, 217–222.
Traxler, C. (2010). Social norms and conditional cooperative taxpayers. European Journal of Political Economy, 26, 89–103.
Tversky, A., and Kahneman, D. (1992) “Advances in prospect theory: Cumulative representation of uncertainty”, Journal of Risk and Uncertainty, 5, 297–323
Wallschutzky, I. G. (1984) “Possible causes of tax evasion”,. Journal of Economic Psychology, 5, 371–384.
Wang, H. and Hanna, S. (1997) “Does risk tolerance decrease with age?” Financial Counseling and Planning, 8, 27–31.
Webley, P., Robben, H., and Morris, I. (1988) “Social comparison, attitudes and tax evasion in a shop simulation”, Social Behaviour, 3, 219–228.
Weigel, R. H., Hessing, D. J., and Elffers, H. (1987) “Tax evasion research: A critical appraisal and theoretical model”, Journal of Economic Psychology, 8, 215–235.
Wenzel, M. (2002) “The impact of outcome orientation and justice concerns on tax compliance: The role of taxpayers’ identity”, Journal of Applied Psychology, 87, 629–645.
Yaniv, G. (1999) “Tax compliance and advance tax payments: A prospect theory analysis”,
National Tax Journal, 52, 753–764.
Yitzhaki, S. (1974) “A note on income tax evasion: A theoretical analysis”, Journal of Public Economics, 3, 201–202.
Appendix
Tax rate 0.25 Skill spread in self-employment
0.75 Fine rate f 1.5 Weight in
information exchange
0.75 Audit rate r 0.1 Speed of adjustment
in social custom
0.5
Table 1: Parameters in baseline simulation
Distribution Mean St.dev.
Wage in employment w Log-normal[1.956,0.8325] 10 10 Earnings in occupation 1 y1 Log-normal[1.3785,1.1840] 8 14 Earnings in occupation 2 y2 Log-normal[1.0430,1.4813] 8.5 24
Skill factor x Uniform [0,1] 0.5 0.29
Risk aversion Uniform [0.1,5.1] 2.6 1.44
Initial belief on audit probability p0 Uniform[0,1] 2.6 1.44 Initial weight on social custom 0 Uniform[0,1] 2.6 1.44 Utility of honest declaration z Uniform [0,3E-5] 1.5E5 8.66E6