Achievement of Girls and Boys in Government Secondary Schools
of Wolaita Zone, Ethiopia
Maria Mekonnen Gejabo
Master of Art (MA), Educational Leadership and Management, WSU. Abstract
Education, in its broadest sense, may be defined as a process designed to inculcate the knowledge, skills and attitudes necessary to enable individuals to cope effectively with their environment. Its primary purpose is to foster and promote the fullest individual self-realization for all people. Achieving this goal requires understanding of commitment to the proposition that education is a primary instrument for social and economic advancement of human welfare. Therefore, the main objective of this study was to carry out an analysis of the achievement of girls and boys education in Wolaita zone government secondary schools. Multistage sampling method was used. First, stratified random sampling method was employed to select secondary schools from both urban and rural areas in different districts. Hence, two urban and three rural secondary schools were included in the study randomly. Secondly, from each stratum schools are selected using simple random sampling, lottery methods. Therefore, the schools included in the study are: Areka and Gununo secondary schools from urban schools, and Shanto, Hembecho and Gacheno secondary schools from rural schools. Thirdly, the respondents from each school were selected using systematic random sampling method. Both qualitative and quantitative research methods were employed to comparatively study the enrollment, achievement and attrition of female and male students in government secondary schools of Wolaita zone. The finding of the study reveals male students outperform their female counterparts in their academic achievement. Self-motivation and burden in household chores were found being the major reason for the difference in academic achievement. Generally females drop out of school in greater percentage compared to males in government secondary schools in the study area.It is recommended that continual awareness creation should be carried out so that families understand the importance of education.
Keywords: Achievement, Boys and Girs, Wolaita, Ethiopia. 1. INTRODUCTION
Education is the foundation for optimal utilization of resources through development of human capital. Investing in people's education can boost living standards of household by expanding opportunities, raising productivity, attracting capital, investment and increasing earning power (Kane, 2004). Education is the ultimate liberator, empowering people to make personal and social choices. It is also ultimate equalizer, particularly in promoting greater equity for women and for the poor and disadvantaged groups (Kane, 2004).
According to World Bank (2008), education plays an important role in promoting economic growth and social progress. Secondary education, in particular, is one of the key factors for increased economic growth and social development. Its graduates enter labor markets that increasingly demand “modern knowledge and skills, readiness to take initiatives, and ability to solve problems.” Meanwhile basic education especially helps to reduce poverty through its effects on population growth rate, health, and nutrition and by equipping people to participate in the economy and society. Education is a tool to enable both women and men to make all round participation in development process by acquiring knowledge, skill and attitudinal change (Kane, 2004).
As Leach et al (2003) states, in all countries women are increasingly impatient to widen the options for realizing their potential and to participate on equal basis with men in productive and creative achievements, as well as in the rewards' systems of their societies. But they do not participate fully in what gets done in society due to lack of education.
In order to play the critical role appropriately, women need education. The education of females in socio-economic programs depends on their educational back ground. Similarly, Kane (2004) argue that educating girls yields a higher rate of return than any other investment in the developing world.
Thus, girls must be treated equally with boys to attain educational qualification, which is necessary to increase their participation in different development programs. In addition, education is a human right enshrined in international treaties and conventions that are legally binding on signatory states. The most recent conventions contain the most comprehensive set of legally enforceable commitments on the rights of education and gender equality in UNESCO (2003). Since then schools have been urged to take and educate all children in the same way regardless of sex differences. However, gross differences in schooling prevail when data are disaggregated by gender. In many places around the world, girls receive much less schooling than boys (Schaffner, 2004).
The collective burdens of housework, child care and family pressure can often prevent the education of a child bride. “Education for girls is one of the best strategies for protecting them against child marriage, when
themselves and their families.
In African countries, especially in sub-Saharan Africa the education gap is very wide. According to Kane (2004), current trends in sub-Saharan Africa reflect a predictable pattern previously emerging in other regions (under less difficult circumstances), a widening of gender gaps, as enrollments increase from a very low base could be a temporary phenomenon. Still the exigency of helping girls remains clear. Of the close to 50% of African children are not enrolled in school, about two-thirds of them are girls.
Based on 1993/94 data of Ethiopia when the primary gross enrolment ratio (GER) was just 30 percent for boys and 19 percent for girls, it was predicted that in spite of recent enrolment increases, with no other changes to admission rates or to progression rates within the system. The gender gap in achievement widens as children progress through the education system, simultaneous with widening of the gender gap in enrolment. In 2009 only 29 percent of girls passed the grade 10 examination compared with 53 percent of boys; and 46 percent and 67 percent, respectively, passed the grade 12 examination (Yelfign, 2011). This suggests that greater attention needs to be paid to the gendered nature of the learning environment as children get older.
As a data of 2003/04 academic year female students' enrollment ratio of Southern Nations, Nationalities, Peoples Region (SNNPR) in secondary (9-10) accounted for 10.9%, (SNNPREB, 2013). This shows that the higher the level of education, the lower the female enrollment. The gross enrollment ratio at all levels in Wolaita
zone, which is the research area of the student researcher’s focus, was 54% for girls and 91% for boys for the
same year (SNNPREB, 2013)
This study attempted to look at all possible in puts that can contribute to the knowledge of the issue under consideration. It analyzed girls’ education in comparison with that of boys and their enrollment, achievement,
and attrition rates. Then will provide realistic clues for policymakers, decision makers and project planners about the present status of female students for the future reduction of the gender gap in Government secondary education in Wolaita zone.
Therefore, their full participation in development cannot be imagined unless they have the knowledge or required level of education. The constitution of the FDRE has guaranteed women equal rights with men. Several articles of the constitution relate to gender issues and show the emphasis placed on women. The Education and Training Policy of the Transitional Government of Ethiopia (MOE, 1994) has launched an educational program
with major emphasis on enhancing girls’ education through different means. Despite the policy; however, girls
and boys pattern of pupil; enrollment of females is still very low in the country, especially in the countryside or rural parts of Ethiopia. To identify if factors that affect girls and boys education in Wolaita zone government secondary schools.
2. METHODOLOGY
2.1.Description of the Study Area
Wolaita Zone is one of 14zones in Southern Nations, Nationalities and Peoples’ Region (SNNPR) of Ethiopia.
The capital of the Zone, Sodo town, is situated at 378 km to south of Addis Ababa city, the capital of Ethiopia. According to Central Statistical Authority (CSA, 2007) estimated population projection of the Zone is 1,796,578out of which 49.27 per cent are males and 50.73 per cent are females. The area is located between 6.47ºN-7.1ºN latitude and 37.40E – 38.10E longitude. Total area is 4383 Km2 (438,370 ha). The population density of the Zone is 445 persons per Km2. The average household size was 4.8.Regarding the education sector, in the zone in the 2012; there were about 26 secondary schools. 23,813 grade 9 and 19,001 grade 10 students were enrolled in the same year. Gender wise, 24,399 males and 18,415 females were enrolled in the government secondary schools of Wolaita zone(WZED,2012).
2.2 Research Design
Both qualitative and quantitative research methods were employed to comparatively study the enrollment, achievement and attrition of female and male students in government secondary schools of Wolaita zone. Hence mixed research design was applied. Because, biases inherent in any single method could neutralize/cancel the biases of other methods (Creswell, 2009).
2.3. Population and sample 2.3.1 Population
The total numbers of individuals to whom the results of the research are intended to apply constitute the research population (Oliver, 2004). The population for this study is all secondary school students who are attending their class in government schools of Wolaita zone, SNNPR, Ethiopia.
According to the Wolaita zone Education Department unpublished report, the total number of students who were enrolled in secondary schools of Wolaita zone in 2012 was 42,814. Out of which, 35704 students were enrolled in schools which have been operational for at least five years. In the same year, there were 23 (10 urban and 13 rural) government secondary schools in Wolaita zone. 882 and 177 male and female teaching staff
respectively was working in the aforementioned 23 schools. 2.3.2 Sampling technique
Multistage sampling method was used in this study. First stratified random sampling method was employed to select schools. Stratification was done to select secondary schools from both urban and rural areas in different districts.
To select the schools proportionally, the following proportional allocation formula was used (Frankfort-Nachmias and Nachmais, 2008)
Where,
= the population size for each stratum = the total population size
= the total sample size
= the sample size for each stratum
Then, using this formula the proportion will be (Number of schools from urban)=
po
=2.17 approximately 2 schools
(Number of schools from rural) =
=2.8 approximately 3 schools
Therefore, 2 urban and 3 rural secondary schools are included in the study randomly. From each stratum schools are selected using simple random sampling, lottery methods. Therefore, the schools included in the study are: Areka and Gununo secondary schools from urban schools, and Shanto, Hembecho and Gacheno secondary schools from rural schools.
Figure. 1: Flow chart for the sampling design
2.3.3 Sample Size Determination
Table 1: Distribution of sampled students by sex in respective schools
Male Female Total
Areka 40 45 85 Gacheno 31 30 61 Gununo 40 38 78 Himbecho 41 39 80 Shanto 33 30 63 Total 185 182 367 2.3.4 Sample size
Researchers are often faced with the question of how large a sample must be. Cohen and Manion (2001) assert that there is no clear cut answer to this question; the correct sample size depends on the purpose of the study and the nature of the population under study. The size of the sample depends on a number of factors which can include cost, time, administrative constraints Cohen and Manion (2001). However, different scholars have given different guidelines which researchers can follow when deciding the sample size. For instance Cohen and Manion (2001) asserts that the number of respondents accepted for a study depends on the type of research involved. He goes on saying that when a researcher is faced with making a choice between different factors such
as between the economy and convenience of small samples, reliability and representativeness of large samples, the best choice is to balance practical considerations against statistical power and generalizability. He stated that increasing sample size will increase the statistical power.
The population size and the percentage required for the different population sizes at the 95 percent confidence interval and 5 percent sampling error are shown in Table 3.2.
Table 2: Population, sample size and percentage required
Population Sample size Percentage required
10 10 100 20 19 95 50 44 88 100 80 80 250 152 61 500 217 43 1,000 278 28 2,500 333 13 5,000 350 7 10,000 370 4 Source: Hill (1998)
Based on the assumption given on the table above, the sample size for the student respondents was determined. The total number of students in the above five schools is 12451. From these students a total of 370, 4% students were selected from these 5 secondary schools using systematic random sampling methods. Seventy four respondents (37 boys and 37 girls) from each school using equal allocation methods were included in the study. The respondents from each school were selected using systematic random sampling method that allowed the student researcher to give equal chance for all students in the sampled schools (Frankfort-Nachmias and Nachmais, 2008).
The total number of teachers in the above five schools are 262. The teachers included in the sample were selected in the same fashion. That is there are 262 teachers and according to the table a total of 160, 61% teachers were included in the study. Based on equal allocation method 32 teachers were selected using simple random sampling methods from each school.
The respondents from zonal and woreda education office were selected using purposive sampling methods. Because (Frankfort-Nachmias and Nachmais, 2008) states that one can use such type of sampling method when
he/she believes special requirements can be met or “information rich” special groups are paramount.
2.4. Data Sources and Methods of Data Collection
Both qualitative and quantitative data were collected from primary and secondary sources. Quantitative data from primary sources were collected through interview schedule while qualitative data were collected through key informant interview, focus group discussions and personal observations. The relevant data were collected from 367. Sources of data Students related such as Age group, marital status, Religion, Average number of study hours, Average score, Family related, Father’s education status, Mother’s education status, School related, Teachers’ subject matter knowledge, attitude of teachers towards male and female students, and supervision of teachers
An interview schedule was prepared in English and translated into Amharic to ease communication during data collection. The student interview schedule was administered to 74(35 from grade 9 and 10 each) students.
As per the teachers’ interview schedule 35 from each school were administered. The data were collected in
March and April 2013. In due process, the lists of students and teachers were obtained from the record offices of the sample schools. And the randomly selected students and teachers were called up on to a place arranged by the school administration. The student researcher herself and/or her assistants were beside students and teachers being ready to render any help in the process of filling the interview schedule.
With regard to the interview, structured list of interview schedule were presented to Zonal and district education bureau administrators, and experts in this discipline. In due process, interview guides were prepared, and appointments were made by personal and telephone communication.
For the questionnaire, Pilot study was conducted by considering students and teachers in Sodo Secondary and Preparatory school, one of the government secondary schools of Wolaita zone, which was not going to be included in the main study. Twenty students and ten teachers were considered for the pilot survey, and it was done in March 2013.The researcher computed the reliability for multi-item opinion questions using SPSS version 21 computer software. The items were tested using Cronbach Alpha and it gave a reliability figure of 0.79 and
0.81 for the students’ and teachers’ interview schedule, which are above the recommended reliability of 0.7
(Kaplan and Saccuz, 1993; Nunnally and Bernstein, 1994). Based up on the feedback from students and teachers, improvements were made on the interview schedule with respect to wordings, item options and total number of
questions. Considering the interview, the student researcher did not delve into the details of pilot study. Because the entire interview schedule were more or less similar to those enlisted on the interview schedule, except that they are generalized into zonal and district levels and our respondents in this regard cannot have individuals on the same position.
3. RESULTS AND DISCUSSIONS 3.1. Characteristics of Students
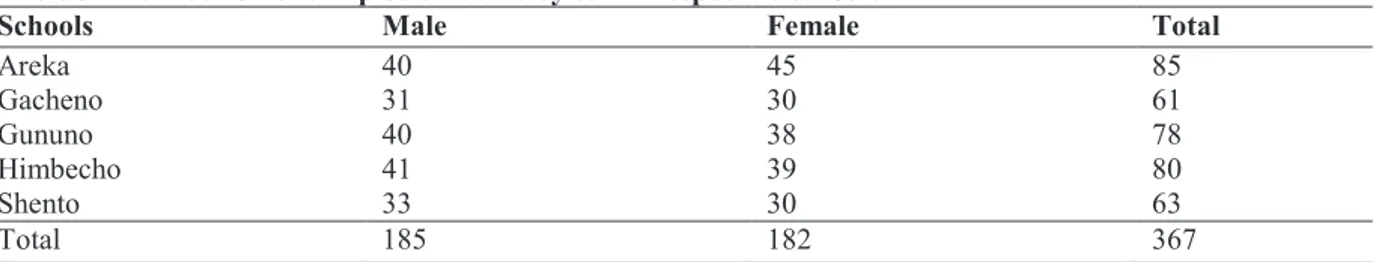
Summary of number of male and female students at each grade level and school is displayed in table 3.1. Almost equal numbers of female and male students were included in the sample (182 females and 185 males). Of course there exists discrepancy with respect to the percentage of students of both sexes taken from different schools due to response error. The highest number of students has taken from Areka, and least number of students has taken from Gacheno.
Table 3: Distribution of sampled students by sex in respective schools
Schools Male Female Total
Areka 40 45 85 Gacheno 31 30 61 Gununo 40 38 78 Himbecho 41 39 80 Shento 33 30 63 Total 185 182 367
Source: Field Survey, 2013
3.1.1 Age Distribution of students by gender
Most of both female and male students are between 15 and 17 years of age. Taking the age of 7 as a reference, almost 70% of the sample students have acceptable age range (15-17). Of course, we should note that about 20% are 18 years and above ( Table 4)
Table 4: Age Distribution of students by gender
Age group of the respondent Total
Gender 12-14 15-17 18-20 Above 20
Count 25 136 21 0 182
Female % Within Gender 13.7% 74.8% 11.5% 0 100
% Within Age 54% 54.8% 34.4% 0 49.6%
Male Count 21 112 40 12 182
% Within Gender 11.4% 60.5% 21.6% 6.5% 100
% Within Age 45.7% 45.2% 65.6% 100.0% 50.4%
Count 46 248 61 12 367
Total % Within Gender 12.5% 67.6% 16.6% 3.3% 100.0%
% Within Age 100% 100.0% 100.0% 100.0% 100.0%
Source: Field Survey, 2013
3.1.2 Marital Status of the respondent
The table above shows that around 95% of the sample students were singles, and the rest were all married. Hence, one can see that there are no divorced and widowed students.
Table 5: Marital Status of the respondent
Gender Frequency Per cent Valid per cent Cumulative per cent
Single 348 94.8 95.6 95.6
Married 16 4.4 4.4 100
Total 364 99.2 100
Missing 3 0.8 -
Total 367 100
Source: Field Survey, 2013
3.1.3 Teachers encourage male student’s more than female students
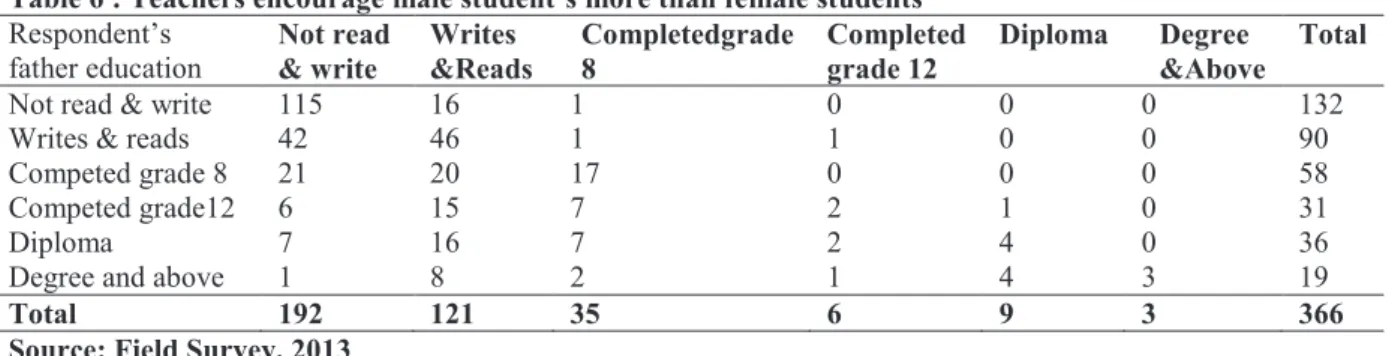
The educational status of the student- respondents’ fathers and mothers is summarized in the table ---. Only 15% of fathers and 3.3% of mothers have diploma and above qualification. It can also be observed that 85.3% and 60.7% mothers and fathers respectively at best know how to write and read. It must be mentioned here that among those mothers who have diploma and above, only one has a husband whose level of education is below
the diploma level. Generally, few of the students’ mothers were married to individuals whose level of education is below what they have attained. Highest numbers of students have asserted making parents aware of the
importance of education to be the first ranking activity that should be accomplished in order to increase students’
Table 6 : Teachers encourage male student’s more than female students Respondent’s father education Not read & write Writes &Reads Completedgrade 8 Completed grade 12 Diploma Degree &Above Total
Not read & write 115 16 1 0 0 0 132
Writes & reads 42 46 1 1 0 0 90
Competed grade 8 21 20 17 0 0 0 58
Competed grade12 6 15 7 2 1 0 31
Diploma 7 16 7 2 4 0 36
Degree and above 1 8 2 1 4 3 19
Total 192 121 35 6 9 3 366
Source: Field Survey, 2013
3.2. Ranking order by students, rate five possible factors that hinders
Highest numbers of students have asserted making parents aware of the importance of education to be the first
ranking activity that should be accomplished in order to increase students’ enrollment in high schools. All students were again asked to rate five possible factors which can increase the enrollment of students in the government secondary schools of Wolaita zone. Highest numbers of students have asserted making parents aware of the importance of education to be the first ranking activity that should be accomplished in order to
increase students’ importance in high schools.
Table 7: Teachers encourage male student’s more than female students
Rank Frequency Per cent Valid per cent Cumulative per cent
First 72 36 37.3 37.3 Second 65 32.5 33.7 71 Third 36 18 18.7 89.6 Fourth 20 10 10.4 100 Total 193 96.5 100 Missing 7 3.5 - Total 200 100
Source: Field Survey, 2013
Close to 70% students have claimed that making parents aware of the importance of education to be third or more ranked. Prohibiting early marriage (favored by 104 students) has been selected as the second ranking activity that should be done. Similarly, expanding schools at an average distance, giving more job opportunities for students who finish high school, and constructing living house and subsidizing their food supply cost have been ranked 3rd, 4th and 5th respectively.
Table 8: Making parents aware of the importance of education
Rank Frequency Percent Valid Percent Cumulative Percent
First 92 25.1 25.1 25.1 Second 88 24.0 24.0 49.0 Third 66 18.0 18.0 67.0 Fourth 72 19.6 19.6 86.6 Fifth 49 13.4 13.4 100.0 Total 367 100.0 100.0
Source: Field Survey, 2013
Table 9: Prohibiting early marriage
Rank Frequency Percent Valid Percent Cumulative Percent
First 76 20.7 20.7 20.7 Second 104 28.3 28.3 49.0 Third 54 14.7 14.7 63.8 Fourth 61 16.6 16.6 80.4 Fifth 72 19.6 19.6 100.0 Total 367 100.0 100.0
Source: Field Survey, 2013
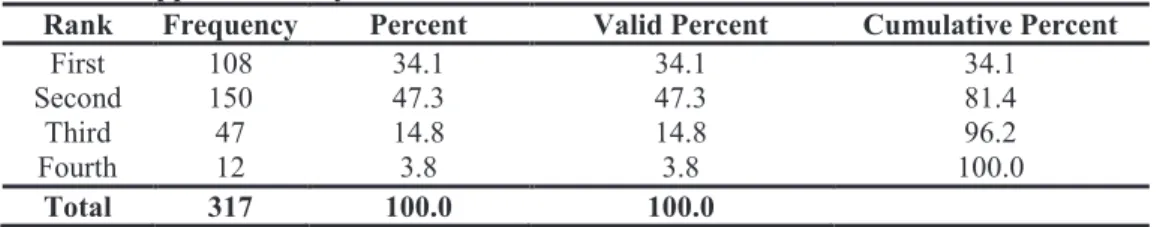
Self-motivation of the student was chosen to be the first ranking factor (favored by more than 47% of students). Selected by 47.3%, family support has become the second ranking factor. The third and fourth ranking factors are respectively encouragement by teachers (favored by 41%) and encouragement by peers (57.4%).
Table 10: Self Motivation
Rank Frequency Percent Valid Percent Cumulative Percent
Valid First 152 47.9 47.9 47.9 Second 75 23.7 23.7 71.6 Third 66 20.8 20.8 92.4 Fourth 24 7.6 7.6 100.0 Total 317 100.0 100.0
Source: Field Survey, 2013
Most of the sample students usually study in their home whether they are males or females. The other place where both sexes prefer for study purpose is school library. 92% of students use either school library or home as usual study place.
Table10: Support of family
Rank Frequency Percent Valid Percent Cumulative Percent
First 108 34.1 34.1 34.1
Second 150 47.3 47.3 81.4
Third 47 14.8 14.8 96.2
Fourth 12 3.8 3.8 100.0
Total 317 100.0 100.0
Source: Field Survey, 2013
3.3. Academic Achievement of Students
Average Mark of students in the first semester of 2005 E.C. academic year showed that males have performed better compared to females. The average mark of males has become 67.35 where as that of girls became 61.36. Table 11: Summary of marks with respect to gender
Mean Minimum Maximum Standard deviation
Males 67.35 47.6 93 10.39
Females 61.36 43 90.2 9.86
Source: Field Survey, 2013
Looking at the range of the marks, it becomes evident that females can achieve higher scores as males do. And the minimum mark obtained by girls is not that much lesser to that of boys. But majority of female students seem to have scored between 50 and 60, which can be judged based up on the average value and the range associated with it.
Sample students were asked whether males or females perform better, and their response coincides with the result on the sample data. More than 80% of students believe that males perform better in their academics. And only 19 out of 367 say that females outperform male students in their academic performance.
The sample student respondents who have earlier said male students outperform their female counterparts or vice versa have been further required to rank four possible factors which are thought to be major reasons behind.
3.3.1. Academic Achievement Perception
Sampled teachers were also required to state their attitudes towards statements which are deemed to be related
with students’ academic achievement. The following paragraphs give an idea about teachers’ attitude, based up on the Likert scale. The statement “Boys perform better than girls in secondary schools” was strongly disagreed
or disagreed by 34% of the teacher respondents; whereas, it was strongly agreed or agreed on by 58% of the teachers selected for the sample.
More than half (53.3%) of the teachers strongly disagreed on the statement “Girls are encouraged more than
boys to study at home when they reach secondary school”. Moreover, 16% of teachers disagreed on it. There exist only 18% respondents who strongly agreed or agreed on the statement. The statement “Teachers believe that females achieve better than males” was strongly disagreed or agreed by more than 40% of the respondents. Almost equal percentage of respondents strongly agreed or agreed on the statement.
Table 3.12: “Boys perform better than girls in secondary schools”
Rank Frequency Percent Valid Percent Cumulative Percent
Strongly disagree 48 28.7 28.7 28.7 Disagree 8 4.8 4.8 33.5 Indifferent 15 9.0 9.0 42.5 Agree 23 13.8 13.8 56.3 Strongly agree 73 43.7 43.7 100.0 Total 167 100.0 100.0
Source: Field Survey, 2013
3.3.2 Relationship between Gender and Academic Achievement
Generally 35.7% of sampled students have got low achievement. More than half of these students (54.7%) are medium achievers. Only 10% of them are found to be high achievers.
Gender wise classification of academic achievement shows that 60% of low achievers are females; whereas almost 70% of high achievers are male students. Greater percentages of medium achievers (53%) are also male students.
Table 13. Cross tabulation and Chi-Square Tests for the relationship between caring for siblings and gender
Gender Low Medium High Total
Male 54 106 25 185 Female 77 94 11 182
Total 131 200 36 367 Source: Field Survey, 2013
The predetermined significance value, 0.01 is less than the two-sided asymptotic significance value, 0.06. Because of this, there is significant relationship between gender and academic achievement at 0.01significance level.
The relationship is also strong since the symmetric measures value for all of the three tests is greater than 0.3. Directional measures value ascertain the strong relationship. All of the values indicate that there is at least 25% of reduction in misclassification.
3.3.3 Relationship between age group and academic achievement
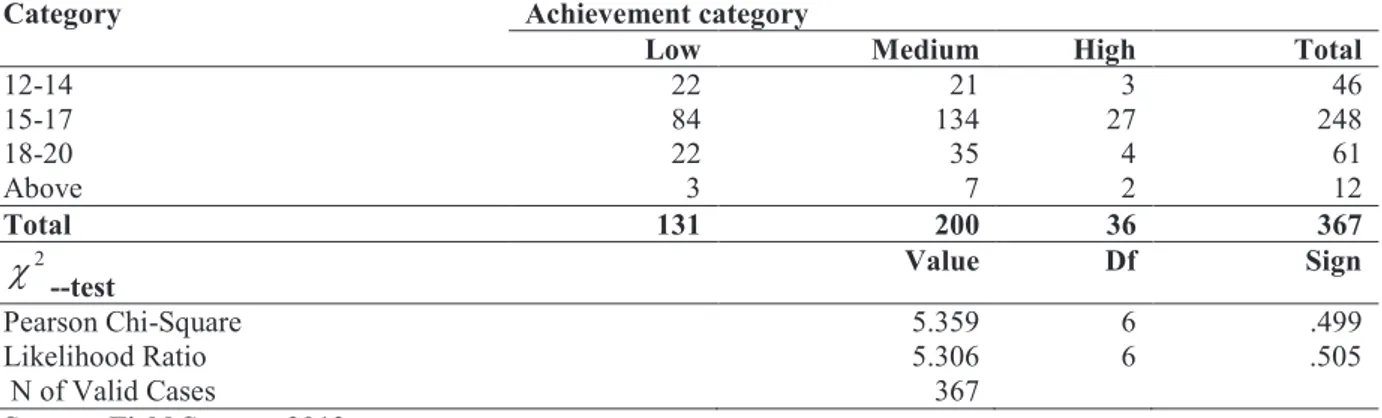
As most of the sampled students are in the age group of 15-17, majority of students are observed falling in this category for each and every group of academic achievement: 64% of low achieving students, 69% of medium achievers, and 75% high achieving students fall in this age group. The chi-square test shown above shows that the two sided asymptotic significance values, 0.499 and 0.505 are both greater than even 0.1, the maximum commonly applied predetermined significance value. The associated Chi-Square values are also very small taking into consideration the degree of freedom stated. This shows the non-significant relationship of age group with academic achievement. Hence, we conclude that difference in age group has no significant impact on academic achievement in government secondary schools of Wolaita zone.
Table 14. Cross tabulation and Chi-Square Tests for the relationship between age group and achievement category
Category Achievement category
Low Medium High Total
12-14 22 21 3 46 15-17 84 134 27 248 18-20 22 35 4 61 Above 3 7 2 12 Total 131 200 36 367 2
c
--test Value Df SignPearson Chi-Square Likelihood Ratio N of Valid Cases 5.359 5.306 367 6 6 .499 .505 Source: Field Survey, 2013
3.3.4 Relationship between marital status and academic achievement
None of the high achieving students are married. Apart from that most of low and medium achieving students are single.
The two sided asymptotic significance level for Pearson Chi-Square and Likelihood Ratio tests are 0.390
and 0.178. These values are greater than the smallest significance level, 0.1. Hence we don’t reject the null
other.
Table 15 Cross tabulation and Chi-Square Tests for the relationship between marital status and achievement category
Gender
Achievement category
Low Medium High Total
Single 125 187 36 348
Married 6 10 0 16
Total 131 197 36 364
2
c
--test Value Df SignPearson Chi-Square Likelihood Ratio N of Valid Cases 1.883 3.454 364 2 2 .390 .178 Source: Field Survey, 2013
3.3.5 Relationship between religion and academic achievement
Among low achieving students, 73.3% are Protestants followed by followers of Orthodox religion, 22.1%. Majority of medium achievers (80.5%) are also Protestants. Likewise 69.4% of high achieving students are Protestants. Of course, taking into consideration the total number of sampled students who appeared to be Protestants (282) it is expected that many number of students will be found in each category of academic achievement. Performance of student does not depend on religion. The Chi-Square analysis has resulted in two sided asymptotic significance value of 0.186 and 0.192 for Pearson & Likelihood ratio tests respectively, which are both greater than 0.1. Hence we don’t reject the null hypothesis of no association between religion and
academic achievement. Consequently, we conclude that at 10% significance level, religion and academic achievement have no significant relationship.
Table 16. Cross tabulation and Chi-Square Tests for the relationship between religion and achievement category
Achievement category
Religion Low Medium High Total
Orthodox 29 28 10 67
Protestant 96 161 25 282
Other 6 11 1 18
Total 131 200 36 367
2
c
--test Value Df SignPearson Chi-Square Likelihood Ratio N of Valid Cases 6.179 6.100 367 4 4 .186 .192 Source: Field Survey, 2013
3.3.6 Relationship between family permanent address and academic achievement
Majority of low achieving students (67.2%) have come from families whose permanent address is rural area. On the contrary, majority of high achieving students (61.1%) have come from families whose permanent residence is urban area. Pearson Chi-Square and likelihood ratio tests gave two-sided asymptotic significance values of 0.007 and 0.008 respectively. These values are less than a predetermined value of 0.01. Hence we reject the null hypothesis of no relationship between family permanent address and academic achievement. As a result, we conclude that family permanent address and academic achievement of government secondary schools students are related to each other.
Table 17. Cross tabulation and Chi-Square Tests for the relationship between family permanent address and achievement category
Achievement category
Family Permanent Address Low Medium High Total
Urban 43 84 22 149
Rural 88 114 14 216
Total 131 198 36 365
2
c
--test Value Df SignPearson Chi-Square Likelihood Ratio N of Valid Cases 9.813 9.764 365 2 2 .007 .008 Source: Field Survey, 2013
4. CONCLUSIONS AND RECOMMENDATIONS 4.1 Conclusions
Female students constitute only 40% of secondary schools enrollments. Of course enrollment of students in Wolaita zone government secondary schools has been increasing from year to year in the last five years. Gender disparity has also been decreasing from time to time. A number of factors have been observed having effect on
enrollment, achievement and attrition of students concurrently. Of course, this shouldn’t be taken as a surprise
since these three educational parameters are very strongly intertwined. Making parents aware of the importance
of education has been found to be the prominent task that should be accomplished in order to increase students’
enrollment. Prohibiting early marriage, expanding schools at an average distance, giving more job opportunities for those who finish secondary school, and constructing living house and subsidizing their food supply cost, in their respective order, have also been put forward.
Male students outperform their female counterparts in their academic achievement. Self-motivation and burden in household chores were found being the major reason for the difference in academic achievement. Also discovered are family support, societal attitude, encouragement by teachers and encouragement by peers. Generally females drop out of school in greater percentage compared to males in government secondary schools of Wolaita zone.
Marked difference has been observed in the rating of male and female students with regard to the factors attributed for attrition. Prominent factor for the attrition of female students was found to be early marriage; whereas male students usually drop out of school because of lack of family support and/or shortage of money.
Generally, few of the students’ mothers are married to individuals whose level of education is below what they have attained. It’s the student researcher view that additional detail analysis should be carried out to check
whether this has been coincidental or it is in line with the well known “Educating women is educating a country”
expression of Kofi Annan, former secretary of the United Nations. 4.2.Recommendations
Based on the findings of the study the following recommendations are made for improving students’ achievement in general and females’ in particular.
First, it is of utmost importance to take note of the fact that the findings pinpoint certain areas requiring priority to narrow the existing gap with respect to attrition, and achievement of girls and boys in government secondary schools of Wolaita zone. Besides, the rigorous and continual awareness creation should be carried out so that families understand the importance of education.
Second, the government at large should pace against time in its endeavor of constructing new secondary schools at an average distance, and undertaking of expansion on existing ones. Because, relatively much larger percentage of students are going to finish their primary education, thanks to the government’s massive universal
education access program, and will demand access to secondary education. This may in turn, unless acted up on, create decrement in gender parity, let alone making progress on whatever has been achieved. However, cumbersome it may be, every stakeholder in education arena should march towards making families understand that formidable sharing of responsibility for both male and female children with respect to household chores is a must. Because this will give female students more spare time to study, and will give them the opportunity to obtain higher academic results.
Third, further gender specific researches should be undertaken to assess the reasons for attrition of male and female students. Because in this study male and female students have reported unusually different ranking of the factors attributed for this education parameter.
5. REFERENCES
Cohen, L,.and Manion, L,.2001 Resaerch in Education, Theory and Practice . Didsbury School of Education, Manchester Metropolitan University, UK.
Creswell, John W, 2009. Research design: Qualitative, Quantitative and Mixed method aproachs, 3rd edition, Sage Publication, Inc.
CSA, 2007. Population and housing census of Ethiopia, A.A.http://www.csa.org. July 2007
EMOE, 1994. Ethiopian Ministry of Education. Education and Training Policy of Transitional Government of Ethiopia.
Frankfort-Nachmias, C. and Nachmias, D. (2008) Research Methods in the Social Sciences. 7th Edition, Worth, New York.
Kane, E, 2004. Girls Education in Africa: What Do we know about Strategies?
Kaplan, R. M., and Saccuzzo, D. P.(1993). Psychological testing (3rd ed). Pacific Grove, CA: Brooks/ Cole. Karin Hyde,Dehab Belay, Asegedech Beyene, Anbesu Biazen, Nuri Kedi, 2005 : Taking Stock of Girls'
Education in Ethiopia: Preparing for ESD P III. Ethiopian School Development Program III. Addis Ababa Ethioia.
Leach, Fiona et al. 2003. An Investigative Study of the Abuse of Girls in African Schools. Policy Division of the Department for International Development: London.
Nunnally, J. C., and Bernstein, I. H. (1994). Psychometric theory (3rd ed). New York: McGraw-Hill.
Oliver, M. 2004: If I Had a Hammer’, in j. Swain et. al., (eds.), Disabling Barriers: Enabling Environments, London: Sage.
Subrahmanian, R. 2004. Promoting Gender equality in Black,R and White, H(eds) UNESCO, 2003. Report on State Education in Africa: Challeges and Reconstraction.
World Bank, 2008. Gender equity in Junior and Senior Secondary Education. Working Paper, 14.
Yelfign Worku, 2011. Study on primary school female participation and performance in Cheha district. Research Series Vol. 1 - 2011
WZED, 2012. Wolaita Zone Educatinal Department. Data Processing and Dessimenation Work Process. Wolaita Ethiopia.