University of Nebraska - Lincoln
DigitalCommons@University of Nebraska - Lincoln
Cornhusker Economics Agricultural Economics Department
2014
2014 Nebraska Farmland Values and Rental Rates
Jim Jansen
University of Nebraska-Lincoln Roger K. Wilson
University of Nebraska-Lincoln
Follow this and additional works at:http://digitalcommons.unl.edu/agecon_cornhusker
This Article is brought to you for free and open access by the Agricultural Economics Department at DigitalCommons@University of Nebraska Lincoln. It has been accepted for inclusion in Cornhusker Economics by an authorized administrator of DigitalCommons@University of Nebraska -Lincoln.
Jansen, Jim and Wilson, Roger K., "2014 Nebraska Farmland Values and Rental Rates" (2014).Cornhusker Economics. 676. http://digitalcommons.unl.edu/agecon_cornhusker/676
July 2, 2014
University of Nebraska–Lincoln Extension
Cornhusker
Economics
Institute of Agriculture & Natural ResourcesDepartment of Agricultural Economics http://agecon.unl.edu/cornhuskereconomics Follow us on Twitter and Facebook @UNLAgEcon
2014 Nebraska Farmland Values and Rental Rates
Market Report Year Ago 4 Wks Ago 6/27/14 Livestock and Products,
Weekly Average
Nebraska Slaughter Steers,
35-65% Choice, Live Weight. . . . 121.47 143.09 155.27 Nebraska Feeder Steers,
Med. & Large Frame, 550-600 lb. . . 174.19 ⃰⃰ 277.00 Nebraska Feeder Steers,
Med. & Large Frame 750-800 lb. . .. . 148.96 ⃰⃰ 227.50 Choice Boxed Beef,
600-750 lb. Carcass. . . 197.64 233.44 244.39 Western Corn Belt Base Hog Price
Carcass, Negotiated. . . .. 99.86 108.72 125.44 Pork Carcass Cutout, 185 lb. Carcass
51-52% Lean. . . 108.91 115.46 130.85 Slaughter Lambs, Ch. & Pr., Heavy,
Wooled, South Dakota, Direct. . . 117.50 156.00 146.00 National Carcass Lamb Cutout
FOB. . . 286.58 361.04 358.48
Crops,
Daily Spot Prices
Wheat, No. 1, H.W.
Imperial, bu. . . 6.52 6.38 6.66 Corn, No. 2, Yellow
Nebraska City, bu. . . . 6.77 4.43 4.32 Soybeans, No. 1, Yellow
Nebraska City, bu. . . .. . . 15.71 14.81 14.18 Grain Sorghum, No.2, Yellow
Dorchester, cwt. . . 11.50 7.70 7.61 Oats, No. 2, Heavy
Minneapolis, Mn, bu. . . 4.26 4.09 3.76
Feed
Alfalfa, Large Square Bales, Good to Premium, RFV 160-185
Northeast Nebraska, ton. . . ⃰⃰ 220.00 192.50 Alfalfa, Large Rounds, Good
Platte Valley, ton. . . 200.00 120.00 ⃰⃰ Grass Hay, Large Rounds, Good
Nebraska, ton. . . .. . . . 200.00 105.00 ⃰⃰ Dried Distillers Grains, 10% Moisture
Nebraska Average. . . 232.00 185.00 145.00 Wet Distillers Grains, 65-70% Moisture
Nebraska Average. . . 85.00 57.00 65.00
⃰ No Market
The recently published Nebraska Farm Real Es-tate Market Highlights 2013-2014 report indi-cates as of February 1, 2014 the weighted aver-age farmland value for the state rose by about 9 percent over the prior 12-month period to $3,315 per acre (Figure 1 on page 2 and Table 1 on page 3). Also, 2014 cash rental rates on average de-clined across Nebraska for dryland and irrigated cropland; while pasture and cow-calf pair rental rates significantly increased (Table 2 on page 4). Survey panel members indicated lower grain prices as the most negative factor influencing cropland rental markets and cattle prices as the most positive factor leading into record setting cow-calf pair rental rates.
Since February 1, 2013 the largest percent in-crease in land value for Nebraska reported by survey participants occurred in hayland and graz-ing land (nontillable) classes at 26 and 24 percent respectfully. These two types of land are the pri-mary classes that service the forage requirements of cow-calf producers in the state. Percent in-crease in value of these two land classes were generally greater than 30 percent for districts lo-cated in the western two-thirds of the state. Sur-vey panel members indicated a very bullish out-look for future increases on the value of hayland and grazing land as many anticipate the prices of cattle to remain steady.
Changes in the value of dryland cropland in Ne-braska also followed general trends observed for hayland and grazing land. Changes across the eastern third of Nebraska were generally less than 10 percent, whereas the western two-thirds generally ranged from about 20 to 30 percent.
Extension is a Division of the Institute of Agriculture and Natural Resources at the University of Nebraska–Lincoln cooperating with the Counties and the US Department of Agriculture. University of Nebraska Extension educational programs abide with the non-discrimination policies of the University of Nebraska–Lincoln and the United States Department of Agriculture.
In the prior two to three years of the survey report, the increase in the value of dryland cropland has general-ly ranged between 20 to 30 percent for the eastern three districts. Survey panel members indicated one of the biggest concerns for dryland cropland (irrigation potential) is restrictions on developing ground water for irrigation. Future changes in the value of this land class will likely be tied to ground water policies guid-ing future irrigation development.
Center pivot and gravity irrigated cropland for Ne-braska increased an average of 6 and 3 percent re-spectfully over the prior 12-month period. The largest positive changes in irrigated land values occurred in the Northwest, North, Central, and Southwest Dis-tricts. The other districts recorded small changes in the value of irrigated cropland in 2014 suggesting the market is holding steady given current commodity prices and expectations. According to panel members, the center pivot and gravity irrigated land classes have the greatest estimated value of all of the land classes due to the revenue typically associated with this ground.
The current economic state of the grain and beef in-dustry across Nebraska is being reflected in the changes in agricultural land rental rates. Anticipated lower grain prices for crops harvested in 2014 reduce profit margins for dryland and irrigated cropland. As a result, cropland rental rates declined about 5 to 15 percent on average from the record high set in 2013. Several instances exist where rental rates did increase over 2013 averages, but overall rental rates declined across Nebraska for cropland. Panel members report-ed strong pasture and cow-calf pair rental rates corre-lating with higher cattle prices. Cases where pasture
rental rates decreased may reflect lingering effects of the drought and the resulting lowering of stock-ing rates.
Survey results shown and discussed in this report are findings from the University of Nebraska– Lincoln 2014 Nebraska Farm Real Estate Market Survey. Land values and rental rates presented in this report are averages of survey panel members’ responses by district. Actual land values and rental rates may vary depending upon the quality of the parcel and local market for an area. Complete re-sults from the survey are available electronically via the Nebraska Farm Real Estate website:
agecon.unl.edu/realestate
Land appraisers, farm managers, or agricultural fi-nance professionals from Nebraska interested in participating in future Nebraska Farm Real Estate Market Surveys are invited to contact the Depart-ment of Agricultural Economics at the University of Nebraska–Lincoln. Interested parties can directly contact the Agricultural Economics Department by phone: (402) 472-3401 or email: agecon@unl.edu Jim Jansen, (402) 472-3401
Extension Educator
Cedar and Knox County Extension University of Nebraska-Lincoln jjansen4@unl.edu
Roger Wilson,
Budget Analyst Farm Management Dept. of Agricultural Economics University of Nebraska-Lincoln rwilson6@unl.edu
Table 1. Average Reported Value of Nebraska Farmland for Different Land Types and Sub-State Regions, February 1, 2014a
Type of Land
Agricultural Statistics District
Northwest North Northeast Central East Southwest South Southeast Statec
Dollars Per Acre -Dryland Cropland (No Irrigation Potential)
$/acre 845 1,720 6,430 3,490 6,575 1,965 3,490 5,425 3,730
% change 21 49 7 33 -2 28 8 10 11
Dryland Cropland (Irrigation Potential)
$/acre 935 2,390 7,215 4,910 7,545 2,035 5,090 7,100 5,240
% change 28 24 2 24 2 23 22 8 7
Grazing Land (Tillable)
$/acre 550 1,150 4,075 2,300 3,620 890 2,430 3,285 1,390
% change 29 10 14 11 7 34 34 3 14
Grazing Land (Nontillable)
$/acre 405 625 2,490 1,670 2,500 805 1,775 2,170 865
% change 9 25 35 28 12 41 29 16 24
Hayland
$/acre 1,025 1,660 2,915 2,350 3,280 1,545 2,350 2,515 1,965
% change 31 44 11 27 -1 33 31 22 26
Gravity Irrigated Cropland
$/acre 3,040 4,215 7,455 8,065 8,750 4,515 7,290 8,330 7,310
% change 6 36 -5 17 -1 17 3 8 6
Center Pivot Irrigated Croplandb
$/acre 3,770 4,985 8,855 8,940 9,860 5,750 8,440 9,760 7,685
% change 21 -5 2 10 -2 11 1 4 3
All Land Averagec
$/acre 855 1,220 6,460 4,195 7,285 1,985 4,815 6,185 3,315
% change 20 20 4 18 0.3 12 9 8 9
Source: a UNL Nebraska Farm Real Estate Market Surveys, 2013 and 2014. b Value of pivot not included in per acre value.
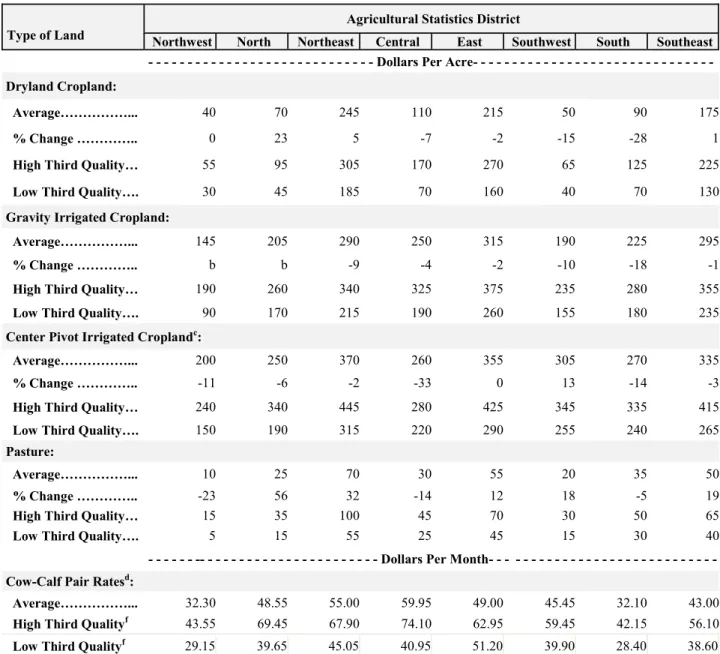
Table 2. Reported Cash Rental Rates for Various Types of Nebraska Farmland and Pasture: 2014 Averages, Percent Change from 2013 and Quality Ranges by Agricultural Statistics Districta
Type of Land
Agricultural Statistics District
Northwest North Northeast Central East Southwest South Southeast
Dollars Per Acre -Dryland Cropland:
Average………... 40 70 245 110 215 50 90 175
% Change ………….. 0 23 5 -7 -2 -15 -28 1
High Third Quality… 55 95 305 170 270 65 125 225
Low Third Quality…. 30 45 185 70 160 40 70 130
Gravity Irrigated Cropland:
Average………... 145 205 290 250 315 190 225 295
% Change ………….. b b -9 -4 -2 -10 -18 -1
High Third Quality… 190 260 340 325 375 235 280 355
Low Third Quality…. 90 170 215 190 260 155 180 235
Center Pivot Irrigated Croplandc:
Average………... 200 250 370 260 355 305 270 335
% Change ………….. -11 -6 -2 -33 0 13 -14 -3
High Third Quality… 240 340 445 280 425 345 335 415
Low Third Quality…. 150 190 315 220 290 255 240 265
Pasture:
Average………... 10 25 70 30 55 20 35 50
% Change ………….. -23 56 32 -14 12 18 -5 19
High Third Quality… 15 35 100 45 70 30 50 65
Low Third Quality…. 5 15 55 25 45 15 30 40
- - - -- - - Dollars Per Month- - - - - - Cow-Calf Pair Ratesd:
Average………... 32.30 48.55 55.00 59.95 49.00 45.45 32.10 43.00
High Third Qualityf 43.55 69.45 67.90 74.10 62.95 59.45 42.15 56.10
Low Third Qualityf 29.15 39.65 45.05 40.95 51.20 39.90 28.40 38.60
Source: a Reporters’ estimated cash rental rates (both averages and ranges) from the UNL Nebraska Farm Real Estate Market
Survey, 2013 and 2014.
b Insufficient number of reports in 2013 to calculate percent change to 2014 rental values. c Cash rents on center pivot land assumes landowners own total irrigation system.
d A cow-calf pair is typically considered to be 1.25 to 1.30 animal units (animal unit being 1,000 lb. animal). However,
this can vary depending on weight of cow and age of calf.