Labour efficiency on-farm
O’Brien, B.
1, Gleeson, D.
1, O’Donovan, K.
2, Ruane, D.
2, Kinsella, J.
2, Mee, J.F.
1,
Boyle, L.
1and McNamara, J.
31
Teagasc, Moorepark Dairy Production Research Centre, Fermoy, Co.Cork.
2
School of Agriculture, Food Science and Veterinary Medicine, University College
Dublin, Belfield, Dublin 4.
3
Teagasc, Specialist Service, Kildalton, Co. Kilkenny.
Part 1:
Labour utilisation associated with the milking process on
Irish dairy farms and work routine times within the
milking parlour
Introduction
Improvements in milking efficiency have a greater influence than any other aspect of the dairy farmers work on overall farm labour inputs (Whipp, 1992). In order to facilitate the examination of milking process labour inputs, the milking process may be divided into the following three components: herding pre and post milking (transfer of cows to and from the milking parlour); milking (milking tasks / work routines within the parlour); and washing (washing of milking machine and yard). Meanwhile, within milking specifically, the number of cows milked per operator per hour is the best measure of both the performance of the operator and the milking installation (Clough, 1978). This is affected by the following three factors: the milking times of the cows, the number and arrangement of the milking units, and the operator’s work routine (Whipp, 1992). The addition of extra milking units will only increase milking performance if the operator has idle time during milking (Hansen, 1999).
A number of studies have quantified the labour input required by the milking process. Hansen (1999) identified the milking process as the most time consuming task in most Danish dairy enterprises. Chang et
al. (1992) showed that the labour input for milking accounted for over 50% of the daily labour inputs on
US dairy farms. Schmidt and Johnston (1997) also showed that the milking process consumed over half of the working day in 40% of Australian dairy herds. Meanwhile, Whipp (1981) stated that 38% of total work time in English herds was associated with milking.
Technology has focussed on the task of milking due to its high labour requirement and has had a significant effect on the number of cows that can be managed by one person. Armstrong et al. (1994) have identified the level of mechanisation as a key factor in influencing the efficiency and quality of milking and in reducing the number of operators required for that task. Whipp (1981) has also stated that milking parlour developments have been a major factor in improved milking efficiency. Specifically, the number of person-minutes associated with each cow has been significantly reduced following mechanisation across a range of individual milking tasks (Whipp, 1992). An Australian study by Kompas and Nhu Che (2006) showed that one of two key determinants of differences in dairy farm cost efficiency were related to technology in the milking parlour.
With herd sizes increasing on Irish farms, much debate has surrounded issues such as the appropriate number of milking units and operator work routines. For example, Smith et al. (1998) have found that implementing a pre-milking routine increased labour requirements during milking, while Klindworth (2000a) has claimed that the maximum number of units that one person could comfortably handle is about 20, again depending on the work routines in place. A more recent study by Pocknee (2003) on expanding UK farms found that new parlour size was dependent on the size of the farm and that there was no relationship between parlour size and factors such as the number of dairy staff and the level of automation.
As the work associated with cows should be made sufficiently interesting and rewarding to encourage potential successors, shorter working hours, better working conditions and higher salaries should be accompanied by a focus on the role of the operator in the milking parlour. In view of the
proposed increases in scale necessary to maintain competitiveness in the future, potential milk production levels should also be considered when designing milking parlours (Klein and Hakim, 1994). The objective of this study was to evaluate labour utilisation related to the different stages of the milking process (herding, milking and washing up) and to examine the effects of work routines within the milking parlour.
Materials and methods Labour associated with the milking process on Irish dairy farms
The study was conducted with full-time dairy farmers who had a business size of at least 135 x103 litres of milk quota per annum and predominantly with a spring calving system. A population of 360 dairy farms was selected initially from more than 20 discussions groups. This population represented an estimated 1.6% of Irish dairy farms and 3.2% of milk production in Ireland. Members of discussion groups were chosen to form the study population in accordance with the following criteria: (1) a pre-existing relationship with the research organisation in terms of farm extension; (2) membership of discussion groups implying an interest in farm development and therefore a possible commitment to the year-long data recording process; and (3) members were likely to be full-time farmers.
Farmers were informed of the forthcoming study and invited to participate. A total of 143 farmers (including those with spring and autumn calving systems) opted to participate fully in the study in year 1. The final sample size used in the examination of the milking process was 171 farms, representing a total of 98 farms and 73 farms in years 1 and 2, respectively. This sample contained only spring calving herds for which complete time records were available. Thus, herds with an element of autumn-calving and farms with incomplete monthly records were excluded. Farms were grouped in small, medium and large herd size groups of <50 cows, 50-80 cows and >80 cows, respectively. In year 1 there were 29, 45 and 24 farms in the small, medium and large herd size groups, with average herd sizes of 44, 62 and 145 cows and average milk quotas of 232, 300 and 734 x103 litres, respectively. In year 2 there were 22, 33 and 18 farms in the small, medium and large herd size groups, with average herd sizes of 44, 62 and 149 cows and average milk quotas of 234, 293 and 755 x103 litres, respectively.
Two data recording methods were used. The main recording method involved a timesheet on which the total time consumed by each of the milking process tasks (herding cows pre-milking, milking, yard and machine cleaning and herding cows post-milking) was recorded, for each of 3 consecutive days on one occasion per month. As a single sheet was completed for each farm, the total time contributed by all operators was recorded. The second method was based on the continuous timing method (Armstrong and Quick, 1986) and involved an electronic data logger using the Observer behavioural package (Noldus Information Technology). Using the data logger method, the total time consumed by the milking process tasks was recorded for each individual operator, for each of 5 consecutive days on one occasion per month.
Work routine times within the milking parlour
In order to collect more detailed work routine times (WRTs) for milking, a controlled case study experiment was set up, whereby, WRTs were recorded for different milking activities in the research milking facility at Moorepark Dairy Research Centre on a 70 cow herd. One operator milked the herd in a unit, parallel, mid-level parlour, with swing-over arms, automatic feeding and sequential bailing. A 14-unit system was chosen as this number matched the size of parlour (between 12 and 15 14-units) which participant farmers felt could be operated by a single operator while also allowing a herd size in excess of 100 cows. Automatic cluster removers were in place and these could be switched on or off as required.
WRT measurements were taken of a full range of milking activities over the May/June period, when cows were yielding an average of 27.4 kg per day.
The WRT elements recorded were as follows: (i) time spent outside the milking pit herding cows into the parlour; (ii) cow entry and exit; (iii) washing of teats; (iv) drying of teats; (v) washing and drying of teats as one task; (vi) drawing of foremilk; (vii) dry wiping of teats; (viii) attachment of clusters; (ix) detachment of clusters; (x) changing of clusters (removal and attachment); (xi) post-disinfection of teats; (xii) washing of cow standing areas; (xiii) washing of clusters; (xiv) attachment of wash-cups.
Each measurement incorporated the time taken to complete the WRT element for a full row of cows. Work routine times per cow were then calculated by dividing this time by the number of cows in the row. Measurements were taken for 50 rows (observations) in total (5 rows for each of 10 milkings) for all tasks except washing of clusters and attaching wash cups, as this pair of tasks occurred only once at each milking. Recordings were taken at subsequent morning and evening milkings for 5 days. Cows were at pasture during the period of measurement. A hand-held data logger was used for data recording by a member of the research team.
Statistical analysis
The labour input data from farms were analysed using a repeated measures model (PROC MIXED), described below using the statistical procedures of SAS (SAS, 2002). Farm was included as a random effect while year, month and herd size group were included as fixed effects along with a range of milking characteristics, such as milking units and parlour type. Data of the WRTs within the parlour were converted electronically into Excel worksheets and analysed using the SAS statistical package (SAS, 2002). The ‘Proc GLM’ method of analysis of variance was used to test for significance of the different variables, such as time of day, with regard to the various work routine elements.
Results The milking process on commercial farms
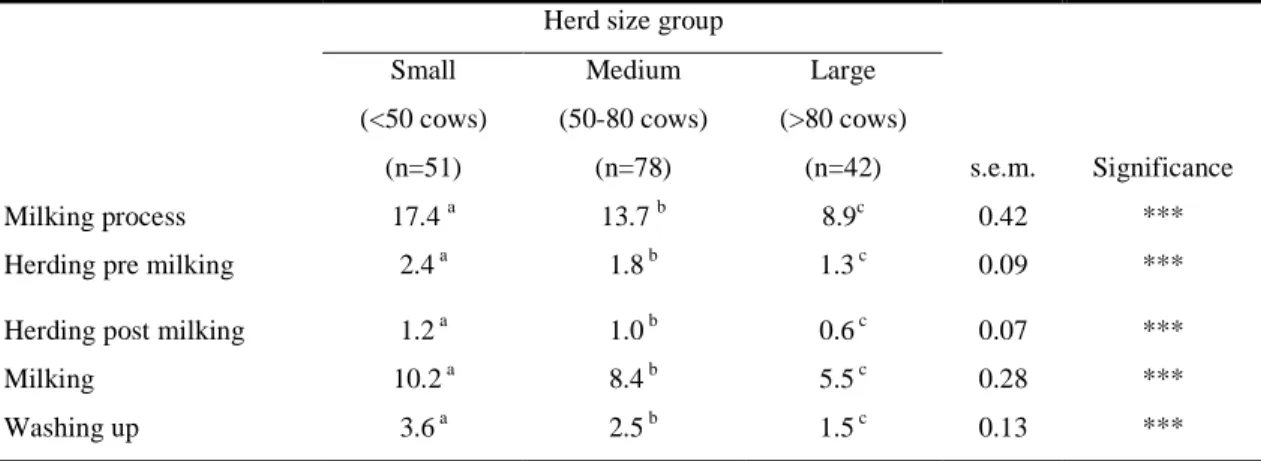
The average annual labour input per cow used in the milking process on commercial farms over two years was 13.6 h (±4.4 h) per day (av. herd size=77.4 cows, av. quota = 388 x103 litres). Annual labour input per cow to the milking process tasks (herding pre-milking, herding post-milking, milking and washing-up) on farms of three different herd size groups is shown in Table 1.
Table 1. Annual labour input per cow (h) to the milking process tasks on small, medium and large farms (n=171)
Herd size group Small (<50 cows) Medium (50-80 cows) Large (>80 cows) (n=51) (n=78) (n=42) s.e.m. Significance Milking process 17.4 a 13.7 b 8.9c 0.42 ***
Herding pre milking 2.4 a 1.8 b 1.3 c 0.09 ***
Herding post milking 1.2 a 1.0 b 0.6 c 0.07 ***
Milking 10.2 a 8.4 b 5.5 c 0.28 ***
Washing up 3.6 a 2.5 b 1.5 c 0.13 ***
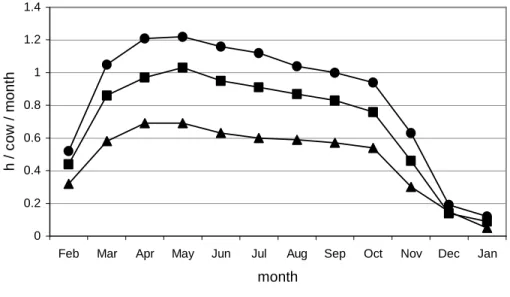
Annual labour input per cow (h) for all milking process tasks decreased with increasing herd size. Average milking labour input per cow per month (h) over 12 months on small, medium and large farms Variation in labour input per day (h) for all in-parlour milking tasks across months on farms of three different herd size groups is shown in Figure 1. Labour input to milking increased rapidly between February and April, before peaking in May, and steadily declining over the remainder of the summer and autumn before decreasing rapidly between October and January, thus closely following milk yield profiles. Similar trends across months were found in the three herd size groups. Month, herd size group and month*herd size group all had a significant effect (P<0.001) on all four milking process tasks. Labour input to herding pre-milking remained relatively stable (increased slowly) between March and October and decreased rapidly in the November/December period, in line with drying-off of the herd. Labour input to herding post-milking fluctuated greatly across months on small and large farms, while remaining stable on medium farms. This was most likely due to the possibility of the herd travelling directly to paddocks after milking at different times of the year. Labour input to washing showed minor fluctuations across the spring, summer and autumn periods, before decreasing rapidly between October and January.
0 0.2 0.4 0.6 0.8 1 1.2 1.4
Feb Mar Apr May Jun Jul Aug Sep Oct Nov Dec Jan month h / c o w / m o n th
small (<50 cows) medium (50-80 cows) large (>80 cows)
Figure 1. Average milking labour input per cow per month (h) over 12 months on small, medium and large farms (n=171)
Work routine times within the milking parlour
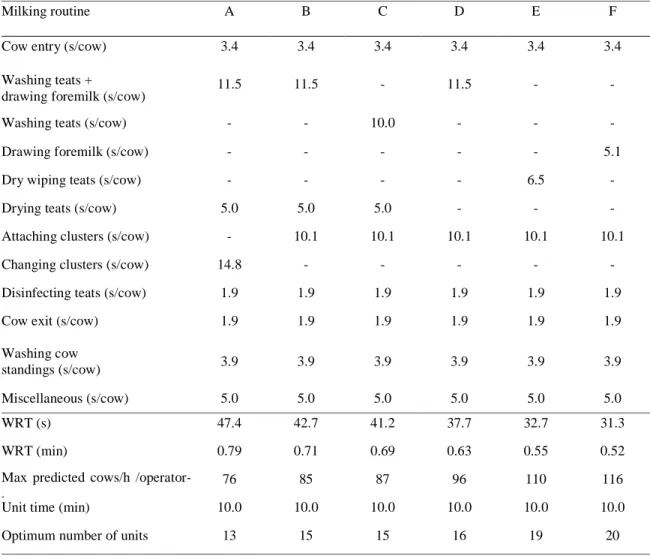
The time associated with different elements of milking work routines together with the predicted number of cows that could be milked per operator-hour with a range of different work routines and the optimum number of milking units for different milking routines (based on a unit time of 10 min) is shown in Table 2. As various elements of the work routine were automated or excluded, WRTs and row times decreased while the number of cows milked per operator-hour increased. WRT A involved cow entry, washing teats and drawing foremilk as a combined task, drying teats, changing clusters, disinfecting teats, washing cow standings and cow exit. A standard 5 s for miscellaneous events was allowed within each routine. WRT A allowed for a maximum predicted milking performance of 76 cows per operator-hour to be milked. WRT B assumed that
ACRs were in place, thus eliminating cluster removal and including cluster attachment. WRT B allowed a maximum predicted milking performance of 85 cows per operator-hour. Predicted milking performance per operator hour increased to 87 cows per operator-hour when the task of drawing foremilk was excluded from the routine (WRT C). Predicted milking performance increased to 96 cows per operator-hour when the routine included washing of teats and drawing of foremilk but excluded teat drying (WRT D). In WRT E all teat preparation tasks were excluded except for dry wiping of teats. This allowed a predicted milking performance of 100 cows per operator-hour to be achieved. When all teat preparation practices except drawing of foremilk were excluded (WRT F), the predicted number of cows milked per operator-hour increased to 116. The optimum number of units ranged from 13 to 20 depending on the WRT.
Table 2. Time associated with different elements of milking work routines together with the predicted
number of cows that could be milked per operator-hour with a range of different work routines and the optimum number of milking units for different milking routines (based on unit times)
Milking routine A B C D E F
Cow entry (s/cow) 3.4 3.4 3.4 3.4 3.4 3.4
Washing teats +
drawing foremilk (s/cow) 11.5 11.5 - 11.5 - -
Washing teats (s/cow) - - 10.0 - - -
Drawing foremilk (s/cow) - - - 5.1
Dry wiping teats (s/cow) - - - - 6.5 -
Drying teats (s/cow) 5.0 5.0 5.0 - - -
Attaching clusters (s/cow) - 10.1 10.1 10.1 10.1 10.1
Changing clusters (s/cow) 14.8 - - - - -
Disinfecting teats (s/cow) 1.9 1.9 1.9 1.9 1.9 1.9
Cow exit (s/cow) 1.9 1.9 1.9 1.9 1.9 1.9
Washing cow
standings (s/cow) 3.9 3.9 3.9 3.9 3.9 3.9
Miscellaneous (s/cow) 5.0 5.0 5.0 5.0 5.0 5.0
WRT (s) 47.4 42.7 41.2 37.7 32.7 31.3
WRT (min) 0.79 0.71 0.69 0.63 0.55 0.52
Max predicted cows/h /operator-hour
76 85 87 96 110 116
Unit time (min) 10.0 10.0 10.0 10.0 10.0 10.0
Optimum number of units 13 15 15 16 19 20
Discussion The milking process on commercial farms
The impact of the milking process on labour input and efficiency is obvious, given the substantial time associated with milking for each cow. This consequently impacts on farm family income and quality of life. The lower time per cow associated with milking in the larger herds was due to economies of scale,
particularly in the herding of cows and post-milking washing routine. The seasonal effect on labour input to milking observed in this study as decreasing from a peak in May to its lowest level in December and January, was expected, due to the spring milk production system in place on the study farms. Work routine elements of milking, such as cluster attachment and detachment, were likely to take the same duration irrespective of time of year, while the waiting element (i.e. waiting for cows to milk out) would be longer during the high milk yield period in early lactation (Armstrong and Quick, 1986). Also, teat preparation may take a longer time to complete during early spring, when many early calving cows are still housed and while grazing paddock conditions may be poor. First lactation heifers are also likely to require more attention during springtime.
The fact that the labour input for herding pre-milking was higher than post-milking may have been a consequence of the possibility for cows to return to the paddock unassisted, immediately after milking on some of the farms. While many milking parlours have been restructured in order to accommodate larger herd sizes, track widths generally have not been increased, and consequently, herding time may be extended due to poor track conditions (Klein and Hakim, 1994). Klindworth (2000b) identified inadequate track width, poor surface condition and the presence of restrictions on the track as being common causes of slow cow movement. The regular crossing of public roadways due to fragmentation, which occurred on over one-third of farms in this study, may also add significantly to labour inputs.
Whipp, 1992 has indicated the importance of correct unit number with regard to efficient milking. Ultimately, a limit in milking unit number is eventually reached, beyond which, the operator cannot carry out the work routine efficiently and over-milking may occur. This limit is dependent on elements of the work routine, such as teat preparation. The inclusion of some work routine elements of milking, such as pre-milking teat preparation and teat disinfection is often dependent on the workload of the milking operator in terms of unit numbers. Automation would allow for the inclusion of some practises despite heavy workloads in terms of milking unit numbers.
Labour input per cow for washing-up decreased with increasing herd size, meaning that superior facilities on the larger farms may have counteracted the effect of higher cow numbers. Collecting yard cleaning facilities present on farms in the different herd size groups showed a large degree of variation, with more labour efficient facilities found on the larger farms. In addition, the frequency of cleaning (which may also be influenced by the presence of facilities, such as slats and automatic scrapers) would influence the labour input to washing-up. O’Kearney-Flynn et al. (1999) stated that increased levels of automation and properly sited power washers would be important time saving elements in washing-up.
Work routine times within the milking parlour
Cow entry and exit times are becoming increasingly important as parlour length increases due to increased milking unit numbers. Efficient cow flow in the research farm milking parlour in this study resulted in it being unnecessary for the operator to leave the pit during milking. The time associated with teat preparation varied considerably, depending on the methods used. Attaching clusters (i.e. with ACRs) and changing clusters (i.e. without ACRs) took 10.1 and 14.8s/cow, respectively, the introduction of ACRs thereby, reducing work routine time by 4.7s/cow. While the time taken to remove clusters manually may not be significant, the time spent by operators in making decisions as to when to remove clusters may be significant (Klein and Hakim, 1994). Milking performance is dependent on work routines (Whipp, 1992). This fact is clear from this study, where minimum pre-milking hygiene (dry wipe) and cluster attachment (WRT E) took 16.6s/cow. This resulted in a predicted milking performance of 110 cows per operator-hour. Meanwhile, a full pre-milking routine (washing teats, drawing foremilk, drying teats, attaching
clusters) (WRT B) took 26.6s/cow, resulting in a much lower predicted milking performance of 85 cows/operator-hour. Meanwhile, Smith et al. (1998) indicated that, minimal pre-milking teat preparation and cluster attachment took 14s/cow compared to 25s/cow for full pre-milking teat preparation and cluster attachment. Armstrong et al. (1994) found that the use of a wash-pen increased cow throughput by 8-20% by reducing preparation times.
A study by Fox (1994) has shown that a row time of 7 minutes or less should be easily achieved. However, row times measured in 30 herringbone parlours, in that study, varied from 6.5 to 12 minutes with half of the parlours having a row time of at least 10 minutes. Using the work routine times measured in the research milking facility, a maximum predicted number of 116 cows per operator-hour could be milked when teat preparation was minimized to drawing formilk only. Alternatively, where all of the teat preparation procedures are carried out, work routine time can be as high as 42.4s/cow, thus allowing a predicted throughput of 76 or 85 (with ACRs) cows per operator-hour. But, what is most efficient in labour terms (e.g. minimal or no teat preparation), may not be good for milk quality and milk payments when considered within the overall farm system. Minimal cow preparation may not have as significant effect on TBC and milk sediment levels when cows are at pasture compared to indoors. However, from consumer perception and health and safety viewpoints, the issue of preparation of cows for milking has to be addressed. Automation of preparation procedures would speed up milking and cow throughput significantly.
The particular requirements of the individual dairying enterprise and the opportunity cost of labour must dictate the level of automation decided on. If a high level of automation is installed, then it must be ensured that it is reliable and dependable and can be operated by a person of reasonable skill. As herd-sizes are expected to increase in the near future, redesign or construction of new parlours will be necessary. The choice of milking parlour should be directly related to the number of cows being milked currently as well as the herd-size envisaged for the future. Larger herd sizes will lead to a greater focus on time, working conditions and ergonomics associated with milking.
In conclusion, the study confirmed the effect of both scale and seasonality on labour inputs relating to milking. The importance of milking as a task was clearly established. Milking units, teat preparation, and cow flow all represented key factors in milking labour efficiency. Is only through the combination of appropriate work routines and technology, that high efficiency levels can be reached.
Part 2:
Importance of farm facilities in labour efficiency
Introduction
The limiting factor for agricultural growth is not usually the availability of technology but constraints that prevent the full utilisation of the technology available (Mundlak et al., 1997). The small scale of many farms as well as the cost-price squeeze has slowed down the adoption of many technologies in Ireland. Indeed Dillon et al. (2005) have stated that the efficiencies of many labour-saving technologies are captured only by increasing herd size. On many farms cheap hired or family labour is used to compensate for a lack of modernisation and investment in facilities, leading to poor working conditions. However, Fau and Chaspoul (1999) identified long working hours, poor working conditions and physical work on French farms as being a major barrier to finding good personnel. Thus such low cost labour sources are eventually exhausted. Gilbert and Pellerin (1996) found that while machinery cost and building maintenance costs on farms in Quebec increased significantly between 1985 and 1994, a significant increase in labour efficiency was also noted.
Previous findings of Ruane and Phelan (2001), O’Shea et al. (1988) and Gleeson and Kinsella (2003) point towards a requirement for improvement in facilities and practices on Irish farms, and this is emphasised further by the current and future requirement for enterprise expansion. However, expansion in scale of enterprise would have a direct and significant effect on farm labour as a component input requirement of production. Hennessey et al. (2000) have indicated that an expansion of production of 100 % would be required if Irish farmers were to maintain incomes in the context of WTO reform and a milk price cut of 20%. While the magnitude of the increases in scale necessary for different dairying circumstances is debatable, any such development will have an associated requirement for change of basic facilities and practices on farms. Consequently, ongoing research is required in order to establish more efficient working methods and labour saving techniques. The purpose of this study was to establish the profile of dairy farms of various sizes with regard to facilities, practises and infra-structure in order to identify labour saving techniques of potential benefit particularly to small enterprises and to assess barriers to expansion.
Methods and Data Sources
One hundred and thirteen spring-calving dairy farms were involved in this study. The farms were categorised into three herd-size groups; small (<50 cows), medium (50-80 cows) and large (>80 cows). There were 30, 53 and 30 farms in the small, medium and large herd-size groups, respectively. These groups had average herd sizes of 44, 63 and 141 cows, and milk quotas of 230x103, 310x103 and 711x103 l, respectively. Data on farm facilities and practices were recorded though a series of one-off questionnaire surveys, completed on a number of farm visits by experienced data recorders. These surveys investigated facilities and practices associated with the milking process, grassland management, farm fragmentation and calf care. Data analysis was carried out using chi-square analysis.
Results Milking Facilities
Herd-size group had a significant effect on the type of milking parlour used (P<0.05) with 37% of large farms using modern parlours (2’ 2” herringbone, 2’ 3” sequential, rotary) compared to 10% of small farms, thus illustrating the greater likelihood of large farms investing in modern facilities (Table 1). Sixty-seven per cent of farms used a pipeline milking system with the remainder using recorder jars, with no effect of herd-size noted.
Table 1. The effect of herd-size group on the type of milking parlour on farms (n=113)
Herd-size group
Small Medium Large
n=30 n=53 n=30 Total 3’ 0” herring-bone 63% 55% 30% 50% 2’6” herring-bone 27% 17% 33% 24% Modern1 10% 28% 37% 26% Significance * 1
Modern=2’ 2” herringbone, 2’ 3” sequential, rotary; n= number of farms in herd-size group; * = P<0.05 The effect of herd-size on the number of milking units and the number of cows per milking unit is shown in Table 2. Herd-size group had a significant effect on the number of milking units. Herd-size group also had a significant effect on the number of cows per milking unit with the number of cows milked per unit being higher on large compared to both medium and small farms (P<0.001). Herd–size group also had a significant effect on whether or not exit gates could be opened from anywhere in the milking pit (P<0.01), with 67% of large farms using this facility compared to 27% of small farms. Automated backing gates were in use on 10% of farms, while the milking operator had to leave the parlour to bring in most rows of cows from the collecting yard on 31% of farms.
Table 2. The effect of herd-size group on the number of milking units and the number of cows per
milking unit (n=113)
Herd-size group
Small Medium Large
n=30 n=53 n=30 s.e.m. Significance
Milking units 7.4a 8.9a 15.5b 0.65 ***
Cows per unit 6.1a 7.3b 9.4c 0.28 ***
n= number of farms in herd-size group; abc means on the same line not having a common superscript are significantly different; *** = P<0.001
Milking Practices of Pre-milking Teat Preparation and Post-milking Teat Disinfection
Teats were never washed on 41% of farms. Herd-size group did not affect the practice of teat washing. Teats were dried on 30% of farms on which teats were washed (n=67). Herd-size group had a significant effect on whether or not unwashed teats were dry wiped (P<0.01), with 81% of small farms dry wiping cows compared to 38% of large farms. Therefore the absence of teat preparation was more likely to occur
on large farms. The use of teat disinfectant was also influenced by herd-size group (P=0.07) with 83% of small farms using teat disinfectant on a year round basis compared to 57% of large farms. The effect of herd-size on the method of teat disinfection used was approaching significance (P<0.10), with static spray droppers used on 75% of large farms compared to 46% of small farms.
Grassland Management and Fragmentation
Cows travelled directly to paddock after exit from the milking parlour on 60% of farms. Herd-size group had no significant effect on this variable. Fresh grass was allocated twice daily, daily and every second day on 54%, 26% and 20% of farms, respectively, with no effect of herd-size group observed. Herd-size group had a significant effect on whether or not grass covers were being estimated on farms (P<0.05), with 94% of large farms undertaking this task compared to 70% of small farms. Herd-size group had a significant effect on the methods used for grassland measurement (P<0.05), with 41% of large farms using either a plate meter or the Moorepark method (O’Donovan et al., 2002) compared to 14% of small farms. The average number of parcels (land areas separated by road) on the farms was 3.63 (± 1.84, range 1 – 9). The average number of parcels used for dairying was 2.4 (± 1.4, range 1 – 6). Herd-size group had a significant effect on fragmentation (P<0.05) with the grazing area in one block on 73% of small farms compared to 37% of large farms. On farms where it was necessary for cows to cross the public roadway in order to go to the milking parlour, 33% did so, on a daily basis, while 41% of farms required two or more persons to accompany the cows. Herd-size group had a significant effect on the method of drover transport used to herd cows (P<0.001), with quads being used on 33% of large farms compared to 8% of small farms. Ninety per cent of drovers on small farms travelled on foot or by bicycle compared to 40% of drovers on large farms.
Calf Care
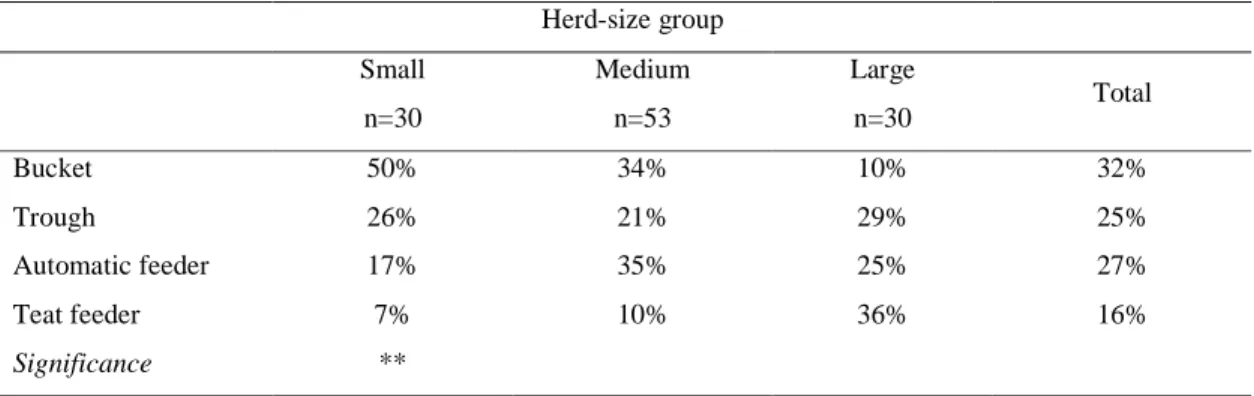
Herd-size group had a significant effect on the methods used to transfer milk to young calves (P<0.05), with 27% of large farms pumping milk compared to 3% of small farms. Sixty-seven per cent of small farms used buckets to transfer milk compared to 43% of large farms, illustrating a move by large farms from the more traditional, labour-intensive methods when feeding young calves. Milk transfer to older calf housing was carried out by buckets, trolley, and pipe on 42%, 35% and 23% of farms, respectively, with no effect of herd-size group observed. Herd-size group had a significant effect on the type of milk transferred for consumption by young calves (P<0.01), with 97% of small farms transferring warm fresh milk compared to 67% of large farms. Herd-size group had a significant effect on the type of milk transferred for consumption by older calves (P<0.05), with 80% of small farms transferring warm fresh milk compared to 48% of large farms. Acidifier was added to milk for young and older calves on 18% and 32% of farms, respectively. Young calves were trained using bucket, bucket and teat and automatic feeder on 46%, 53% and 1% of farms, respectively, with no effect of herd-size group observed. The effect of herd-size group on the methods used for feeding older calves is shown in Table 3.
Table 3. The effect of herd-size group on the methods used for feeding older calves (n=113)
Herd-size group
Small Medium Large
n=30 n=53 n=30 Total Bucket 50% 34% 10% 32% Trough 26% 21% 29% 25% Automatic feeder 17% 35% 25% 27% Teat feeder 7% 10% 36% 16% Significance **
n= number of farms in herd-size group; ** = P<0.01
Herd-size group had a significant effect on the methods used for feeding older calves (P<0.01), with 50% of small farms using buckets compared to 10% of large farms. Thirty-six per cent of large farms used teat feeders compared to 7% of small farms. Milk was fed to young calves twice-a-day, once-a day and on an ad-lib basis on 92%, 4%, and 4% of farms, respectively. The effect of herd-size group on the frequency with which older calves were fed is shown in Table 4.
Table 4. The effect of herd-size group on the frequency with which older calves were fed (n=113)
Herd-size group
Small Medium Large
n=30 n=53 n=30 Total
Twice-a-day 74% 52% 36% 53%
Once-a-day/ Ad lib 26% 48% 64% 47%
Significance *
n= number of farms in herd-size group; * = P<0.05
The effect of herd-size group on the frequency with which older calves were fed was significant (P<0.05), with 74% of small farms feeding such calves on a twice daily basis compared to 36% of large farms. Calves were fed as a group at less than 2 weeks, 2 to 4 weeks and greater than 4 weeks on 79%, 17% and 4% of farms, respectively.
Housing for young calves had solid floors with straw bedding, slatted lying areas with straw bedding and slatted floors without bedding on 41%, 51% and 8% of farms, respectively. Housing for older calves had solid floors with straw bedding, slatted lying areas with straw bedding and either sawdust, bark mulch or slats on 53%, 39% and 8% of farms, respectively. Young and older calf pens that contained straw were bedded on a daily basis on 55% and 58% of farms, respectively. No effect of herd-size group on any of these factors was observed. Herd-size group had a significant effect on the frequency with which the pens of young calves were cleaned (P<0.01), with pens being cleaned on a daily basis on 27% of small farms compared to 10% of large farms. Herd-size group had a significant effect on the frequency with which the pens of older calves were cleaned (P<0.001), with pens being cleaned on a daily basis on 30% of small farms compared to 6% of large farms. Pens of young calves were cleaned using the methods of fork and barrow, fork and loader and loader only on 45%, 30% and 25% of farms, respectively. Pens of older calves were cleaned out using similar methods on 26%, 23% and 51% of farms, respectively. No
effect of herd-size group was found. Calves were dehorned with electric dehorners on 97% of farms. Farm operators, farm relief and other labour sources dehorned calves on 84%, 12% and 4% of farms, respectively. Calves were weaned at less than 8 weeks and at greater than 8 weeks of age on 32% and 68% of farms, respectively. Herd-size group had a significant effect on whether or not all calves were reared on the farm until weaning (P<0.05), with 63% of small farms rearing all calves compared to 35% of large farms, illustrating a stronger focus on larger farms on core dairying activities i.e. those related to the herd. Most calves were sold at less than 1 week, at 1-3 weeks and at greater than 3 weeks on 4%, 39% and 57% of farms on which calves were sold, respectively (n=51). Calf houses for young and older calves were purpose built on 54% and 47% of farms, respectively.
Discussion
The superior facilities and practices found on large farms in this study illustrated a greater ability on the part of large farms to invest capital, with less uncertainty surrounding their future in the industry, along with a greater requirement for more labour efficient systems with increased herd sizes. Indeed, Leaver (1994) has previously stated that the balance between labour input and mechanisation changes with farm size, while Nix (1993) has stated that costs per ha related to power and machinery declined with increasing scale.
While the average cow/milking unit ratio of 7.6 found across all farms was within the 8 rows of cows per milking recommended by McMahon and Ryan (2000), the large variation from 4 rows to 15 rows per milking illustrated the capacity for expansion of herd-size on some farms compared to the grossly undercapitalised nature of other farms. The fact that the cow: unit ratio increased with herd-size, illustrated that milking unit numbers were not expanded in line with increasing herd-sizes. Therefore, large farms had a requirement for much improvement in order to reach optimum unit numbers. The recommended cow:milking unit ratio is 6:1 (O’Callaghan et al., 2001). The main time saving elements of milking include an adequate number of milking units, an efficient work routine time, fast cow flow at entry and exit, a reliable drafting system and stall work that gives good cow control. It is extremely important that the operator does not have to leave the pit during milking. Upgrading of many parlours in respect to these characteristics is required.
Therefore a broader view of the whole package of farm facilities and practices, in conjunction with the long list of tasks, needs to be considered when introducing technological change. For example, the introduction of extra milking units may provide little or no advantage during springtime unless it is accompanied by the required number of milking operators. Teat preparation represented an integral element of the milking routine in terms of milk quality and udder health. Recognising the large herd-sizes in Australia and that best practice is to apply cups to clean dry teats, Klindworth (2000a) recommended strategic washing i.e. the washing and drying of dirty teats only. However, this study indicated that teats were dried on only one-third of farms on which teat washing was carried out. Dry wiping of unwashed teats was less likely to occur on the larger farms, as was manual teat disinfection, clearly showing that as herd-size and milking unit numbers increased, the level of pre and post milking teat treatment declined.
Klindworth (2000b) identified yards, backing gates, shed design, stockhandling and feeding as the main issues that affect the ease and efficiency with which a cow may walk into a milking parlour. While Irish milking parlours appeared to be adjusting to larger herd-sizes in terms of milking practices and to a certain extent in terms of milking unit numbers, technologies to improve cow flow were less prevalent on farms in this study. Entry gates, drafting which could be operated from anywhere in the pit and backing gates were rare across all herd-sizes, while narrow doorways and operators having to leave
the pit to aid cow flow were both prevalent. On the other hand, exit gates which could be operated from anywhere in the pit were more common, particularly on the larger farms where cow flow became more important with increasing milking unit numbers, longer parlours and reduced available work times. Significant improvement in terms of cow flow was required on many farms in this study, a fact best illustrated by the fact that on almost one-third of farms the milking operator had to leave the pit in order to bring in most rows of cows. Fox (1994) has suggested that cows would walk in by themselves where good cow flow factors are in place, such as lead-in walls, funnel entrances, lower breast-rails, zigzag rump rails, wide exit races that can hold one row of cows, drafting which can be operated from the pit and rough non-slip concrete surfaces. While discussion group recommendations from this study included many of these factors, particular attention was paid to collecting yards, handling facilities and holding yards.
This study indicated that the frequency of grass allocation has changed from the traditional method of grass allocation after each milking to a situation where almost half of the farms allocated grass on a daily or alternate day basis. Recent research has shown that using paddocks for 3 grazing periods (36 hours) increased protein levels while also reducing labour input in terms of strip fencing (Courtney, 2001). However, farm layout must be taken into consideration. While grass measurement was more likely to be carried out on large farms, with a large reliance on visual methods, a significant number of large farms used plate meters. Due to an obvious economy of scale the return on such practices would be more significant on bigger farms and once more it illustrates the earlier adoption of technologies by such farms. As a task, grassland measurement and budgeting is one with a high management element and which is likely to have a higher economic return than many arduous tasks within the farmyard. Indeed the elevation of such management tasks would help to reverse the negative image of farming amongst many farm family members, while increasing the need for more highly skilled labour sources. Allocation of fresh grass at a frequency of > 24 h would reduce labour demand and not have an adverse effect on cow production characteristics.
CSO (2002) data indicates that land fragmentation has increased over the last decade with the average number of parcels per farm increasing from 1.9 to 3.1 between 1991 and 2000. A high proportion of large farms were fragmented in terms of dairy cow grazing area, which in turn led to a requirement to take cows across a public roadway for milking, a practice which required a second person on many farms with a matching progression in terms of drover transport also evident. Thus, dependency on a second person emerges, not in terms of meeting labour input quantity demands, but instead by assisting in tasks that require two persons. Ultimately, in the absence of underground tunnels, a clear dependence on labour sources additional to the principal operator will remain.
Many calf houses are not purpose built, but instead are converted buildings and therefore possibly not site specific. Indeed this leads to a necessity for efficient methods of milk transfer between the milking parlour and calf house. Transfer of milk to young calves by a piping system was more common on large farms, while trolleys were used frequently when long distances, older calves and therefore larger milk volumes were involved. Warm fresh milk was sent to younger calves on a large proportion of small farms which usually resulted in increased labour requirement during milking time, and in many cases created a requirement for an additional operator. Large farms were more likely to feed cold milk to both younger and older calves facilitating a breakage of the link between feeding calves and milking referred to by Fallon (2001). Meanwhile teat feeders which were more common on large farms can accommodate large numbers of calves and also allow the feeding of cold milk. As calves take longer
to drink cold milk, traditional bucket feeding methods become even more labour intensive in such systems.
The grouping of calves as a tool for reducing labour inputs, with calves being fed as a group at less than two weeks of age was practised on most farms. Meanwhile automatic feeding of older calves appeared to replace twice daily feeding on larger farms. In a study of 59 Irish spring calving herds Gleeson et al. (2003) found that milk feeding of calves on a once daily basis reduced the labour input per calf and did not adversely affect calf performance. Daily bedding with straw for both young and older calves on many farms would appear to be labour intensive with alternatives such as annual bedding using bark mulch or the use of slats being proposed. This was somewhat evident on large farms with annual cleaning more common than on small farms. While calf house cleaning methods were similar across herd-size groups, a greater number of houses of older compared to younger calves could be cleaned by loader. As calf rearing in converted housing is common, it is possible that calf houses are not generally designed for ease of cleaning.
Meanwhile the rearing of all calves was less likely to take place on larger farms, thus illustrating the specialisation on these farms. However, as most calves were sold at greater than 1 week of age much of the labour associated with calf care had already been carried out. Alternatives of course include the contract rearing of calves or a much earlier removal of calves to outdoor calf rearing systems. However, the overall system must stay in focus. For example striving to lower bedding and cleaning times may lead to outdoor rearing far from the milking parlour and therefore causes losses in terms of milk transport.
The findings indicated a greater usage of labour efficient technologies on the larger farms, such as better facilities and less intensive work routines in milking and calf care for older calves. However, large farms were also more likely to suffer from land fragmentation and the associated difficulties. A heavy reliance on supplementary labour sources during key periods, such as springtime, or to assist with tasks such as herding cows across roadways and separation of cows for calving was also observed. Indeed such issues, relating to facilities and practices will become increasingly important for Irish farmers who wish to expand their scale of output over the coming years and to minimise increases in labour requirements.
In conclusion, the larger farms have been clearly shown to be early adopters of technology, then these farms will continue to benefit directly as unit costs are reduced and are likely to be drawn further in and onto the technology treadmill (Gasson and Errington, 1993). Meanwhile, the introduction of technology ultimately reduces product prices and the consequential cost-price squeeze along with the small scale of many farms slows down the adoption of many technologies in Ireland. Meanwhile Dillon
et al. (2005) have stated that increased herd-size is necessary to capture the benefits of many
labour-saving technologies. Leaver (1994) has previously described this conventional model of agricultural development, incorporating increasing farm size, increasing mechanisation and reducing labour input, while the Agri Food 2010 (2000) committee have emphasised the need for investment in physical capital and the implementation of improved technologies. Therefore technology adoption decisions will have to be made in the context of the wider farm framework in terms of available labour sources, tasks and the subsequent effect on returns to labour input and efficiency, such as income and quality of life. In this context, a significant change in facilities and practices will continue to be necessary in order to enable current labour levels on farms to meet the labour requirements associated with increased scale.
Part 3:
Effect of milking frequency and nutritional level on milk
production characteristics, reproductive performance,
udder health and milk quality, welfare and behaviour of
dairy cows
Introduction
Milking cows twice a day (TAD) is a time-constraining task for dairy farmers. Once a day (OAD) milking may offer a major opportunity to improve labour output and reduce costs. If once daily milking was proven as a satisfactory alternative to the normal twice daily milking regime, reduced milking frequency could have the following potential benefits for different sectors of dairy farmers: (i) increased labour productivity and reduced costs (including that of hired labour); (ii) permit the uptake of alternative employment or alternative business interests; (iii) improved management of large herds in terms of milking time and cow walking distance on fragmented land bases, (iv) ease of work in terms of ergonomics together with shorter time input to the dairying operation and (vi) an easier lifestyle. However, such a potential alternative system should be critically examined from both management and economic viewpoints.
Few full lactation studies on OAD milking have been undertaken. New Zealand studies by Holmes et al., (1992); Clark et al. (2006) and French studies by Remond et al., (2004) have shown that OAD milked cows produced less milk with higher fat and protein contents compared to TAD milked cows. However, nutritional management may influence the consequences of reduced milking frequency. It is also considered that reduced milking frequency may influence reproductive performance of cows (though very few studies have examined these response variables) and affect the quality (somatic cell count [SCC]) of milk produced. Thus, the objective of the current trial was to compare once daily and twice daily milking regimes at two different nutritional levels for milk production and quality and reproduction parameters, over a complete lactation.
Description of study
Sixty spring-calving, pluriparous Holstein-Friesian cows were blocked according to expected calving date, parity and previous lactation milk yield. Cows were assigned to a factorial arrangement of treatments after calving; twice a day (TAD) milking on a high (TH) or low (TL) nutritional level (NL); once a day (OAD) milking on a high (OH) or low (OL) NL. High and low NL were defined by concentrate offered while cows were indoors on grass silage after calving (7 and 4 kg, respectively), by a combination of concentrate offered (4 and 1 kg, respectively) and post-grazing height (75 and 55 mm, respectively) during the first 26 days at pasture (22 March to 16 April), by post-grazing height (75 and 55 mm, respectively), during the main grazing season (17 April to 2 October), and by a combination of concentrate offered (3 and 1 kg, respectively) and post-grazing height (75 and 55 mm, respectively) during the late grazing period (3 October to 27 November). Cows on the high and low NL received a total of 420 kg and 137 kg of concentrate per cow, respectively, throughout lactation. Mean calving date was 11 March. Cows were bred by one AI technician during a 13-week breeding season commencing on 26 April 2004. A strict drying-off policy was adhered to, where milking ceased for cows on reaching a milk yield of 7 kg per day or a time interval of 10 weeks to calving.
Milk yield was recorded daily, while milk composition was measured weekly. Cow live-weight (LWT) and body condition score (BCS) were recorded weekly and fortnightly, respectively. Somatic cell count (SCC) was analysed weekly up to 1 May and subsequently on a fortnightly basis. Clinical mastitis incidences were recorded. Milk samples were collected thrice-weekly post-partum for progesterone analysis to determine the commencement of luteal activity (CLA) (CLA; >3ng/ml in 2 consecutive samples). Submission, conception and pregnancy rates were recorded. Data were analysed according to factorial design using the PROC Mixed procedure in SAS.
Results and Discussion Milk production, live-weight and body condition score of cows
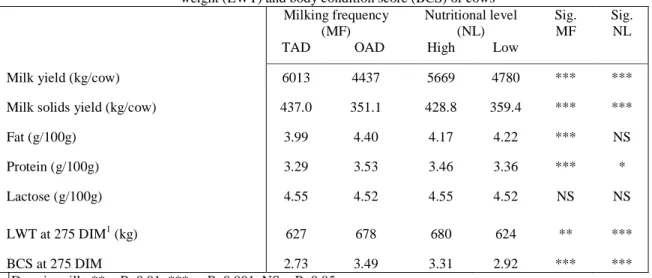
OAD milking and a low NL reduced milk yield and yield of milk solids (MS) (P<0.001) compared to TAD milking and a high NL, respectively, (Table 1). Fat and protein contents of milk were increased (P<0.001) with OAD compared to TAD milking. Fat content was not affected by nutritional level, but protein content was reduced (P<0.05) at the low compared to the high NL. Milk lactose content was not significantly affected by MF or NL. Milk yield was 26% lower, while MS yield was 20% lower with OAD milking compared to TAD milking. Cow LWT at the end of lactation was higher with OAD milking (P<0.01) and with the high NL (P<0.001). Cow BCS at the end of lactation was also higher with OAD milking (P<0.001) and with the high NL (P<0.001). Grass removed per cow (measured on a group basis) during the main grazing season (17 April to 2 October) was recorded as 19.7, 19.0, 15.4 and 14.9 kg DM/cow/day, respectively. Thus, grass removed per cow was reduced by a similar level (3-4 %)by OAD milking at both nutritional levels.
Table 1. Effect of milking frequency (MF) and nutritional level (NL) on mean milk production,
live-weight (LWT) and body condition score (BCS) of cows Milking frequency
(MF)
Nutritional level (NL)
TAD OAD High Low
Sig. MF
Sig. NL
Milk yield (kg/cow) 6013 4437 5669 4780 *** ***
Milk solids yield (kg/cow) 437.0 351.1 428.8 359.4 *** ***
Fat (g/100g) 3.99 4.40 4.17 4.22 *** NS Protein (g/100g) 3.29 3.53 3.46 3.36 *** * Lactose (g/100g) 4.55 4.52 4.55 4.52 NS NS LWT at 275 DIM1 (kg) 627 678 680 624 ** *** BCS at 275 DIM 2.73 3.49 3.31 2.92 *** *** 1 Days in milk; ** = P<0.01, *** = P<0.001, NS = P>0.05 Reproductive performance
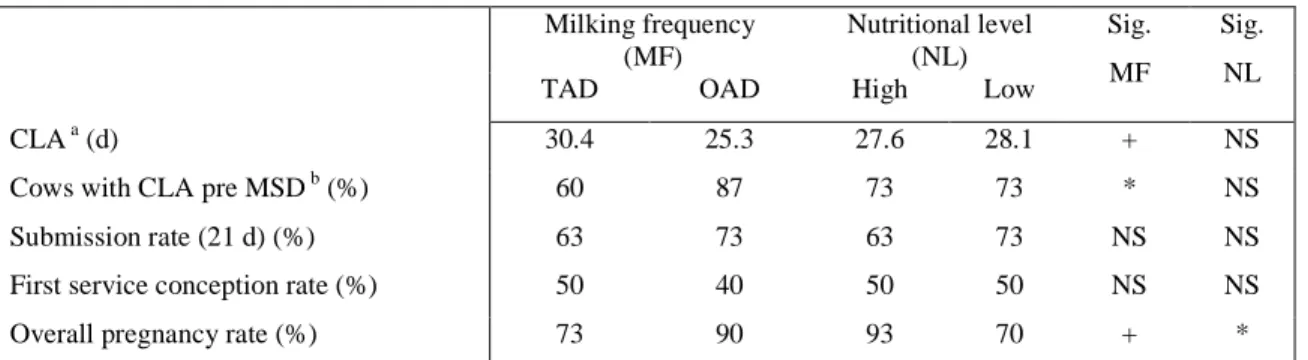
The onset of ovarian cyclicity was evaluated by two measurements – the number of days to commencement of luteal activity (CLA) and the proportion of cows that had commenced luteal activity pre-MSD (mating start date). OAD milked cows tended to have an earlier CLA (P<0.10) and a greater proportion of them had commenced luteal activity pre-MSD (P<0.05) compared to TAD milked cows (Table 2). Submission rate in the first three weeks after MSD and first service conception rate were not significantly affected by either milking frequency or nutritional level. However, the overall pregnancy rate
was higher with OAD (P<0.10) and the high NL (P<0.05) compared to TAD milking and a low NL, respectively. Caution must be exercised with these results involving limited experimental units, and these measurements need to be repeated. However, preliminary conclusions suggest no detrimental effects and some possible beneficial effects of once daily milking on reproductive performance. These findings are in agreement with other results using milking frequency models, from our Research Centre (Patton et al., 2005).
Table 2. Effect of milking frequency (MF) and nutritional level (NL) on reproductive performance
indicators of cows
Milking frequency (MF)
Nutritional level (NL)
TAD OAD High Low
Sig. MF
Sig. NL
CLA a (d) 30.4 25.3 27.6 28.1 + NS
Cows with CLA pre MSD b (%) 60 87 73 73 * NS
Submission rate (21 d) (%) 63 73 63 73 NS NS
First service conception rate (%) 50 40 50 50 NS NS
Overall pregnancy rate (%) 73 90 93 70 + *
* P<0.05, + P<0.10, NS = P>0.05; a CLA=commencement of luteal activity based on milk progesterone;
b
MSD=mating start date
Udder health
The objective of this section of the study was to quantify the impact of milking frequency (MF) at two nutritional levels (NL) on udder health. Weekly SCC records were available up to 1 May and fortnightly thereafter. Clinical mastitis (CM) incidences were also recorded. The data were transformed by the natural logarithm so that it was normally distributed; this variable is referred to as somatic cell score (SCS). Sub clinical mastitis (SCM) was deemed to be present if a test-day had a SCC greater than 250,000/ml without an accompanying identified case of CM within five days of the date in question.
Milk SCS of non-infected cows only and of all cows was not significantly affected by MF but was higher in the low compared to the high NL (Table 3). Neither MF nor NL significantly affected the probability of contracting CM; proportionally 0.28 and 0.22 of lactations in the TAD and OAD groups, respectively, had at least one case of CM. However, this is a binary trait and this dataset is small. Milking frequency or NL did not significantly affect the probability of SCM although the effect of NL did approach significance (P=0.09). The odds of a OAD milked cow exhibiting SCM was 0.95 (95% CI; 0.47 to 1.92) that of a TAD milked cow. The odds of a low NL cow exhibiting SCM was 1.83 (95% CI; 0.92 to 3.64) that of a high NL cow. The similar SCC observed with TAD and OAD milking in this study is at variance with that reported in the studies of Cooper (2000) and Remond et al., (2004). This difference may be associated with the nutritional status of cows in the different trials.
Table 3. Effect of milking frequency (MF) and nutritional level (NL) on somatic cell score (SCS units)
(mean SCC [x103 cells/ml]), in the first 30 weeks of lactation
†
Standard error of the *** = P<0.001, ** = P<0.01, NS = P>0.05
Milking frequency Nutritional level SEM Significance TAD OAD High Low MF NL Non-infected cows 4.61 (100) 4.46 (86) 4.15 (63) 4.93 (138) 0.110 NS ***
Lactation curve characteristics
The objective of this part of the study was to compare the lactation curve of cows on two milking frequencies and two nutritional levels (NL). Milk yield was measured daily while milk protein content was assessed weekly for each cow separately. The Wilmink (1987) exponential model was fitted using PROC NLIN (SAS, 2005) to daily milk and protein content:
yt = a + be-0.05t + ct
In this model, a, b and c are parameters to be estimated and relate to the height of the curve, the initial phase and the phase post turning point, respectively and whereyt represents the dependent variable (i.e.,
milk yield or protein percent) at day t of lactation. The first derivative of the function for each cow was set to zero and solved for days in milk (DIM) to obtain the turning point on the curve. The definite integral of the function was used to get 305-day milk yield. A least squares analysis was performed on the co-efficients of the function for each production variable using PROC GLM (SAS, 2005). Milking frequency (MF), NL and experimental block were included in the model; a two-way interaction between MF and NL was also tested.
The mean lactation curves for MF and NL are illustrated in Figure 1 for milk yield (a) and protein content (b). Cows milked OAD had a lower milk yield (P<0.001) at calving and at peak production (16.8 kg and 23.7 kg, respectively) compared to cows milked TAD (23.6 kg and 30.7 kg, respectively). Milking frequency did not affect the rate of incline of milk production between calving and peak or the number of DIM to peak. However, persistency of milk yield, (the c parameter of the function), was greater with OAD compared to TAD milking (P<0.01). The low NL also resulted in a lower milk yield (P<0.01) at calving and at peak production compared to the high NL. The rate of incline of milk production between calving and peak was reduced (P<0.05) and peak production was reached earlier (P<0.05) with the low compared to the high NL. The rate of decline in milk production after peak was not affected by NL. Total 305-day milk production was significantly lower (P<0.001) for OAD milking (4,620 kg) than TAD milking (6,214 kg) and for low NL (4,924 kg) than high NL (5,910 kg). There were no interactions for MF and NL.
Once a day milking resulted in a higher milk protein content at calving (P<0.001) and at nadir (P<0.001). The DIM at which nadir protein content occurred and the rate of incline of protein content after nadir was not affected by MF. None of the above parameters were significantly affected by NL. Average milk protein content across the 305 day lactation was significantly higher for OAD milking (3.66 g/100g) than TAD milking (3.42 g/100g) and for high NL (3.60 g/100g) than for low NL (3.48 g/100g).
Figure 1. Effect of MF and NL on the lactation curve for (a) milk yield and (b) milk protein content
Processing quality of milk
This part of the study investigated the effect of milking frequency (MF) at two nutritional levels (NL) on milk processing quality. Milk samples for processability analysis were collected from TAD and OAD cows at two consecutive milkings and at one milking fortnightly, respectively.
Gelation properties:
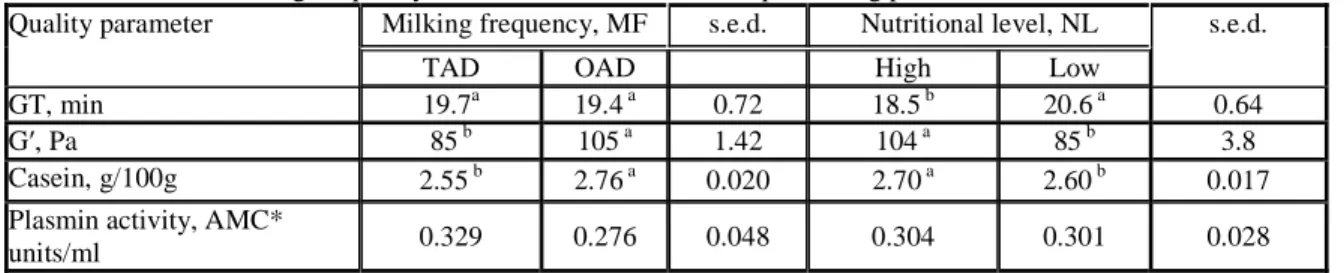
• GT = time until onset of gelation (min) (shorter GT most desirable in cheese-making) • G′ = gel strength at 50 min (Pa) (higher G′ reflects higher gel strength and is most desirable) Generally, milk processability, as measured by gelation properties, N-fractions and plasmin activity were not adversely affected by OAD compared to TAD milking Table 4 and Figure 2). This study
demonstrated that OAD milking reduced milk yield and increased fat and protein contents while not compromising milk processing quality. In summary,
• G′ and casein content of milk were improved by OAD milking
• GT, G′ and casein content of milk were improved by the High NL
• Plasmin activity in milk was unaffected by MF or NL
Table 4. Effect of milking frequency and nutritional level on milk processing parameters
Milking frequency, MF s.e.d. Nutritional level, NL Quality parameter
TAD OAD High Low
s.e.d.
GT, min 19.7a 19.4 a 0.72 18.5 b 20.6 a 0.64
G′, Pa 85 b 105 a 1.42 104 a 85 b 3.8
Casein, g/100g 2.55 b 2.76 a 0.020 2.70 a 2.60 b 0.017
Plasmin activity, AMC*
units/ml 0.329 0.276 0.048 0.304 0.301 0.028 (a) 0 5 10 15 20 25 30 35 1 70 140 210 280 k g /c o w /d a y (b) 2.5 3.0 3.5 4.0 4.5 1 70 140 210 280 Days in m ilk g /1 0 0 g
TAD OAD High Low
a,b
Figure 2. Profile of gel strength
Welfare of dairy cows
The objective of this part of the study was to investigate the effect of milking frequency and nutritional level on cow welfare. Milking characteristics were recorded daily. Blood samples to evaluate changes in the composition of the blood cells, milk leakage, udder tension and locomotory ability were measured on four occasions. Teat-ends were classified for hyperkeratosis (HK) monthly post-partum.
TAD had longer daily milking times (P<0.001) compared to OAD cows. There was no effect of MF or NL on morning milking time, time to milk letdown or peak milk flow rate (P>0.05) (Table 5). High NL cows had higher average flow-rates (P<0.05) than low NL cows. Neither MF nor NL affected HK (P>0.05). However, HK were positively correlated with daily milking time for OAD cows for six months of lactation (P<0.05). This correlation was significant (P<0.01) for OH during the peak lactation period. OAD cows had higher levels of milk leakage compared to TAD cows during the month of May (P<0.01) (Table 6). OH cows showed higher udder firmness scores than OL and TL in June and July (P<0.05). OAD cows had higher locomotion scores compared to TAD cows (P<0.001) (Table 7). Locomotion and udder firmness scores were significantly correlated for OAD in June (P<0.05). OAD cows had lower blood lymphocyte counts, numerically higher counts of neutrophil and a higher monocyte count at peak lactation compared to TAD cows suggesting that OAD cows had altered immune responses. The increase in milk leakage, higher udder firmness and locomotion scores in conjunction with changes in blood cells, suggests that OAD milking may have caused some discomfort to the cows during peak lactation. Changes in the management and feeding routine of OAD cows during this period could ameliorate this problem.
0
20
40
60
80
100
120
140
160
180
0
50
100
150
200
250
300
Stage of lactation, Days in milk
E
la
s
ti
c
s
h
e
a
r
m
o
d
u
lu
s
,
G
′
(
P
a
)
OAD High
TAD High
Table 5. Effect of milking frequency (once or twice) and nutritional level (high or low) on daily milking
time and milking characteristics at the morning milking.
Milking Frequency Nutritional Level
Twice Once High Low s.e.m.
Daily milking time (secs) 692a 414b 570 536 17.88
Morning milking
Milking time (secs) 386 414 416 384 15.50
Time to let-down (secs) 0.37 0.35 0.35 0.37 0.010
Peak milk flow rate (l/min) 4.36 4.45 4.56 4.24 0.168
Average milk flow rate (l/min) 2.45 2.58 2.63c 2.41d 0.075
a,b c,d
values within rows with different superscripts are different (P<0.00 1and P<0.05, respectively).
Table 6. Effect of milking frequency (once or twice) and nutritional level (high or low) on proportion of
cows (%) (number affected/number inspected) leaking milk at four sampling dates
Milking frequency Nutritional level
Sample date Twice Once High Low
21st April 23 (7/30) 43 (13/30) 33 (10/30) 33 (10/30)
20th May 17 (5/30)a 53 (16/30)b 30 (9/30) 40 (12/30)
17th June 24 (7/29) 30 (9/30) 23 (7/30) 31 (9/29)
18th July 7 (2/30) 23 (7/30) 17 (5/30) 13 (4/30)
a,b
values within rows with different superscripts are different (P<0.01)
Table 7. Effect of milking frequency (once or twice) on locomotion scores (lsmean) of cows at four
sampling dates
Milking Frequency
Sample date Once Twice s.e.m.
21st April 10.48a 8.35b 0.225
20th May 8.41 7.52 0.225
17th June 6.90 7.03 0.225
18th July 7.22 6.83 0.225
a,b
values within rows with different superscripts are different (P<0.001).
Behaviour and hoof health of dairy cows at pasture
The objective of this part of the study was to evaluate the effect of milking frequency (MF) and nutritional level (NL) on behaviour and hoof health of spring calving dairy cows. Hoof lesion scores were recorded prior to housing, monthly for the first six months of lactation and at housing in November. Behaviour was recorded directly by instantaneous scan sampling in May, July and September for 6x24hr sessions.
Milking frequency had a significant effect on the number of sole haemorrhages with OAD cows having fewer haemorrhages at 180 (P=0.059) and 238 (P<0.01) days in milk (Figure 3). Furthermore, OAD cows had a significantly lower probability of being affected by a severe haemorrhage (odds ratio=0.33, 95% C.I. 0.134 to 0.829; P<0.05). There was no effect of nutritional level on the number of
sole haemorrhages recorded in cows during lactation (P>0.05,). Thus, OAD milking improved the hoof
health of cows in late lactation probably due to lower rates of hoof wear owing to shorter walking distances during the grazing season.OAD cows spent longer lying than TAD cows (P<0.001, Table 8). They also spent more time grazing than TAD cows (P<0.01). Cows on the high NL spent longer ruminating than cows on the low NL (P<0.001).
0 1 2 3 4 5 6 30 58 87 116 147 180 238
mean no. days in milk
N o . S o le h a e m o rr h a g e s OAD TAD
Figure 3. Effect of milking frequency on the number of sole haemorrhages recorded in cows during
lactation
Table 8. Effect of milking frequency and nutritional level on time spent (lsmean hr) lying, grazing and
ruminating during lactation
Milking frequency Nutritional level sem
OAD TAD High Low
Lie 10.5x 9.7y 10.2 10.0 0.140
Graze 9.1p 8.6q 8.8 8.8 0.130
Ruminate 7.5 7.4 7.7x 7.2y 0.095
Part 4:
Economics associated with labour efficiency
Relationship between labour efficiency, production system and profitability on dairy
farms in Ireland
Introduction
Fostering competitiveness is a key aim within dairying. There is a need to examine current performance and identify the determinants of economic efficiency. There is a wide dispersion in economic efficiency between dairying enterprises of similar scale, which suggests that there is scope to increase efficiency without increasing output. Benefits of larger scale include higher labour productivity. However, there are also variations in economic efficiency not related to scale, and therefore potentially available to all farmers, e.g. concentrate:milk conversion ratio. Thus, the cost of inputs including labour and the efficiency with which they are used must be investigated. The strategy to increase income for large-scale farmers may be to reduce costs thus increasing profitability and for small-scale farmers by gaining income from a second occupation. This study investigates the effect of scale and production system, and their inherent impact on labour demand, and in turn, on farm profitability, and looks at the characteristics underlying economically efficient farms.
Materials and methods
This study focused on the full-time dairy farmers, with a business size of at least 135 x103 litres of milk quota and mainly from the Munster region, that were involved in the Moorepark labour study (End of project report 4678). One hundred and forty three dairy farmers opted to participate in the labour aspect of the study initially. Proportionally 0.81, 0.17, and 0.02 of these farms had spring, spring and autumn (mixed) and autumn calving herds, respectively. The farms ranged in milk quota size from 135 x103 to 1,500 x103 litres. The spring-calving farms were grouped into four categories, with 0.26, 0.23, 0.22 and 0.29 of farms within the quota groups 135 x103 to 250 x103 litres, >250 x103 to 320 x103 litres, >320 x103 to 500 x103 litres and >500 x103 to 1,500 x103 litres, respectively.
Farm labour input data collection
Farm labour input data were collected between February 2000 and January 2001 on the 143 farms. Collection of labour data required all farm operators (farmers and/or farm staff) to record the duration of the different tasks that they performed throughout the day. Records were made on consecutive 3 or 5-day periods on one occasion per month (usually on the second or third week of the month). Recording methods included a timesheet or a Psion organiser (i.e. a hand-held, electronic data logger that incorporated the Observer behavioural package [Noldus Information Technology]), both of which were designed to record the total time consumed by 29 different farm tasks.
Farm financial data collection
A total of 57 farms of the 143 l