1 Mercury in boreal freshwater fish – factors and processes governing increasing concentrations
DISSERTATION FOR THE DEGREE OF PHILOSOPHIÆ DOCTOR Hans Fredrik Veiteberg Braaten
Department of Chemistry
Faculty of Mathematics and Natural Science University of Oslo
2 Acknowledgements
Writing the last few words of this thesis makes me quite overwhelmed thinking of all the people who have helped me over the last four and a half years, making the present document a possibility. There are too many of you to thank individually in this short Acknowledgement, but you know yourself who you are. I am very grateful to you all.
First of all, I would like to thank my supervisor, Thorjørn Larssen. When you brought me to NIVA, you gave me the opportunity to work on an exciting project with very skilful colleagues. Now, I find it hard to explain in words how much help you have offered over these years. I am still astonished every day by your ability to, despite limited time, offer constructive feedback, raise critical questions, support and back me up when needed. Thank you!
Secondly, I would like to thank all my colleagues at NIVA. Thanks to Heleen, Eirik, Markus, Tor Erik, Espen, Sigurd and Amanda for helping me writing papers and discussing environmental issues. A special thanks goes to Chris for teaching me the basics in the world of article publishing. Additionally I will never forget the laughs over lunch or coffee with Sissel, Merete and everybody else at section 312. I learn something new every day from working with you all.
I would also like to thank my co-supervisor Rolf Vogt and his Environmental Chemistry Group at UiO. You have given me the opportunity to present my work in an informal setting, where all questions have been welcome. Thank you also to Erlend for close collaboration, particularly in the lab. My family and friends also deserves a big thank you for supporting me and making me believe in myself, even though you have no idea what I do for a living. Frode, although you like to teach me on scientific issues, thanks for adding some football and home brew to my life.
Finally, the biggest thank you goes to Kate. You know what I think of all you have done for me. The last 12 months have been incredible and quite the journey. Now the rest of our lives are waiting for us, I cannot wait to spend it with you and Aksel.
Hans Fredrik Oslo, 16.03.2015
3 Contents Abstract List of publications Abbreviations 1 Introduction 1.1 Hg speciation 1.2 Hg in freshwater ecosystems 1.2.1 Hg in freshwater fish 1.2.2 Trophic transfer of MeHg 1.2.3 Hg transport, production and fate 1.2.4 Drivers of Hg in aquatic environments 1.3 Trends in global Hg emissions
1.4 Objectives
2 Materials and methods 2.1 Study sites
2.1.1 Langtjern
2.1.2 Breidtjern and Tollreien 2.1.3 Vuorasjavri
2.2 Sampling
2.2.1 Water sampling 2.2.2 Fish sampling
2.2.3 Lower food chain biota sampling 2.3 Chemical analysis
2.3.1 Water sample treatment and analysis 2.3.2 Biological analysis
2.4 Data sources 2.5 Statistical analysis
2.5.1 Spatial water data (paper 2)
2.5.2 Fish data treatment and calculations (paper 5) 3 Results and discussion
3.1 Methodological developments
3.1.1 Water sample preservation techniques 3.1.2 Acid extraction of MeHg in biota 3.2 Hg concentration in Norwegian freshwater fish 3.3 Catchment Hg cycling
3.3.1 Organic matter as transport vector 3.3.2 Catchment base cation status 3.3.3 Catchment area
3.3.4 Nutrient mediated methylation 3.4 Aquatic in-lake processes
3.4.1 Organic matter as methylation substrate 3.4.2 PD of MeHg
3.4.3 Future PD loss scenarios
3.4.4 Habitat specific in-lake methylation
3.4.5 Chlorophyll and TOC associated MeHg transport 3.5 Biological food chain mechanisms
3.5.1 Changing fish trophic position 3.5.2 Variation of MeHg biomagnification
3.5.3 Temperature dependent MeHg biomagnification 3.5.4 Biological influence on MeHg biomagnification 4 Conclusions
5 Future work 6 References Papers
4 Abstract
Mercury (Hg) is a natural element, present all over the world at trace concentrations. Due to its volatility the element can undergo long-range transport in the atmosphere, and is historically accumulated in catchment soils of remote locations. Inorganic Hg can become methylated into toxic and bioaccumulative methylmercury (MeHg), which is biomagnified in aquatic food chains with potential harmful effects on organisms. Although awareness was raised concerning Hg as an environmental concern almost 6 decades ago, the complexity of the mechanisms controlling accumulation of MeHg in freshwater food chains are still largely unknown.
Due to the propensity of MeHg to accumulate, concentrations can often be low in various natural environmental matrices, e.g. water and biota at the bottom of the food chain. As is documented through studies of sample pre-treatment methods for water and biota in the present thesis, care must be taken when choosing sampling and analytical approaches to avoid erroneous results and conclusions. For water samples, using one bottle for both MeHg and total Hg (TotHg) determination, could lead to an underestimation of approximately 10 % of the TotHg concentrations. Similarly, choosing an alkaline digestion method instead of an acid extraction technique for biological material could lead to an underestimation of more than 30 % of the MeHg concentration.
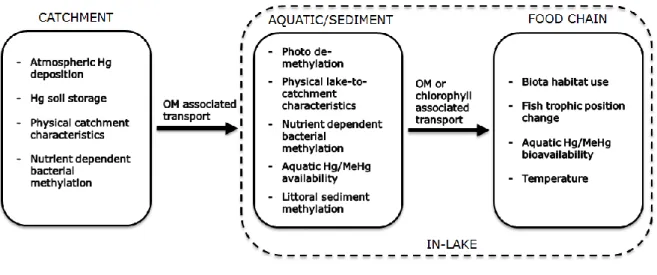
In remote areas, where no local inputs of Hg exist, catchment loading of Hg to surface waters is shown to dominate over direct on-lake atmospheric Hg deposition. Hence, the factors and mechanisms controlling and affecting accumulation of Hg in freshwater fish, directly and indirectly, can be divided into three sub-groups (see Illustration): i) catchment Hg cycling; ii) aquatic and sediment in-lake processes; and iii) biological food chain processes. In the present thesis significant processes that are influencing Hg concentrations in fish are highlighted in all three sub-groups, with a specific focus on factors driving spatial and temporal trends of Hg concentrations in the aquatic phase and the food chain. Additionally, it is shown how the three sub-groups of processes are strongly interlinked and how, although on different concentration scales, processes are similar in boreal and subarctic regions.
Historically stored Hg is transported from catchment soils to surface waters with dissolved organic matter (DOM) as a transport vector. We show how variations of MeHg and TotHg
5 concentrations in water are strongly correlated to the concentration of DOM on a spatial scale. However, these strong spatial correlations between dissolved organic carbon (DOC), or total organic carbon (TOC), and Hg species are often not present on a temporal scale, thus highlighting the strong relationship between catchment and lake processes. This is also illustrated by the fact that reduced Hg emissions in Europe are not directly reflected in Hg food chain levels, due to catchment retention and soil accumulation of atmospheric Hg input.
Illustration The complexity of processes involved in controlling Hg concentrations in freshwater fish species, here illustrated by the factors and mechanisms highlighted in the present thesis. Factors and mechanisms are divided into subgroups, depending on whether they occur primarily in the catchment (papers 2 and 4), in the lake (in the aquatic phase or the sediments (papers 2, 4 and 7) or in the food chain (papers 4, 5 and 6)) or whether they are responsible for transport interlinking the three subgroups (papers 2 and 6).
The catchment cycling of Hg is further complicated by the fact that in the literature wetlands have been shown to act both as sources and sinks for MeHg. We show here how intermediate nutrient status (assessed by nitrogen concentrations) in surface waters provides the highest MeHg fraction (relative to TotHg). The influence of nitrogen on methylation is likely related to bacterial methylation rather than redox processes, and is an issue that deserves more attention.
One of the most significant advancements in the understanding of in-lake Hg cycling over the last ten years is related to the de-methylation of MeHg. While methylation processes have been a focus for decades, abiotic and biotic processes of de-methylation have only recently been addressed. Surface
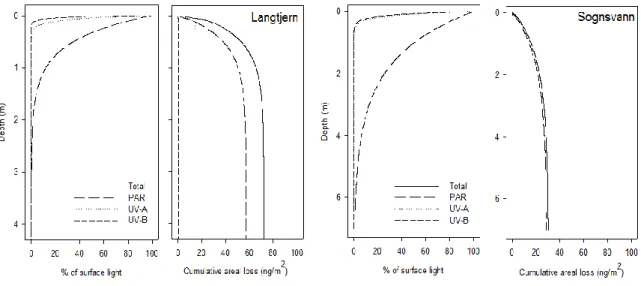
6 waters throughout Northern Europe show trends of increasing DOM levels, which leads to reduced light penetration and reduced photo de-methylation (PD). We show how DOC concentrations affect present PD of MeHg and also how it influences future MeHg budgets of pristine lake catchments in Norway. We found that, if DOC concentrations increase by 20 %, PD loss will decrease by 31 % in a humic lake.
The processes of Hg magnification through the food chain are well understood. However, the issues related to how and where MeHg enters the food chain are less known. Climate driven factors such as temperature and hydrology, as well as deposition of other elements (as nitrogen and sulphur) are thought to indirectly affect the accumulation of Hg in food chains through lake productivity, methylation rates, fish growth and changing habitat use. We show here how invertebrate habitat use and changes in fish trophic position can also significantly influence the concentrations, accumulation and magnification of MeHg in aquatic food chains. Additionally, we suggest that top predators (i.e. top-down pressure on the food chain) in these lakes could significantly change the biomagnification rates of MeHg. Together, these processes will, directly and indirectly, affect present and future concentrations of Hg in Scandinavian freshwater fish.
Although a number of mechanisms are highlighted within this thesis, we struggle to see all the possible mechanisms that are controlling the changing Hg concentrations observed in pristine freshwater fish. While we look for connections and key processes, concentrations of Hg in top predators in these pristine lakes continues to increase. In addition, concentrations vary significantly from year to year, without any clear cause, making it difficult to pinpoint the most important processes. Thousands of lakes worldwide have fish populations with Hg concentrations exceeding health advisory limits. The lack of understanding of all processes involved in controlling Hg accumulation in fish, and also how these processes interlink, limits the ability to predict future levels of Hg in fish under environmental change.
In order to further increase our understanding of what controls Hg concentrations in fish in northern ecosystems, future research needs to be focused on combined effects of climate and pollution (i.e. atmospheric deposition), as well as transport and accumulation processes of MeHg. In particular,
7 a better understanding of factors that drive aqueous MeHg concentrations and bioavailability is critical for improving predictions of bioaccumulation of Hg in those food chains.
8 List of publications
This thesis is based upon the work contained in the following papers:
Paper 1: Hans Fredrik Veiteberg Braaten, Heleen A. de Wit, Christopher Harman, Ulla Hageström and Thorjørn Larssen, 2014. Effects of sample preparation and storage on mercury speciation in natural stream water, International Journal of Environmental Analytical Chemistry, 94, 4, 381-384.
Paper 2: Hans Fredrik Veiteberg Braaten, Heleen A. de Wit, Eirik Fjeld, Sigurd Rognerud, Espen Lydersen and Thorjørn Larssen, 2014. Environmental factors influencing mercury speciation in subarctic and Boreal lakes, Science of the Total Environment, 476-477, 336-345.
Paper 3: Hans Fredrik Veiteberg Braaten, Christopher Harman, Ida B. Øverjordet and Thorjørn Larssen, 2014. Effects of sample preparation on methylmercury concentrations in Arctic organisms, International Journal of Environmental Analytical Chemistry, 94, 9, 863-873.
Paper 4: Markus Lindholm, Heleen A. de Wit, Tor Erik Eriksen and Hans Fredrik Veiteberg Braaten, 2014. Littoral as key habitat for mercury bioaccumulation in a humic lake, Water, Air & Soil Pollution, 225:2141.
Paper 5: Hans Fredrik Veiteberg Braaten, Eirik Fjeld, Sigurd Rognerud, Espen Lund and Thorjørn Larssen, 2014. Seasonal and year-to-year variation of mercury concentration in perch (Perca fluviatilis) in Boreal lakes, Environmental Toxicology and Chemistry, 33, 12, 2661-2670.
Paper 6: Hans Fredrik Veiteberg Braaten, Tor Erik Eriksen, Markus Lindholm, Guttorm Christensen and Thorjørn Larssen. Effects of water chemistry and ecology on the uptake and trophic transfer of methylmercury in boreal and subarctic Norwegian lakes, manuscript.
Paper 7: Amanda Poste, Hans Fredrik Veiteberg Braaten, Heleen A. de Wit, Kai Sørensen and Thorjørn Larssen. Effects of photo de-methylation on the methylmercury budget of boreal Norwegian lakes, accepted for publication in Environmental Toxicology and Chemistry.
9 Abbreviations
AIC Akaike Information Criterion BAF Bioaccumulation factor
BAFZ Zooplankton bioaccumulation factor
C/N Carbon/nitrogen ratio CRM Certified reference material
CVAFS Cold vapor atomic fluorescence spectrometry δ13
C Ratio of heavier to lighter stable isotopes of carbon δ15
N Ratio of heavier to lighter stable isotopes of nitrogen
DI Deionized water
DOC Dissolved organic carbon DOM Dissolved organic matter DMHg Di methylmercury
e.g. Exempli gratia (for example)
EMERGE European mountain lake ecosystems: regionalisation, diagnostic and socio-economic evaluation
EN European Standard
FEP Fluorinated ethylene propylene FLPE Fluoropolymere bottles
GC Gas chromatography
GEM Gaseous elemental mercury GIS Geographical Information System
Hg Mercury
Hg0 Elemental mercury
Hg(II) Inorganic divalent mercury ICD Ice cover duration
i.e. Id est (that is) LOD Limit of detection
10 m.a.s.l Meters above sea level
MDL Method detection limit MeHg Methylmercury
%MeHg Fraction of methylmercury ([MeHg]/[TotHg]*100) MMHg Mono methylmercury
NS Norwegian Standard
OM Organic matter
PAR Photosynthetically actice radiation PD Photo de-methylation
pH Measure of hydronium ion concentration PLS Partial Least Squares
QA/QC Quality assurance/quality control RMSE Root mean square error
SRB Sulphate reducing bacteria TMS Trophic magnification slope TOC Total organic carbon
UNEP United Nations Environmental Programme USEPA United States Environmental Protection Agency UV-A/UV-B Ultraviolet A/Ultraviolet B radiation
WHO World Health Organisation WMS Web Map Services
11 1 Introduction
Mercury (Hg) is a naturally occurring element which has a biogeochemical cycle that involves atmospheric, aquatic and terrestrial compartments throughout the world (Selin, 2009). Over the last few centuries, anthropogenic activities have altered the biogeochemical cycle of Hg (UNEP, 2002). In fact, of the more than 5700 Mg of Hg emitted into the atmosphere every year, 2320 Mg are estimated to be of direct anthropogenic origin and an additional fraction from re-emission (Pirrone et al., 2010). Environmental and health impacts of Hg are however only indirectly related to atmospheric concentrations of Hg species. It is the conversion of inorganic Hg species to the toxic and bioaccumulative organic forms, of which methylmercury (MeHg) is the most important, that is of major concern (Driscoll et al., 2013). Because of the accumulating properties of MeHg, low concentrations in the natural environment can still lead to high concentrations in the top of the food chain. So, although important in the overall budget of worldwide Hg cycling, anthropogenic activities will not be the focus of this thesis. The main goal is to identify and discuss important factors and mechanisms controlling changing Hg concentrations in freshwater environments without local Hg sources, particularly in fish.
1.1 Hg speciation
Identification and quantification of different species of Hg is vital to be able to ascertain toxicity, mobility and bioaccumulation within the environment. The important chemical species of Hg can be divided into elemental Hg (Hg0), inorganic Hg and organic Hg (Leermakers et al., 2005), all of which can be exchanged in and between atmospheric, aquatic and terrestrial systems (Morel et al., 1998).
Hg0, or gaseous elemental Hg (GEM), is volatile, is the most stabile form of Hg in the atmosphere (Schroeder et al., 1993), and can be airborne for approximately 1 year (Slemr et al., 2003). Inorganic Hg is found in oxidation state +1 and +2, where +2 (Hg(II)) is most common in the natural environment. Hg(II) is easily soluble in water and the main form of Hg in aquatic systems (Schroeder et al., 1993). Of the organic forms, mono methylmercury (MMHg, hereafter only MeHg) and di methylmercury (DMHg) are the most common forms (Tessier and Turner, 1995). MeHg is toxic and the most abundant form of Hg in most fish tissues (> 95 %, Bloom, 1992), because the specie
12 biomagnifies through the food chain. The biomagnifying properties of MeHg are due to the ability to accumulate in proteins faster than it is excreted (Trudel and Rasmussen, 2006).
In studies of MeHg biomagnification, the term “bioavailable forms of Hg” (i.e. bioavailability of Hg) is often used. Here, we use the term bioavailability of Hg to describe the Hg and MeHg that is available for uptake into the base of the food chain (Barkay et al., 1997). French et al. (2014), shows that the bioavailability of Hg is highly dependent on OM. In low DOC (< 8.5 mg/L) waters, Hg is mainly associated with fulvic acids and readily taken up and accumulated in the food chain. However, as DOC concentrations increase above 8.5 mg/L, Hg becomes associated with larger and less bioavailable humic acids. As we discuss later on, how Hg is bound in water (e.g. to sulphur, chloride etc.) will also affect the bioavailable and methylating properties of Hg.
1.2 Hg in freshwater ecosystems
In northern freshwater ecosystems with no direct local inputs of Hg contamination, surface water concentrations of Hg are usually low (ng/L, paper 2). In such systems, long-range transported atmospheric Hg is the main source of Hg contamination (Jackson, 1997) and has led to long-term accumulation of Hg in catchment soils (Fitzgerald et al., 1998). Because of the catchment retention, atmospheric inputs of Hg do not correlate directly to Hg in freshwaters (Larssen et al., 2008), and catchment loading of Hg dominate over direct on-lake Hg deposition (Lee et al., 1998, Lee et al., 2000). A large manipulation study in North America (The Mercury Experiment to Assess Atmospheric Loading in Canada and the United States (METAALICUS)), where Hg were added to the catchment as well as the lake, showed that an increase in Hg loading of approximately 7 times the ambient wet deposition gave increased concentrations in biota (30-40 %, including young of the year fish) over a three year period (Harris et al., 2007). Harris et al. (2007) state that “essentially all of the increase in fish MeHg concentrations came from Hg deposited directly to the lake surface. In contrast, <1% of the Hg isotope deposited to the watershed was exported to the lake.” Based on this, the authors suggest that lakes receiving reduced input of Hg from the atmosphere due to increased emission controls, would lower their fish Hg concentrations. The decline in the Hg content of fish would be rapid, as a result of reduced direct deposition to the lake, followed by a slow (centuries) further decline due to
re-13 equilibration of the catchment pools. The size of the initial response to reduced deposition will strongly depend on the lake to catchment ratio.
Since most Scandinavian lakes have a large catchment relative to the lake surface, the findings from the North American manipulation study would imply that only a small initial response to reduced atmospheric input can be expected, and the catchment pools of Hg will be of major importance compared to direct atmospheric deposition to the lake, e.g. Larssen et al. (2008), Lee et al. (2000). From Larssen et al. (2008) (and Lee et al., 2000) it is estimated that pristine catchments can contain pools of Hg 8000 (and 15500) times larger than the annual stream water output and 2000 (and 600) times larger than the input from throughfall and litterfall. The response of reduced atmospheric deposition should therefore be expected to be very slow.
In addition the slow transport of Hg through the catchment, another important reason for the often observed lack of direct relationships between atmospheric deposition of Hg and Hg concentrations in fish is the processes involved in production of MeHg in a lake-catchment system. The MeHg availability in a lake is determined by the balance between processes of methylation (production of MeHg) and de-methylation (degredation of MeHg, Benoit et al., 2003). Through methylation, inorganic Hg is tranformed into toxic and bioaccumulative MeHg (Bloom, 1992). MeHg is accumulated in the aquatic food chain (Trudel and Rasmussen, 2006), and aquatic biota in northern freshwater ecosystems contain elevated concentrations of Hg, related to historical anthropogenic emissions of Hg to the atmosphere (Driscoll et al., 2013). Elevated concentrations of MeHg in aquatic food chains can potentially show harmful effects on organisms (WHO, 1991) and humans (Mergler et al., 2007) through fish consumption (UNEP, 2002).
1.2.1 Hg in freshwater fish
In thousands of North American and Scandinavian freshwater lakes, fish Hg concentrations exceed limits advised for human consumption (0.3 – 0.5 mg/kg Hg wet weight, UNEP, 2002). A compilation of multi-annual studies of Hg levels in terrestrial, freshwater and marine biota in polar and circumpolar areas in North America and Scandinavia, under coordination of the Arctic Council, suggests that neutral and rising trends of Hg are dominating (Riget et al., 2011). Riget et al. (2011)
14 states that data on Hg in fish covering the past one to three decades can be used to illustrate how Hg concentrations have changed in recent times and will also suggest likely near-time future trends. However, only a few time series for freshwater fish were included in the review by Riget et al. (2011). In the present thesis the term trend is used to describe and illustrate how fish Hg concentrations are changing over the past three decades (1990s, 2000s and 2010s) in Norway. Increases in concentrations of Hg in freshwater fish from the 1990s onwards have been documented in Sweden (Akerblom et al., 2012), Finland (Miller et al., 2013), Norway (Fjeld and Rognerud, 2009) and Canada (Ontario, Gandhi et al., 2014), although this rising trend is not found in all regions and for all fish species. Recent studies from lakes in Sweden (Akerblom et al., 2014, Miller et al., 2013) are in fact showing declining concentrations of Hg in fish. However, despite reduced Hg emissions in several world regions (Streets et al., 2011) and reduced or unchanged atmospheric Hg deposition in Northern Europe (Wangberg et al., 2007, Harmens et al., 2008, Torseth et al., 2012) and Canada (Cole et al., 2014), there is little evidence to suggest that Hg contamination in fish is beginning to decline.
Given the mixed results on data considering changing Hg concentrations in fish, there is a clear need for more data considering year-to-year variations. In Gandhi et al. (2014), time trends were considered for different fish species (to incorporate specie-specific differences in accumulation of MeHg (Bhavsar et al., 2010)) and for different time periods (to document changing Hg trends at different decades between 1970 and 2012). It was shown that while fish Hg concentrations from 1970 to 1990 was declining, concentrations in recent decades (time periods 1985-2005 and 1995-2012) were increasing. Overall (1970-2012), patterns were shown to be neutral or declining, depending on the fish species considered (Gandhi et al., 2014a).
1.2.2 Trophic transfer of MeHg
Studies have shown that variations in MeHg exposure and uptake at the base of the food chain drive much of the variation seen in Hg concentrations at higher trophic levels (Chasar et al., 2009, de Wit et al., 2012). However, data on MeHg and dietary markers (stable carbon and nitrogen isotopes) for lower food chain compartments are lacking in the literature (Kidd et al., 2012), and little is known
15 regarding the environmental factors that determine the efficiency for which MeHg is taken up at the base of the food chain.
MeHg concentrations increase with trophic position (Kidd et al., 1995), calculated from the ratio of heavier to lighter stable isotopes of nitrogen (15N/14N = δ15
N, Kidd et al., 1999, Peterson and Fry, 1987). The linear regression between MeHg concentrations (on a logarithmic scale) and δ15N in biota describes the degree of biomagnification, i.e. the mean change in organism MeHg concentration with trophic level. The resulting Trophic Magnification Slope (TMS) is used as an indicator of the potential for biomagnification of MeHg through a food chain (Yoshinaga et al., 1992).
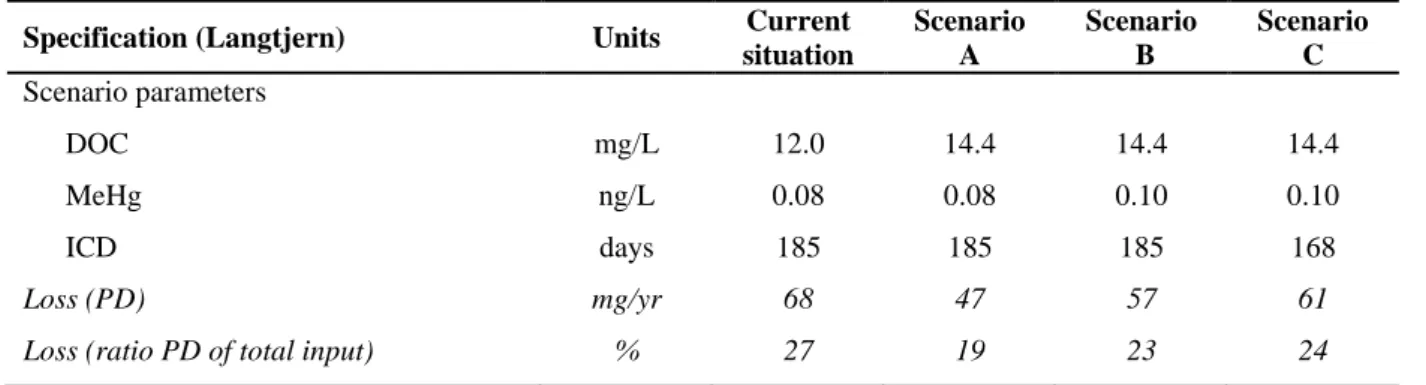
The ratio of stable carbon isotopes (δ13C = 13C/12C) values provide information on the major source of energy for an organism, and are used to determine which food chain the organisms belong to (Post, 2002). The three main lake habitats littoral, pelagial and profundal show contrasting quality of carbon and nutrients (Chetelat et al., 2011), leading to differences in MeHg concentrations of primary consumers depending on which zone they inhabit (Chetelat et al., 2011, paper 4). The supply of MeHg to the food chains is suggested to be affected by factors such as Hg loading (Harris et al., 2007, van der Velden et al., 2013), pH (Watras et al., 1998) and DOC (dissolved organic carbon, Rennie et al., 2005, Chasar et al., 2009).
Both physicochemical and biological factors affect MeHg bioaccumulation (and hence values of TMS). Acidity (Watras et al., 1998), concentrations of dissolved organic matter (DOM, Rolfhus et al., 2011, Chetelat et al., 2011), Hg availability (DeForest et al., 2007, de Wit et al., 2012) and lake productivity (Pickhardt et al., 2002) all affect bioaccumulation rates, as do temperature (Greenfield et al., 2001, Lavoie et al., 2013), growth rates of biota (Dittman and Driscoll, 2009), energy sources (Trudel and Rasmussen, 2006), prey contamination (Trudel and Rasmussen, 2006) and predation effects (Henderson et al., 2012, Jones et al., 2013). A global review of the environmental drivers of TMS identified latitude, DOC and productivity as important drivers, whilst a great deal of unexplained variability remained, highlighting the need for further work (Lavoie et al., 2013).
16 1.2.3 Hg transport, production and fate
DOM measured as DOC is the main transport vector for Hg and MeHg from catchment soils to surface waters (Grigal, 2002). Hg and other trace metals are bound to OM at the acid sites, where, for inorganic and organic Hg, the most common acidic site is thiol groups (Ravichandran, 2004, Amirbahman et al., 2002). The ionic binding between inorganic Hg (Hg+ and Hg2+) and MeHg (CH3Hg
+
) and thiol groups (reduced sulphur) in soil and aquatic OM (Ravichandran, 2004, Skyllberg et al., 2006), leads to mobilisation of Hg species from soils to streams (Mierle and Ingram, 1991) and lakes (Driscoll et al., 1995). Hence, the expression of OM as a transport vector for Hg and MeHg.
Following the arguments above, concentrations of total organic carbon (TOC) and DOC show thus strong spatial correlations with concentrations of Hg in lake surface water in Scandinavia (Meili et al., 1991, Skyllberg et al., 2003, Eklof et al., 2012)and North America (Driscoll et al., 1995, Benoit et al., 2003, Shanley et al., 2008). Fluxes of Hg in lake outlets relative to the catchment storage of Hg are usually small (Grigal, 2002, Grigal, 2003, Larssen et al., 2008), suggesting that leaching of deposited Hg from soils to surface waters is likely to continue for decades to centuries.
Processes of methylation and de-methylation in the catchment and lake determine the aqueous MeHg concentrations. Production of MeHg occurs primarily through methylation of inorganic Hg by sulphur reducing bacteria (SRB) under anoxic conditions (Morel et al., 1998), but is also shown to occur through other mechanisms (Gilmour et al., 2013). Thus the production of MeHg can take place in the catchment wetlands (St. Louis et al., 1994, Tjerngren et al., 2012b), the sediments (Benoit et al., 2003, Gilmour et al., 1998) or in the water phase itself (Xun et al., 1987).
The fraction of MeHg (as MeHg-to-TotHg ratio or %MeHg) is often used as an indicator of the environment’s capability to produce MeHg (cf. methylation potential; McClain et al., 2003, Mitchell et al., 2008a). The methylation mechanism is not understood in detail, but a number of parameters have been identified as important. These parameters include the composition and activity of the microbial community, which depend on sulphur (S) chemistry, availability of inorganic Hg and OM, temperature and pH (Ullrich et al., 2001, Benoit et al., 2003). The role of OM as substrate in the methylation process is related to carbon as an electron donor when sulphate is reduced to sulphide by SRB (sometimes also Fe(III) reduced to Fe(II) by Fe reducing bacteria). The significance of both
17 carbon and sulphate for this process is documented through different stimulation studies, e.g. (Mitchell et al., 2008b) and (Jeremiason et al., 2006).
Factors controlling MeHg production and degradation in the aquatic environment are reviewed in (Benoit et al., 2003) and (Li and Cai, 2013). Benoit et al. (2003) states that although Hg methylation is a function of Hg concentration, the variation of methylation rates is larger than the range in Hg deposition rates, highlighting the importance of other factors as well. Of particular importance are the concentrations of sulphur and sulphide: while the SRB utilises sulphate as energy source through reduction (while oxidising carbon in OM), inorganic Hg is bound to sulphide and diffuses into the cell membrane. Hence, a pattern of increased MeHg concentrations in high methylation rate areas, are often accompanied by reduced sulphide concentrations (Benoit et al., 2003).
In addition, new studies show the importance of nutrient status on MeHg production rates in boreal wetlands (Tjerngren et al., 2012b, Tjerngren et al., 2012a). Although the idea of a nutrient influence on bacterial methylation of Hg is not new (Gilmour et al., 1998), the mechanisms behind the influence are not well understood. Tjerngren et al. (2012a) suggest that the nutrient influence is related to a higher availability of electron donors for methylating bacteria. However, Tjerngren et al. (2012a) shows that as nutrient status increases, also pH increases, and demethylation is favoured over methylation. Additional research on the influence of nutrient status on Hg cycling in general and Hg methylation in particular is clearly of great importance.
The dominant MeHg degradation process in lake systems is thought to be photo de-methylation (Lehnherr and Louis, 2009).
1.2.4 Drivers of Hg in aquatic environments
In 2009 a highly significant trend towards increasing Hg concentrations in freshwater fish in boreal Norway since the 1990s, was discovered (Fjeld and Rognerud, 2009). The documented increase was surprising, as the atmospheric deposition of Hg had decreased (or showed unchanged levels) over the same period due to emission reductions in Europe (Torseth et al., 2012). Environmental features that potentially drive Hg processes in aquatic environments include catchment characteristics, lake
18 chemistry, climate conditions and atmospheric deposition of Hg, S and nitrogen (N), in addition to the biological features already mentioned (see 1.2.2 Trophic transfer of MeHg ).
Catchment characteristics which promote Hg leaching to freshwaters are wetlands and forests. Wetlands act as hotspots for MeHg production (Tjerngren et al., 2012b, St. Louis et al., 1996), while forests have large terrestrial Hg stores related to increased deposition from canopy scavenging of atmospheric Hg (Graydon et al., 2008). Long time-trend data of MeHg are not abundant in current literature, but records from catchments in Sweden, Finland and Canada show that temporal variations in MeHg appear to be related to hydrology and temperature driven changes in Hg methylation rates (Futter et al., 2012).
In freshwaters the elevated concentrations of Hg in fish appear to be particularly connected to humus-rich waters (Hakanson et al., 1988), which makes a connection between the recent rise in surface water DOC (Monteith et al., 2007) and increase in Hg in fish plausible, although the mechanistic explanation for this is unclear. Browning of surface waters may lead to a higher exposure of MeHg and increased energy transfer from land-derived DOC to the lower food chain, reduced MeHg in algae (Luengen et al., 2012) and reduced in-lake losses from PD (Sellers et al., 1996). Chasar et al. (2009), demonstrated that the availability of MeHg at the base of the food chain in streams is a strong determinant of MeHg in top predators. Spatial and temporal variation of MeHg in primary consumers was consistent with variations in exposure to aqueous MeHg and DOC, in addition to diet and nutrient availability in boreal streams (de Wit et al., 2012). A better understanding of factors that drive aqueous MeHg concentrations and bioavailability is therefore critical for improving predictions of bioaccumulation of Hg in the food chain.
1.3 Trends in global Hg emissions
Emissions of Hg to the atmosphere have decreased by approximately 80 % in Europe since the 1980s (Streets et al., 2011). However, due to increased emissions in Asia global emissions of Hg are currently shown to be increasing (Pirrone et al., 2010, Streets et al., 2011). Unless emission controls are widely implemented, this trend is expected to continue in the near future as a large amount of equipment phased out from industrial processes is expected to become Hg-containing waste (Pirrone
19 et al., 2010). In fact, a new study reveals that previously unquantified use of Hg in products and processes (so-called “commercial Hg”), has contributed a large anthropogenic source of Hg to the global environment (Horowitz et al., 2014). In November 2013, the Minamata Convention for Mercury was signed by 93 countries, aiming to protect human health and the environment from adverse effects of Hg at a global scale (UNEP, 2014).
1.4 Objectives
Following the observed increase in concentrations of Hg in freshwater fish in Norway from the early 1990s to 2008 (Fjeld and Rognerud, 2009), the main goal of this project was to confirm the trend (i.e. that 2008 was not an “outlier-year” with respect to Hg concentrations) and find the key explanatory factors and processes. In areas where no local emission of Hg exists, catchment loading of Hg is shown to dominate over direct on-lake atmospheric Hg deposition (Lee et al., 1998, Lee et al., 2000). Hence, the factors and mechanisms controlling and affecting accumulation of Hg in freshwater fish, directly and indirectly, can be divided into three sub-groups (see Illustration): catchment Hg cycling (1); aquatic and sediment in-lake processes (2); and biological food chain mechanisms (3). In the present project we highlighted significant processes in all three groups, with a specific focus on spatial and temporal trends of in-lake and food chain processes. Specifically, addressed are the following questions:
1. Are concentrations of Hg in freshwater fish in Norway still increasing (after 2008), and what are the potential drivers behind such a possible increase?
2. What are the key variables explaining the spatial concentration levels of Hg and MeHg, in addition to methylation potential, in Norwegian surface waters?
3. What are the main biological and physicochemical lake features, affecting the bioaccumulation and biomagnification of MeHg through boreal and subarctic lake food chains?
4. How does photochemical degradation affect concentration levels of MeHg in Norwegian surface waters today and in terms of different future DOC concentration scenarios?
20 Firstly, we documented the spatial distribution of TotHg, MeHg and methylation potential together with potential explanatory environmental variables in 51 Norwegian surface waters where high concentrations of Hg in fish have previously been shown to be an issue (paper 2). Secondly, a subset of the 51 lakes was used to investigate detailed mechanisms responsible for the potentially increasing Hg concentrations in fish (n = 2, paper 5), controlling factors for MeHg biomagnification (n = 4, paper 6), MeHg habitat-specific bioaccumulation (n = 1, paper 4), and the importance of present and future abiotic de-methylation of MeHg (n = 3 plus one additional lake, paper 7).
Thirdly, the importance of different sample treatment methods on analytical results were investigated for water (MeHg and TotHg, paper 1) and biota samples (MeHg, paper 3).
21 2 Materials and methods
2.1 Study sites
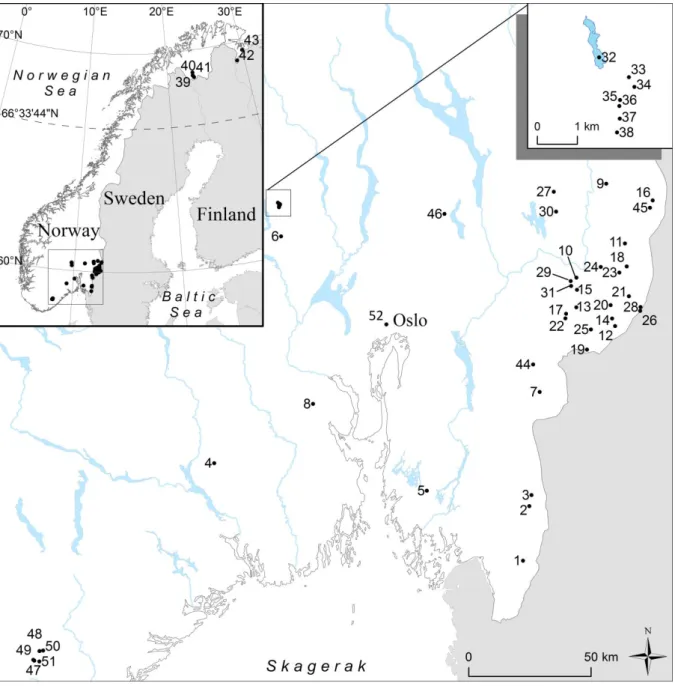
Included in the present thesis is a study of the environmental factors controlling Hg speciation and methylation potential in a total of 52 Norwegian freshwater lakes. The lakes are located in southeast and northeast Norway (Figure 1), and chosen because they represent areas where previous investigations indicate substantial concentrations of Hg in fish (Fjeld and Rognerud, 2009, Fjeld et al., 2010). In some cases fish Hg concentrations are exceeding Norwegian fish advisory limits (0.5 mg/kg, Norwegian Food Safety Authority, 2005). Of the 52 lakes we studied, 51 are included in a study of the environmental factors controlling Hg speciation in surface water (paper 2, lake ID 1-51, Figure 1). Of the 51 lakes from paper 2, we chose five lakes that were studied in more detail. Three of these are typical boreal lakes located in southeast Norway (ID 1 Breidtjern, ID 11 Tollreien and ID 32 Langtjern, paper 4, 5, 6 and 7), while the fourth lake is subarctic (ID 40 Vuorasjavri, paper 6). Additionally, one lake (ID 52 Sognsvann) was included as a clear-water lake for our PD study (paper 7).
The northern lakes (n = 5; ID 39 – 43) are located on a subarctic tundra plain with little topographical differences. The area is dominated by birch forest and wetlands, with average yearly air temperatures below zero (from -0.8 to -3.2 °C). The lakes in the southeast are located within generally forested catchments, dominated by coniferous tree species, with presence of wetland, and in the boreal ecotone. The mean yearly air temperature is above zero for all lakes (n = 47; ID 1 - 38; 44 - 52) in this area (from 1.3 to 5.8 °C).
The chosen lakes represent a wide range of physical catchment characteristics. Included potential explanatory factors for the 51 lakes included in paper 2 are elevation, lake and catchment area, lake-to-catchment ratio, wetland area and wetland-to-catchment ratio (a summary in Table 1). The surface areas of the studied lakes ranged from < 0.01 km2 to 16.6 km2 and the size of the catchment areas span four orders of magnitude from 0.02 km2 to 268.8 km2. The lakes are situated across a wide elevation range, running from 56 to 610 m.a.s.l. Seven of the southern lakes are located in close proximity, i.e. within 5 km2 (Figure 1 inset; ID 32 - 38). Six of these (ID 33 - 38) are small (< 0.02 km2) and are located upstream of the seventh (ID 32). The surface area of the individual lakes,
22 and total wetland area, range from less than 1 % to 32 %, and from 2 % to 29 % of the total catchment area, respectively.
Figure 1 Geographical location of the 52 lakes included in the present study. Numbers on the map refers to lake-ID used throughout the study. The five lakes selected for more in-depth investigations are Breidtjern (ID 1), Tollreien (ID 11), Langtjern (ID 32), Vuorasjavri (ID 40) and Sognsvann (ID 52). Map modified from paper 2.
23 Table 1 Minimum, mean and maximum levels for all catchment characteristics, deposition patterns and climate variables included in paper 2. Data from available lakes (n = 51) are separated into lakes located in the north (n = 5, ID 39-43) and lakes located in the south (n = 46, ID 1-38, 44-51). Table copied from paper 2.
2.1.1 Langtjern
Langtjern (60o37' N, 9o73' E, ID 32, Figure 1), a 0.23 km2 large humic lake situated at 518 m.a.s.l. in the boreal conifer forest region of southern Norway, was one of the main study site for papers 1, 4, 6 and 7. The catchment has been included in the national acid rain monitoring programme since 1972, which includes weekly monitoring of outlet chemistry for major cations and anions (Garmo et al., 2013).
The physical and chemical characteristics of Langtjern are typical for small boreal humic lakes. Maximum and mean depth in Langtjern is 12 and 2 m, respectively, and the summer thermocline is located at approximately 3 m. The catchment area amounts to 4.69 km2, most of which consists of sparse pine forest (63%), mire and bogs (16%) and exposed gneiss bedrocks (16%). The lake is acidic, humic and dystrophic, with a mean annual lake outlet pH, TOC, nitrate (NO3
-) and total
Specification Unit Mean value (minimum, maximum)
Subarctic lakes (n = 5) Boreal lakes (n = 46) Catchment characteristics Lake size km2 0.93 (0.20, 3.37) 0.88 (<0.01, 16.56) Catchment size km2 26.67 (0.93, 60.51) 15.42 (0.02, 268.84) Lake-to-catchment ratio % 8.3 (0.5, 21.5) 7.4 (0.7, 31.6) Wetland area km2 4.50 (0.03, 15.30) 1.14 (<0.01, 18.37) Wetland-to-catchment ratio % 11.4 (3.0, 25.3) 12.0 (1.7, 28.9) Elevation m.a.s.l 246 (56, 371) 307 (60, 610) Deposition patterns Top sediment Hg µg/g 0.16 (0.14, 0.21) 0.36 (0.30, 0.46) N deposition mEq/m2/yr 10.5 (9.9, 11.9) 43.2 (33.7, 63.4) S deposition mEq/m2/yr 8.0 (6.2, 10.7) 13.0 (10.3, 20.8) Climate variables
Run-off mm/yr 316 (312, 324) 489 (230, 944)
Mean annual
temperature ° C -2.3 (-3.2, -0.8) 3.6 (1.3, 5.8)
24 phosphorous (Tot-P) concentration for 2009 to 2011 of respectively 5.1, 11.6 mg/L, 12 µg/L and 5 µg/L in the outlet (unpublished data). The area is acid-sensitive and acid deposition has driven the original trout population to extinction. An artificial stocked trout community is re-established, where limited numbers of farmed yearlings have been released every third year.
2.1.2 Breidtjern and Tollreien
Breidtjern (59°6’ N 11°40’ E, ID 1) and Tollreien (60°17’ N 12°19’ E, ID 11) are located in southeast Norway (Figure 1), representing pristine boreal areas where previous studies indicate substantial levels of Hg in freshwater fish (Fjeld and Rognerud, 2009, Fjeld et al., 2010). Both lake catchments are dominated by forest with presence of wetlands, and with no agriculture. The two lakes are different in both surface water (0.26 and 0.82 km2) and catchment area (2.1 and 34.7 km2), with Tollreien being the larger lake catchment system.
The mean yearly air temperature and precipitation is typical for southeast Norway; below 6 °C and 900 mm, respectively. Chemical deposition patterns reveal the typical south-north gradient of deposition seen in Norway, with higher deposition rates of N and S in Breidtjern (the lake located furthest south, 58.6 and 17.7 mEq/m2/yr, respectively) compared to Tollreien (35.7 and 10.8 mEq/m2/yr, respectively). On the other hand there is little difference in the top sediment Hg concentrations (0.30 and 0.33 µg/g, respectively for Breidtjern and Tollreien) and loading of Hg to the two lakes are assumed similar. This is confirmed with patterns of Hg concentrations in moss (Hylocomium splendens, Harmens et al., 2010).
Top consumers of the lake’s food chains were perch (Perca fluviatilis) in Breidtjern, and perch and pike (Esox Lucius) in Tollreien.
2.1.3 Vuorasjavri
Vuorasjavri (68°58’ N 23°11’ E, ID 40) was selected to represent the subarctic region (Figure 1). The lake location is dominated by birch forest and wetlands. It is the largest lake (3.4 km2) and catchment (47.7 km2) of the five lakes included for in-depth analysis. The loading of Hg to the lake (top sediment Hg concentration is 0.14 µg/g), and deposition of N (10.2 mEq/m2/yr) and S (6.3 10.2 mEq/m2/yr) are
25 the lowest in the study, reflecting the significantly lower deposition of these compounds normally seen in northern Norway (i.e. subarctic areas). Air temperature and precipitation is also lower than in the south, representing the tundra plain described previously.
Top consumers were perch, pike, arctic charr (Salvelinus alpinus) and burbot (Lota lota) in the Vuorasjavri food chain.
2.2 Sampling 2.2.1 Water sampling
Water sampling during the ice-covered winter period (between November and April) was conducted using a water sampler (Ruttner, 1 L) at an approximate depth of 1 m below ice cover. The water sampler was cleaned with acid (1 % trace level grade hydrochloric acid, HCl) followed by rinses with deionized water (DI). Concentrations of TotHg and MeHg were measured in DI water added to the sampler after cleaning and the concentrations were found satisfactory (TotHg < method detection limit (MDL), MeHg < MDL). Samples collected during ice-free periods were taken at a depth of 1 m. All samples were collected using 250 mL fluoropolymere (FLPE) bottles, following ultraclean sampling procedures to avoid contamination (USEPA, 1996). Unless otherwise specified, all samples were collected at the centre of the lake.
All sampling bottles used throughout this study were previously unused and pre-tested for traces of TotHg (quality tested by Brooks Rand Labs; mean TotHg concentrations = 0.02 ng/L). As discussed in paper 1, TotHg and MeHg were sampled in individual bottles to avoid errors caused by loss of Hg during preservation (Parker and Bloom, 2005, paper 1). Samples were stored cold and kept in double plastic bags. Preservation techniques are based on United States Environmental Protection Agency (USEPA) method 1630 for MeHg (USEPA, 1998) and method 1631 for TotHg (USEPA, 2002). HCl (concentrated trace level grade, 1 mL) was added to yield a 0.4 % solution for the MeHg samples. All samples used for TotHg analysis were oxidized with bromine monochloride (BrCl) within 48 hours after sampling. Samples collected for general water chemistry were collected at the same time and depths as the Hg samples, but in individual bottles (500 – 1000 mL).
26 2.2.2 Fish sampling
Sampling of fish for papers 5 and 6 focused on populations of perch (Perca fluviatilis) as this specie is of major relevance regarding exceeding the Norwegian recommended human consumption limits (Norwegian Food Safety Authority, 2005). Perch is also common in south east Norway and is thus easily caught in an appropriate sample number. The exception from this is Langtjern, where we collected trout as perch is not present.
We caught fish with series of gill nets (1.5 m x 25 m) of different mesh size (5 – 45 mm), so a broad distribution of fish sizes could be targeted. All fish were frozen immediately after sampling and kept at - 18 °C until analysis. Recording of fish data (length, weight and sex) and sampling of muscle tissue, otoliths and operculum were conducted according to the EMERGE (European mountain lake ecosystems: regionalisation, diagnostic and socio-economic evaluation) manual (Rosseland et al., 2001). For fish age determination we used opercula. Fish maturity stage was determined according to a method modified from (Dahl, 1917) and described in (Jonsson and Matzow, 1979).
2.2.3 Lower food chain biota sampling
Zooplankton (littoral and pelagic) was sampled using a 250 µm plankton haul net, towed horizontally through the upper waters (0-2 m). Composition of species was identified in each sample, while chemical analyses were conducted on pooled samples, due to small body size (specific data given in paper 4 and supporting information of paper 6). Littoral zoobenthos were collected by kick sampling, using a hand net with a frame opening of 25 x 25 cm and a mesh size of 0.5 mm that was swept through the water for 20 seconds, while walking slowly backwards and stirring the bottom substrate with the feet. The procedure followed guidelines for sampling and devices for benthic macro-invertebrates in freshwater (EN ISO 10870, 2012). Littoral samples were collected down to 1.0 m water depth, on bottom substrates made up by periphyton, particulate detritus and accumulated flocculated peaty DOM between stones and larger rocks. The zoobenthic communities were species-poor, as is common in humic boreal, and subarctic, lakes of the kind studied in this thesis.
27 2.3 Chemical analysis
2.3.1 Water sample treatment and analysis
The analytical method for MeHg in water was based on USEPA Method 1630(USEPA, 1998) for determining MeHg in water by distillation, aqueous ethylation, purge and trap, and cold vapor atomic fluorescence spectrometry (CVAFS). The method for TotHg followed USEPA Method 1631 for determining Hg in water by oxidation, purge and trap and CVAFS (USEPA, 2002). The MDL was 0.02 ng/L and 0.1 ng/L (3 standard deviations of method blanks) for MeHg and TotHg, respectively. For both species automated systems were used for analysis (Brooks Rand Labs MERX automated systems with Model III AFS Detector). Due to low concentrations of particulate matter all samples were analysed unfiltered.
For every batch of Hg analysis in water (n = 24 individual samples) quality assurance and quality control (QA/QC) measures included method blanks (n = 5), blank spikes (n = 5), sample duplicates (n = 3) and matrix spikes (n = 3). The relative difference of sample duplicates was < 10 % and < 20 % for TotHg and MeHg, respectively. Recovery of blank spikes and matrix spikes were 80 – 120 % for MeHg and 90 – 110 % for TotHg.
Samples for determination of general water chemistry were analysed according to Norwegian Standard (NS) and European Standard (EN-ISO). pH was measured by potensiometry (NS4720); alkalinity was measured by titration (NS-EN-ISO9963); total N (Tot-N; NS4743), total phosphorous (Tot-P; NS-EN1189) and NO3
(NS4745) was measured by spectrophotometry; and sulphate was measured by liquid chromatography (NS-EN-ISO10304-1). TOC was measured by infrared spectrophotometry after high temperature and catalytic combustion to CO2 (NS-EN1484).
2.3.2 Biological analysis
All lower food chain biota samples (except a few samples from paper 4) were extracted and analysed utilising an acid extraction method described in paper 3. The method is based on Hintelmann and Nguyen (2005). In short, samples (minimum 0.03 g) were weighed out, added 10 mL 30 % nitric acid (HNO3) and heated at 60 °C overnight (approximately 15 hours). Before analysis the extraction
28 % potassium hydroxide (KOH) and ethylated before purge/trap and gas chromatography CVAFS analysis and detection as described below.
The analysis method for MeHg is based on USEPA Method 1630 (USEPA, 1998) for determining MeHg by aqueous ethylation, purge and trap, and CVAFS. As described previously, automated systems were used for analysis (Brooks Rand Labs MERX automated systems with Model III AFS Detector). For every batch of MeHg analysis (n = 30 individual samples) QA/QC measures included method blanks (n = 4), sample duplicates (n = 3), matrix spikes (n = 3) and certified reference materials (CRMs, n = 6).
Concentrations of MeHg in blank extractions were 1.0 ± 0.3 pg/mL (mean ± 1 standard deviation). This translates to detection limits (DL) of 1.0 pg/mL or better (3 standard deviations of blank concentrations). The actual limit of detection (LOD) varies depending on the weight of sample available for analysis. For sample weights included in this study (0.02 – 0.15 g), the LOD is in the range of 0.1 – 1.0 ng/g (3 standard deviations). No sample concentrations in the present study were found to be below the LOD.
The certified MeHg concentrations of the CRMs used were 0.355 ± 0.056 mg/kg (± uncertainty), 0.152 ± 0.013 mg/kg and 28.09 ± 0.31 µg/kg for DORM-3 fish protein, TORT-2 lobster hepatopancreas and SRM-2976 mussel tissue, respectively. Samples that were analysed in duplicates were also used for matrix spike samples. Samples chosen for matrix spikes were added 1000 pg (0.1 mL of 10.0 ng/mL MeHg hydroxide; MeHgOH). The relative difference of sample duplicates was always < 10 %, recovery of the CRM within 90 – 110 % and matrix spikes recovery within 75 – 125 %.
More than 90 % of Hg in fish is shown to be present as MeHg (Bloom, 1992), and Hg concentrations in fish were therefore determined as TotHg. Wet samples of muscle tissue were analysed by thermal decomposition and direct atomic absorption spectrophotometry (AAS, Lumex Mercury Analyser RA915). For every 10 samples of Hg analysis, QA/QC measures included method blanks sample duplicates (n = 2) and CRM (DORM-3 fish protein; n = 2). The relative difference of sample duplicates was always < 10 % and recovery of the CRM within 90 – 110 %. If QA/QC measures were not met, samples were re-analysed.
29 2.4 Data sources
Catchment area and wetland area were determined using Geographical Information System (GIS) software (ESRI ArcMap 10.0). The GIS software was used in combination with Web Map Services (WMS) available from The Norwegian Geo Network. Background lake data (i.e. lake size, lake identification number and elevation) were gathered from the National Lake Database of The Norwegian Water Resources and Energy Directorate (NVE).
Deposition data for S and N were supplied by The Norwegian Institute for Air Research (NILU). The data set is based on interpolated data from the period 2007 to 2011 (Aas et al., 2012; samples collected on a daily or weekly basis). Top sediment (0 – 0.5 cm) TotHg concentrations were interpolated by kriging, based on measurement of sediment TotHg in Norway during 2006 – 2008 (Skjelkvåle, 2008). Investigations of lake sediments indicated considerable enrichment of Hg in top sediments compared with preindustrial sediments, and good correlations between contents of moss Hg and Hg in top sediments, indicate that the top sediment TotHg concentrations can be used as a proxy for TotHg deposition (Fjeld et al., 1994).
Temperature and precipitation is presented as the yearly average value for each lake between 1961 and 1990, based on procedures described by World Meteorological Organisation (WMO, 1989). We chose data from the last available standard reference period in climatology as it represents the “normal” climate conditions in a specific area. The data is available from Norwegian Meteorological Institute (eKlima, 2013). Run-off was estimated for each lake based on models from NVE (Beldring et al., 2003) and show the annual average between 1961 and 1990 (NVE, 2013).
2.5 Statistical analysis
All statistical analyses and calculations were performed in JMP 9.0 or JMP 11.0 with a significance level α = 0.05, unless otherwise mentioned. Utilised statistical tests and methods are described in detail in the individual papers, while statistical modelling (paper 2 and 5) are described in the following paragraphs.
30 2.5.1 Spatial water data (paper 2)
To avoid influence from non-normality and reduce heteroscedasticity in the statistical analysis from paper 2, all data variables were tested by the Shapiro-Wilks test. Variables that showed non-normality were transformed to a logarithmic scale and again tested for normality. For variables that did not show normality after a logarithmic transformation the Box and Cox transformation were used to find a power transformation that fitted the response best.
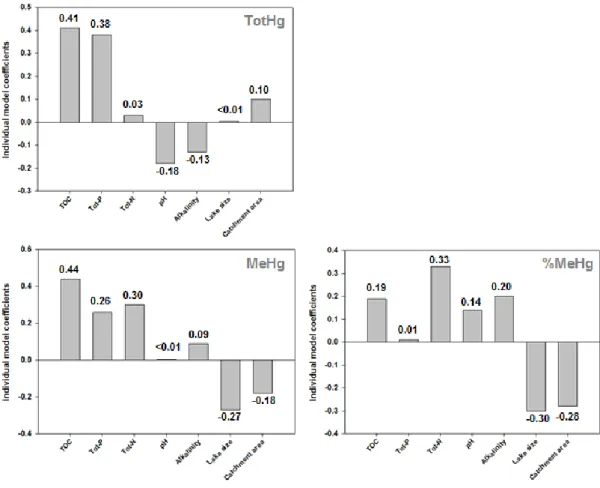
Multivariate correlations between selected variables (predictors) and responses (MeHg concentrations, TotHg concentrations and %MeHg) were explored by Pearson’s correlation coefficient, r. To avoid over-fitted models due to multi co-linearity between our predictors we chose partial least squares (PLS) analysis to model and show the predictors that can best describe the spatial variations of our responses in the studied lakes. The PLS method is designed to include co-linear predictors by constructing new variables underlying the observed predictors. By doing this, most variance in the observed predictors is concentrated in the first new variables and the number of dimensions is effectively reduced (Dormann et al., 2013). The final models are represented by the goodness of fit (r2) and the root mean square error (RMSE) of the linear regression, in addition to individual model coefficients for the selected predictors.
To test for significant differences in lake characteristics between subarctic and boreal catchments, or other groups of lakes/characteristics, Student’s t-tests were used.
2.5.2 Fish data treatment and calculations (paper 5)
When Hg concentration in fish is to be compared between lakes, years and seasons, a length and/or age adjustment is needed due to the strong co-variation between Hg concentration and fish size (i.e. length and weight; Sonesten, 2003, Chasar et al., 2009) and hence, also age (paper 5). To investigate the Hg concentration variations, we utilised a covariance analysis creating a general linear model. Potential explanatory variables to the model included season and year of sampling, as well as the fish characteristics; length, weight, age, sex, maturity stage and δ13C and δ15
N . To evaluate potential changes in the relationship between fish length and Hg concentrations (length*season and
31 length*year) and between fish age and Hg concentrations over time (age*year), interaction terms were also included in the model (also season*year). Additionally, we included the interaction term evaluating change in relationship between δ15N data and Hg concentrations over time (δ15
N*year). Explanatory variables were chosen, evaluated and included in the model based on significance and the Akaike Information Criterion (AIC). To avoid influence from non-normality and reduce heteroscedasticity in the statistical analysis, the numerical data variables fish Hg concentrations, length, weight and age were transformed to a logarithmic scale.
32 3 Results and discussion
3.1 Methodological developments
Despite an increasing focus on low level methods for determination of Hg species in general and MeHg specifically in different matrices over the last decades, few studies have paid attention to direct effects and comparisons of different sample preparation methods. Important aspects of this are preservation techniques for water samples and choice of method for biota extraction and digestion.
3.1.1 Water sample preservation techniques
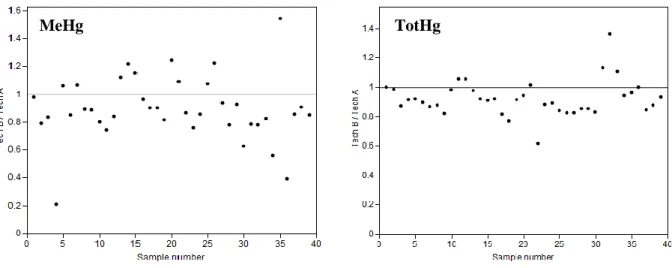
In paper 1 we demonstrate that different preservation techniques give significantly different concentrations of TotHg and MeHg in freshwaters (9 and 14 % on average, respectively, Figure 2). Natural stream samples from a forested lake catchment were studied. Mean stream sample concentrations of TotHg (3.6 ng/L) and MeHg (0.06 ng/L) reflect levels typical for pristine humic boreal catchments.
Two sample preparation techniques were tested, A and B. Technique A involved the use of one bottle (fluorinated ethylene propylene (FEP) 125 mL) for determining both MeHg and TotHg. These samples were preserved with HCl upon arrival at the laboratory (3-5 days after field sampling) and the analysis proceeded by the removal of a sample aliquot (25 mL) for determining MeHg first, before BrCl was added and the remainder of the sample used for determination of TotHg. Technique B involved the determination of MeHg and TotHg in two separate bottles (FLPE, 250 mL). HCl was added to the MeHg bottle just prior to sampling and BrCl to the TotHg bottle upon arrival to the laboratory.
The main causes of the observed differences in TotHg and MeHg concentrations between technique A and B is the use of one instead of two sample bottles and the timing of sample acidification, respectively. Delayed timing of sample acidification (3-5 days after sampling) could possibly cause in-bottle methylation and lead to increased MeHg concentrations (as observed for technique A). For MeHg, the analytical uncertainty value is 10 % (determined as relative percentage difference of sample duplicates), while the mean difference between the two studied sample treatment
33 methods is 14 %. For 80 % of the analysed samples (32 of 40) the relative percent difference between the two sample treatment methods is larger than the 10 % uncertainty.
By using only one bottle for TotHg and MeHg determination, BrCl has to be added to the sample bottle after removing an aliquot for MeHg analysis. Inorganic Hg adheres to the bottle walls during storage and is removed upon the addition of BrCl. However, if a significant percentage of the sample is removed for MeHg analysis, leaving excess inorganic Hg behind on the bottle walls, the result can be a positive bias in the TotHg concentration measured in the remaining sample (as observed for technique A).
Figure 2 Levels of MeHg (left) and TotHg (right) as concentrations obtained by sample preparation technique B divided by concentrations obtained by technique A. Figure copied from paper 1.
3.1.2 Acid extraction of MeHg in biota
The most widely utilised and accepted technique for preparing biological tissue samples for the analysis of MeHg involves an alkaline digestion of the sample (Bloom, 1992, Liang et al., 1996). Recent studies suggest however, that this technique is inadequate to produce satisfactory recoveries for certain biological samples, including fish, fur, feathers and other “indicator” tissues which contain relatively high levels of MeHg (Hintelmann and Nguyen, 2005, Brooks Rand Labs, 2012). Thus an improved acidic extraction method has been proven to produce more satisfactory results for a wide range of biological tissues (Hintelmann and Nguyen, 2005, Hammerschmidt and Fitzgerald, 2008).
34 In paper 3 we compare the two methods on real sample material from different organisms of an Arctic marine food chain, and reveal how this could lead to misinterpretation of analytical results. Results show significantly (p < 0.05) lower concentrations of MeHg using alkaline digestion for large parts of the food chain, especially in fish and birds (Figure 3). The mean differences in concentrations found between the two different methods were 28, 31 and 25 % for fish (Polar and Atlantic cod), seabird (Little Auk) and seagull (Kittiwake), respectively. For samples lower in the food chain (i.e. zooplankton and krill) no significant differences were found. This leads to a clear underestimation of the levels of MeHg found higher up in these food chains, the ratio of MeHg to Hg in biological samples, and thus potentially erroneous conclusions drawn from these results concerning the biological cycling of mercury species. Specifically, this has implications for studies of MeHg biomagnification, through calculations of TMS.
Figure 3 Levels of MeHg in the biological samples as concentration obtained by the acid extraction divided by concentrations obtained by the alkaline digestion. Figure shows Little Auk samples (left) and Polar and Atlantic cod samples (right). The dotted horizontal lines represent the 1:1 relationship between the concentrations obtained by the two sample treatment techniques ([Acid extraction]:[Alkaline digestion]). Samples are sorted by increasing concentrations of MeHg obtained by the acid extraction method from left to right. Figure modified from paper 3.
35 We hypothesize that the main reasons for the observed differences are poor extraction efficiency and/or matrix effects on the ethylation step prior to analysis. This is the first study to examine the effects of these artefacts on real environmental samples covering a complete food chain. Based on the results we conclude that care must be taken when choosing the sample treatment method for analysis of MeHg in biological samples, and that interpretation of results from alkaline digestions should be carried out with caution.
3.2 Hg concentration in Norwegian freshwater fish
Based on the increased fish Hg concentrations documented for perch in southeast Norway between the 1990s and 2008 (Fjeld and Rognerud, 2009), lakes Breidtjern and Tollreien was investigated also for the period 2010 to 2012 (Figure 1, ID 1 and ID11, respectively). Concentrations obtained from 2010, 2011 and 2012 (only autumn data considered, Figure 4) confirm the trend suggested by Fjeld and Rognerud (2009). Although concentrations in 2010 were lower in both Breidtjern (0.31 ± 0.07 mg/kg) and Tollreien (0.42 ± 0.08 mg/kg) compared to concentrations in 2008 (0.39 ± 0.08 and 0.52 ± 0.08 mg/kg, respectively), concentrations in 2011 (0.48 ± 0.09 and 0.37 ± 0.11 mg/kg, respectively) and 2012 (0.44 ± 0.08 and 0.52 ± 0.08 mg/kg, respectively) confirms the trend of increasing concentrations.
Recent literature suggests that concentrations of Hg in fish between the 1970s and today are decreasing or increasing depending on the decades of sampling (Gandhi et al., 2014). Overall (1970-2012) the data from the Great Lakes region in North America shows neutral or declining trends of Hg concentrations (depending of fish species analysed). However, broken down into shorter time periods, the data shows that the trends were decreasing in the early decades (1970-1990), while recent trends are showing increasing concentrations (1985-2005 and 1995-2012). To get a clearer picture of whether the changing concentrations observed in Norway between the 1990s and 2008 (Fjeld and Rognerud, 2009) was because of “outlier-years”, or because it was a general trend of increasing concentrations between the 1990s and today, we studied recent developments in detail.
36 Figure 4 The yearly (autumn data considered) variations of fish Hg concentrations for the Breidtjern and Tollreien perch populations between the 1990s and 2012. Tollreien was sampled in 1990 and Breidtjern in 1991. Error bars represent +/- 95 % confidence interval. Figure is based on data from Fjeld et al., in prep., and because modelling and calculations are based on a different data set (i.e. different fish morphology) than that in paper 5, fish Hg concentrations are not identical with those in Figure 5.
In paper 5 we examined the seasonal and year-to-year variations of Hg concentrations in populations of perch from Breidtjern and Tollreien. Fish Hg concentrations were determined seasonally (spring, summer, autumn) over three years (2010, 2011, 2012), to test the hypothesis that there are substantial changes in fish Hg concentrations throughout the year (seasonal variation) as well as annually. Concentrations were significantly (p < 0.0001) different in the two study lakes, with mean seasonal concentrations varying from 0.24 to 0.36 mg/kg (Breidtjern) and from 0.29 to 0.37 mg/kg (Tollreien, Figure 5). The Hg concentrations of both perch populations showed significant year-to-year (p < 0.0001) and seasonal variation (p < 0.01, see 3.5 for more details on explanatory variables). In both populations concentrations were highest in 2012.
37 Figure 5 The seasonal (spring, summer, autumn) and year-to-year (2010, 2011, 2012) variations of fish Hg concentrations for the Breidtjern (top panels) and Tollreien (bottom panels) populations. Shown are concentrations for all available data (n = 562). Error bars represent +/- 95 % confidence interval. Figure copied from paper 5.
Paper 5 highlights the clear need for yearly studies of fish Hg concentrations, rather than the three-year cycle suggested in the European Water Framework Directive. Avoiding yearly sampling of fish may result in erroneous conclusions regarding fish Hg concentration time trends.
3.3 Catchment Hg cycling
In paper 2 we assessed the environmental drivers of TotHg concentrations, MeHg concentrations, and %MeHg in the synoptic study of 51 lakes in Norway. Concentrations of TotHg and MeHg ranged between 0.5 – 6.6 ng/L and < 0.02 – 0.70 ng/L respectively. The lakes span wide ranges of explanatory environmental variables including; water chemistry, catchment characteristics, climate