Young People
Australia’s
© Commonwealth of Australia 2009
This work is copyright. Apart from any use as
permitted under the Copyright Act 1968, no part may be reproduced by any process without prior written permission from the Commonwealth. Requests and inquiries concerning reproduction and rights should be addressed to the Commonwealth Copyright Administration, Attorney-General’s Department, Robert Garran Offices, National Circuit, Barton ACT 2600 or posted at http://www.ag.gov.au/cca
Foreword
I’m very pleased to be releasing the State of Australia’s Young People: A report on the social, economic, health and family lives of young people. This report presents a comprehensive picture of how young Australians are faring by bringing together data from a variety of sources and drawing on the comments of young people themselves.
Overall the report presents a positive picture, showing how important young people are to our country and why it makes good economic and social sense for governments to invest in lifting outcomes for all young people.
While the report shows that by and large young people are healthy, happy and productive, it also highlights some areas of real concern including:
• Not all young people are on the same footing. Indigenous young people, those not engaged in education or work, young people with a disability and those living in low socio economic households are at serious risk of social exclusion.
• 1 in 4 young people are living with a mental disorder and 1 in 3 young people experience moderate to high levels of psychological distress
• Almost 1 in 3 young people are an unhealthy weight (either over or under weight)
• Male and female teenagers aged 15–19 years had the highest hospitalisation rates for acute intoxication from alcohol among all age groups
• Young people are more likely to become victims of some violent crimes (including sexual offences and assaults) and are less likely than older victims to report a violent crime
The report also highlights emerging issues like the increasing risk that cyber bullying is posing to young people’s wellbeing and underlines the important role that families, education and employment play in young people’s development.
I would like to thank the authors and all the individuals and organisations who contributed to the development of the first State of Australia’s Young People report.
I look forward to considering these findings over the coming months as I work with the Prime Minister and Australian young people to develop a National Strategy for Young Australians.
Kate Ellis
STATE OF AUSTRALIA’S YOUNG PEOPLE:
A Report on the social, economic, health and family lives of young people
Kristy Muir, Killian Mullan, Abigail Powell, Saul Flaxman, Denise Thompson, Megan Griffiths
Report for:
Office for Youth, DEEWR Social Policy Research Centre University of New South Wales October 2009
Social Policy Research Centre Research Team
Dr Kristy Muir, Senior Research Fellow (also Director, Disability Studies and Research Centre, UNSW) Dr Killian Mullan, Research Associate
Dr Denise Thompson, Research Associate Megan Griffiths, Research Associate Saul Flaxman, Research Associate Dr Abigail Powell, Research Associate Professor Peter Whiteford, Professorial Fellow Professor Ilan Katz, Director
Authors
Kristy Muir, Killian Mullan, Abigail Powell, Saul Flaxman, Denise Thompson, Megan Griffiths
Contact Details
Kristy Muir, Senior Research Fellow, Social Policy Research Centre and Director, Disability Studies and Research Centre, University of New South Wales, Sydney NSW 2052, ph 02 9385 7818, fax 02 9385 7838, email k.muir@unsw.edu.au
Contents
1 Executive Summary 12 2 Introduction 20 3 Methodology 21 3.1 Research methods 21 Literature review 21Secondary data collection and analysis 21
Stakeholder consultations 22
4 Who are Australia’s young people? 25
4.1 How many young people live in Australia? 26 4.2 Where in Australia do young people live? 26
4.3 Who do young people live with? 28
Rented, mortgaged or owned outright homes 28
Homelessness 29
4.4 How culturally diverse are young people? 30
Indigenous young people 30
Place of birth 30
Language spoken at home 30
4.5 What are young people’s hopes, aspirations and concerns? 31
4.6 Conclusion 32
Key points: who are Australia’s young people? 32
5 Education 33
5.1 How many young people are in education? 33 5.2 What education level have young people reached when they leave education? 34 5.3 How does the level and quality of education in Australia compare internationally? 35 5.4 Which young people do not fare well in education? 36
Difference between the sexes 36
Geographic location 36
Indigenous young people 38
What’s changed for young people in relation to education? 39
5.5 Conclusion 39
Key points: education 40
6 Employment and income 41
6.1 To what extent are young people working, looking for work, or out of the labour force? 41
Working hours 43
Casual work 44
Occupations 44
Unemployment 45
6.2 What helps young people move from education into work? 46 6.3 What challenges do young people face when transitioning into the workplace? 47
6.4 Income 48
Personal income 48
Household income 51
Youth debt/access to credit 53
6.5 Conclusion 54
7 Domestic work and care 57 How much time do young people spend on domestic and care activities? 57 Does domestic work change depending on the other activities young people do? 57
7.1 Conclusion 58
Key points: domestic work and care 59
8 Negotiating education, work and/or domestic activities 60
Paid work and domestic activity 60
Education and domestic activity 61
Paid work, education and domestic activity 62 Domestic work and care with no study or work 62
8.1 Conclusion 62
Key points: negotiating paid work, education and/or domestic activities 63
9 Technology use 64
9.1 What technologies do young people use? 64
9.2 Which young people are not accessing technology? 65 9.3 What are the benefits and risks of technology use? 65
9.4 Conclusion 67
Key points: technology use 68
10 Social participation: family, friends, leisure and community 69
10.1 Family 69
How much time do young people spend with their family? 69
Quality of family relationships 71
10.2 Friendships 72
How much time do young people spend with friends? 72
10.3 Intimate relationships 73
10.4 Sport and leisure activities 73
Sport and exercise 74
Leisure, work and study 76
Leisure, sport and disability 77
Leisure and cultural diversity 77
10.5 Volunteering 77
How many young people volunteer? 77
Which young people volunteer? 78
Why do young people volunteer? 80
Compulsory ‘volunteering’ 81
10.6 Civic engagement 81
What is civic engagement and how civically engaged are young people? 81 Which young people are most civically engaged? 82
Voting 85
11 Disability, physical and mental health 94
11.1 Physical health 94
How many young people have long-term health conditions? 94
Obesity and eating disorders 94
11.2 Mental Health 95
How many young people have a mental health problem? 96
Psychological distress 97
How many young people have different types of disability and how severe
are the restrictions? 101
11.3 Conclusion 103
Key points: Disability and physical and mental health 103
12 Social issues 104
12.1 Alcohol 104
How many young people drink alcohol and how much do they drink? 104
Risk and alcohol use 107
How old are young people when they first consume alcohol? 108 Which young people consume the most alcohol? 108
What do young people drink? 109
12.2 Smoking 109
How many young people smoke? 110
Which young people are most likely to smoke? 110
Health and young smokers 110
Association with other drugs 110
12.3 Illicit drug-use 110
How many young people have used illicit drugs? 110 Which drugs do young people most commonly use? 111
Are drugs a concern for young people? 111
12.4 Dangerous Driving 112
12.5 Sexual activity 112
How many young people are having sex? 112
Safe sex 113
Teenage pregnancies 113
12.6 Safety, crime and child protection 114
Safety and victimisation 114
Crime 117
Child Protection 118
12.7 Conclusion 120
Key points: social issues 121
13 Conclusion 123
Table of tables
Table 3.1: Data sources: Age range of sample, number of observations, and a brief
description of the usage of the data in the report 22
Table 3.2: Number of focus groups by location and gender and age range of young people 23 Table 3.3: Focus groups with Aboriginal and Torres Strait Islander young people 23 Table 4.1: Living arrangement and tenure status of young people 12–24 years in Australia 28
Table 4.2: Homeless people aged 12–24 years, 2006 29
Table 4.3: Country of birth for young people 12–24 years in Australia 30 Table 4.4: Country of birth and language spoken at home for young people 12–24 years in Australia 31 Table 5.1: Proportion of all young people 12–24 enrolled in education by age and level (per cent) 33 Table 5.2: Education level of young people enrolled in study by age (%) 34 Table 5.3: Educational attainment of young people 15–19 and 20–24 years who are not enrolled in
education in Australia 34
Table 5.4: OECD ranking for reading, maths and science for Australian 15-year-olds and
Indigenous 15-year-olds 38
Table 6.1: Labour force participation of young people in Australia by age and gender 41 Table 6.2: Average annual personal disposable income for young people 15–24 years by main
activity status over one year and average annual personal disposable income for
working age adults 49
Table 6.3: Equivalised household median disposable income and selected poverty statistics for young people 12–24 years in Australia by living arrangement 52 Table 6.4: Equivalised household median disposable income and selected poverty statistics for young
people 12–24 years in Australia by main activity (over one year) and cultural background 53 Table 7.1: Average hours per week in domestic work and care for young men and
women 15–19 years and 20–24 years in Australia 57
Table 7.2: Average hours of domestic work and care for young people by gender, age and other
activity status 58
Table 10.1: Average hours per week young people 15–24 years spend with their families, their
friends and time alone by select characteristics 70
Table 10.2: Average hours per week in a variety of leisure activities, participation rates, and the
average for those participating for young people 15–24 years 74 Table 10.3: Proportion of young people 15–24 years participating in physical activity over a two week
Table 10.7: Distribution of types of civic engagement activities over the period of a year among
young men and women 18–24 years in Australia 82
Table 10.8: Distribution of engagement of young people 18–24 years in specific
civic/governance groups 84
Table 10.9: Distribution of engagement of young people 18–24 years in specific
community-based/social groups 85
Table 10.10: Religious affiliation for young people 12–24 years in Australia 88 Table 11.1: Body mass index group by Indigenous status, 15–24-year-olds (per cent) 95 Table 11.2: Proportion of young people aged 16–24 years experiencing each class of mental
disorder by sex 97
Table 11.3: Levels of psychological distress (Kessler-10 score) for young people aged 16–24 years
by mental disorder prevalence 98
Table 11.4: Levels of psychological distress (Kessler-10 score) for young people 15–24 years
by main activity status 99
Table 11.5: Proportion of young men and women 16–24 years who have ever had suicidal
thoughts, made suicide plans or attempted suicide in Australia 100 Table 11.6: Disability by severity and type among young people 102
Table 12.1: Alcohol consumption of 15–17-year-olds 104
Table 12.2: Alcohol consumption of young men and women 18–24-year-olds 106 Table 12.3: Proportions of young men and women 18–24 years who report alcohol related
problems associated with potential abuse 107
Table 12.4: Total number of 12–18+-year-olds under juvenile justice supervision
in Australia, 2006–07 117
Table 12.5: Total number of 17–24-year-olds in adult prisons in Australia, 2007 118 Table 12.6: Children in substantiations of notifications received in Australia during 2007–08 119 Table 12.7: Children on care and protection orders and in out-of-home care in Australia,
at 30 June 2008 120
Table 13.1: Education, employment and income outcomes by young people’s
demographic characteristics 124
Table 13.2: The likelihood of social, community, substance use and health outcomes
Table of figures
Figure 4.1: Number of young men and women 12–14 years, 15–19 years, and 20–24 years
in Australia 25
Figure 4.2: Number of young people 12–24 years by Australian state and territory 26 Figure 4.3: Living arrangements of young people 12–24 years in Australia 27 Figure 5.1: Educational attainment of young people who are not enrolled in education in
Australia by age (15–19 and 20–24 years; per cent) 35
Figure 6.1: Labour force participation of young people in Australia by age and gender (per cent) 42 Figure 6.2: Average weekly hours per week young people 15–19 years and 20–24 years allocate
to paid work and education 43
Figure 6.3: Average annual personal disposable income for working young people 15–24 years
in Australia 49
Figure 8.1: Average hours per week in paid work, education and domestic/care activities of male
and female 15–19-year-olds 60
Figure 8.2: Hours per week in work, education and domestic/care activities of male and
female 20–24-year-olds 61
Figure 10.1: How young people spend their time 76
Figure 10.2: The importance of religion to Australians across different age groups (0-10 scale) 89 Figure 10.3: Ratings of the importance of religion for young people 15–24 years in Australia
across different religious affiliations 90
Figure 11.1: Prevalence of mental disorders among young people 16–24 years in Australia 96 Figure 11.2: Proportion of all deaths that are a result of suicide for men and women 15–49 years,
Australia, 2007 (five year age bands) 99
Figure 12.1: Number of standard alcoholic drinks usually consumed by young men and
women 15–17-year-olds per drinking day 105
Figure 12.2: Number of standard alcoholic drinks usually consumed by young men and
women 18–24-year-olds per drinking day over 12 months 106
Abbreviations
ABS Australian Bureau of Statistics
AIHW Australian Institute of Health and Welfare
ARACY Australian Research Alliance for Children and Youth ARC Australian Research Council
CALD Culturally and Linguistically Diverse
CIDI Composite International Diagnostic Interview
DEECD Victorian Government Department of Education and Early Childhood Development DEEWR Australian Government Department of Education, Employment and Workplace Relations DSM-IV Diagnostic and Statistical Manual of Mental Disorders, Fourth Edition
FaHCSIA Australian Government Department of Families, Housing, Community Services and Indigenous Affairs
FYA Foundation for Young Australians
HILDA Household Income and Labour Distribution in Australia ICD-10 International Classification of Diseases 10th Revision IHSS Integrated Humanitarian Settlement Strategy NATSIS National Aboriginal and Torres Strait Islander Survey NATSISS National Aboriginal and Torres Strait Islander Social Survey NGO Non-Government Organisation
NSW New South Wales
NSW DOCS New South Wales Department of Community Services NT Northern Territory
NYARS National Youth Affairs Research Scheme OfY Office for Youth
SDAC Survey of Disability, Ageing and Carers SES Socio economic Status
SPRC Social Policy Research Centre UNSW University of New South Wales VET Vocational Education and Training WHO World Health Organization YES Youth Electoral Study
Ch
ap
1 Executive Summary
The Social Policy Research Centre, University of New South Wales, was commissioned in 2009 by the Office for Youth to complete the State of Australia’s Young People report. This report forms part of the first work plan of the Australian Government Office for Youth, Department of Education, Employment and Workplace Relations.
The State of Australia’s Young People describes how young people aged 12–24 years in Australia are faring and identifies those who may need additional support to do well. The report aims to inform the Office for Youth as it develops a National Strategy for Young Australians (Australian Government Office for Youth, 2009). Using a literature review, quantitative secondary data analysis and qualitative data from focus groups with young people and consultations with other key stakeholders, this report provides a clear picture of the overall state of Australia’s young people. It describes who Australian young people are, how they fare in key domains of life, the major issues and challenges they face and the broad contributions they make to Australian society.
After outlining the demographics of Australia’s young people, the report is shaped around main areas that young people participate in and that are critical for their longer-term outcomes: education, employment and income, domestic work and care, technology use, social participation (relationships with family and friends, community participation, volunteering and civic engagement), disability, physical and mental health and social issues. The key findings are below.
Who are Australia’s young people?
Young people aged 12–24 represent one fifth of the Australian population. While most young people live in cities with their parents, almost one in every hundred young person is homeless. Young people are a culturally and linguistically diverse population, with a high proportion of Indigenous young people (compared to the total population), as well as people born overseas and speaking a language other than English at home. Young people have some concerns about the economic climate but are generally confident and optimistic about their future.
• One in five Australians are aged 12–24 years and 28% of all households contain a young person. • Two in three 12–19-year-olds live at home with two parents (66%), and a further 20% live with
one parent.
• Indigenous people account for 3.6% of all 15–19-year-olds and 2.8% of all young people aged 20–24 years.
• One in five Australian young people were born overseas – mostly in Asia (6.6%) or Europe (2.6%). • One in five speak a language other than English at home – mostly an Asian language (10%) or another
European language (4%)
How many young people are in education and what educational attainment do young people have who have already left education?
Ch
ap
te
r
1
In 2006, around 63% of young people aged 12–24 years were engaged in some form of education (43% in secondary school, 20% in tertiary education, and 6% in VET).
• Of the 15-24-year-olds not enrolled in study in 2006 (around 1.1 million), two-thirds had completed Year 12, attained a VET certificate, or completed a university degree. One in five only reached Year 10 or below.
• In 2004, the Year 12 completion rate for school students living in areas in the bottom three tenths of the SES scale was 59%, compared to 79% for the top three (AIHW, 2008c: 122).
• Just over half of all Indigenous 15-19-year-olds are enrolled in education compared to 76% of non-Indigenous 15-19-year-olds (Dusseldorp Skills Forum, 2009).
• Only one-quarter of Indigenous 15–19-year-olds not currently attending school and one-third of 20–24-year-olds have completed Year 12 (Dusseldorp Skills Forum, 2009).
• 14% of Indigenous 20–24-year-olds are in post-secondary education, compared to 35% of non-Indigenous 20–24-year-olds (Dusseldorp Skills Forum, 2009).
To what extent are young people working, looking for work, or out of the labour force?
Almost half of teenagers and two in three young adults are employed. Employment for young people is often on a part-time or casual basis because of the combination of paid work and study. This can help young people transition into full-time work and helps young people avoid living in a household in poverty. Indigenous young people, those from a low SES background and those who have not completed Year 12 are most at risk of being out of the labour force. Unemployment has increased considerably for young people as a result of the recent global economic crisis and young people both in and out of work are concerned about their future employment prospects.
• In 2006, 44% of 15-19-year-olds and 69% of 20-24-year-olds were employed (ABS Census, 2006). • Only 31% of Indigenous teenagers were employed, compared to nearly 44% of non-Indigenous
15–19-year-olds.
• Just under 50% of Indigenous young adults aged 20–24 years were employed, in comparison with 69% of non-Indigenous young adults.
• Indigenous young people who are employed are more likely than their counterparts in the wider Australian population to be in part-time, low-paid, insecure jobs (Dusseldorp Skills Forum, 2009). • The latest seasonally adjusted unemployment rate is 11.9% for 15–24-year-olds (August 2009,
includes young people in education looking for work, ABS, 2009b).
• 26% of Indigenous 15–19-year-olds and 19% of 20–24-year-olds were unemployed in 2006 (Dusseldorp Skills Forum, 2009).
• More Indigenous young people (24%) highly valued getting a job, compared to non-Indigenous young people (16%) (Mission Australia, 2008).
What factors impact on young people’s income?
Young people’s income is closely tied to their participation in employment and education. Although young people who do not work have very low incomes, most are in education and living with their parents. Young women are also likely to have lower incomes than young men. Those at particular risk of poverty are young people living alone, those who do not have family support, and those young people born overseas who do not speak English at home. Generally, however, young people experience a sharp increase in income as they get older and most move into employment. A small but substantial proportion of young people have experience of debt.
Ch
ap
• Levels of personal income steadily increase between 15 and 24 years of age.
• Young women’s income was significantly less than young men’s. At 24 years, women have almost peaked in their earning capacity, while men’s earnings increase considerably as they get older. • Just over half 18–24-year-olds have some consumer debt, mostly car loans or other personal loans,
and about half of those have a credit card.
• About one-fifth of young people with credit cards hardly ever or never pay the full balance every month. • More than a quarter of 12–17-year-olds surveyed in 2007 owed money, and 36% had been in debt
(mostly to parents, family members or friends).
How much time do young people spend on unpaid domestic work and care?
On average, all young people contribute some unpaid domestic work and care within their households. Time spent on domestic activities is largely contingent on the other activities young people undertake, such as education and/or work. However, time spent in domestic work is higher for young women than young men, regardless of the other activities they participate in.
• Young women aged 15–19-years-old spend 6.5 hours in domestic work and care, compared to 4.2 for men in the same age group, while women aged 20–24-year-olds spend 13.3 hours, compared to 4.9 for men.
• Although the time females spend on domestic activities increases as they get older, it barely fluctuates as men age.
• Male 15–19-year-olds, who do not work or study, spend the most time on domestic activities at 21 hours per week. However, male 20–24-year-olds out of work and study only contributing an average of 9 hours per week in domestic work.
• Females who participated in neither education nor paid work had the highest levels of domestic activity at 22 hours for 15–19-year-olds and 53 hours for 20–24-year-olds.
Overall, how productive are young people?
Most young people lead very productive lives. They spend many hours of their week undertaking productive activities – paid work, education and/or domestic and care activities. The time young people spend on productive activities differs by age, gender and on the combinations of activities undertaken. For example, males are spending more time working and in education and fewer hours on domestic work and care activities than their female counterparts. Most females aged 20–years-old who are not working or studying spend long hours on domestic work and care. By contrast, males who are out of work and education are particularly at risk because they are disengaged from almost all productive activities. • Young people who combine paid work, education and domestic activities spend large proportions
of their week on productive activity. 15–19-year-olds in this situation approach or exceed 40 hours per week and 20–24-year-olds approach or exceed 50 hours per week.
• Male and female teenagers aged 15–19-years, who do not work or study, spend approximately 20 hours per week on domestic and care responsibilities.
Ch
ap
te
r
1
To what extent do young people use technology?
New technology has great social, economic and personal benefits for young people, despite documented costs associated with excessive consumption. Most young people are more adept at using new technologies than their older peers and many seem able to negotiate the challenges and potential pit-falls technology presents. However, the small numbers of young people who do not use technology (these are most likely to be young people from disadvantaged backgrounds), either through choice or lack of access, may become increasingly isolated as the importance of technology continues to grow.
• Young people (aged 8–17 years) watched approximately 2 hours of television each day. • In 2007, nine out of 10 Australian families had an internet connection and three-quarters had
broadband internet.
• Young people (aged 8–17 years) spent an average of 1¼ hours online each day.
• Young women were more likely to use the internet for communication; young men were more likely to play computer games.
• In 2007, nine out of ten 17-year-old Australians used a mobile telephone, with young women more likely to have a mobile than young men.
• Young people from non-English speaking backgrounds and young men were less likely to use mobile phones and more likely to report being reluctant to use a mobile phone.
• Young people from relatively poorer areas used their mobile more frequently than those from the relatively wealthier areas.
Why are family relationships and friendships important and how much time do young people spend with family and friends?
Young people, especially those who live at home, spend a substantial proportion of their time with their families and most report having healthy relationships with them. Strong friendships and family relationships are critical for young people’s social and emotional development. Young people who neither study nor work spend the most time with their families. Young people most at risk from social isolation are those without family support who do not study or work, those who do not have friends and young people with a disability. For most young people, friends are more important than intimate relationships, although the nature and importance of such relationships grows with age.
• On average, young people spend 40 hours a week with their family and most report having close relationships.
• Factors impacting on the nature of family relationships include gender, age, location and cultural background.
• Friends are an important source of support for young people and they highly value their social networks.
• Most young people (94%) report having friends they can confide in and, on average spend 20 hours per week with their friends.
Ch
ap
What kinds of leisure activities do young people participate in and how much time is invested in these activities?
As well as spending time with friends, in education and at work, young people are engaged in a range of leisure activities including watching TV, playing computer games, reading, entertainment, hobbies and sport and outdoor activities. Factors impacting on participation in physical activity include gender, engagement in work or education, cultural background, disability, interest and time.
• Leisure time accounts for approximately 24% of 15–19-year-olds time and 21% of 20–24-year-olds time, and as productive time increases (work, education and caring), leisure time decreases.
• Over two-thirds of young people engage in some form of physical activity, although less than half engage in moderate to vigorous exercise, as is recommended.
To what extent do young people volunteer and take part in civic activities?
Most of young people’s productive time is spent in education and/or work, but they also spend some time volunteering and/or taking part in community based civic activities. Young people who volunteer are most likely to be involved in education and those in paid work are still more likely to volunteer than young people who neither work nor study. Age, geographic location and socio economic status can also impact on young people’s propensity to volunteer.
• Around one in three young people volunteer, but the proportion of young people who volunteer regularly is low.
• Reasons young people give for volunteering include: to help others or the community, personal satisfaction, to do something worthwhile, and personal or family reasons.
• Young people do not believe that compulsory programs qualify as volunteering, and many feel exploited and stigmatised by them.
Are young people civically engaged?
Educated young people are more likely to be involved in civic activities. Participation in civic activities is not generally high among young people, but some young people are very proactively involved and engaged. Two of the most common civic activities are voting and, in recent years, looking after the environment. While most young people are enrolled to vote, one in five young people over 18 years are not. Similarly, young people’s response to the environment is predominately concern, but young people’s views are also surprisingly mixed.
• Young people in 2006 were found to be slightly less likely to engage in civic activities than older people. • Only 80% of 18–25-year-olds are enrolled to vote, in comparison with 95% of the eligible population. • Youth is not the only factor in this comparatively low level of enrolment; disadvantage and
marginalisation are relevant as well.
• Young people aged 12–25 years from diverse backgrounds – Indigenous, CALD (culturally and linguistically diverse), low SES, disability, and out-of-home care – are not widely involved in decision-making processes, despite official support.
Ch
ap
te
r
1
Are young people religious?
Young Australians aged 15–24 years were less likely than any other age group to say religion was important in their lives, although the estimates of its importance varied widely according to denomination.
Nevertheless, almost two-thirds of young Australians aged 12–24 years acknowledged a religious affiliation, 23% indicated that they had no religion, and the remaining 13% did not specify any:
• Most identified as Christian (58%), and most Christians were either Catholics or Anglicans. • The largest non-Christian religious affiliation was Islam.
What types of disability and health problems do young people have?
The majority of young people are disability free and generally in good physical and mental health. The total number of young people with a disability is not clear. National surveys report that approximately one in ten young people have a disability. However, given the numbers of young people with a mental disorder, physical health problem and/or cognitive disability, the rate is likely to be much higher. With one in four experiencing a mental disorder, one in three young people under moderate to high psychological distress, and suicide being the leading cause of death for this age group, arguably, mental health is one of the most significant issues facing young people. Mental health problems, along with long-term physical health conditions and physical, cognitive and intellectual disability can affect young people’s well-being and, without adequate supports, can impact on their ability to fully participate in society. • Almost a quarter of young people are either overweight or obese, and Indigenous young people are
more likely to be obese than non-Indigenous youth.
• One in four young people 16–24 years (26%) have a mental disorder in a given year. • 75% of adult mental and substance use disorders begin in childhood or adolescence. • One in three of all young people experience moderate to high psychological distress.
• One in four young people who do not have a mental disorder are experiencing moderate to high psychological distress.
• Young people with high levels of psychological distress are much less likely to be in paid work or education than people with no, low or medium levels of distress.
• Suicide is the leading cause of death for young people. About 8 in every 100,000 young people 15–24 years committed suicide in 2007. Young men are more likely to commit suicide than young women.
How many young people drink alcohol and how much do they drink?
One of the most prevalent social issues among young people is alcohol use. More than half of all 15-17-year-olds and almost all 18-24-year-olds have drunk alcohol. The alcohol consumption levels of young people places a large number at risk of harm according to the 2009 National Health and Medical Research Council (NHMRC) guidelines. Young people aged 15–19-years-old also have the highest rates of hospitalisation for acute intoxication among all age groups.
• Approximately one in five 15–17-year-old males and one in ten 15–27-year-old females report drinking at least once a week.
• Among young people who drink, many consume 5 or more standard drinks on an average drinking occasion (55% males and 30% females 15–17 years; and 52% males and 37% females 18–24 years).
Ch
ap
• A large number of young people are drinking at levels which place them at risk (NHMRC, 2009) (32% of male 15–17 year olds; 21% of female 15–17 year olds; 52% of male 18–24-year-olds; 37% of female 18–24-year-olds).
• Approximately 22% of males aged 18–24 years have an alcohol abuse disorder, compared to 16% of females in the same age group.
To what extent do young people smoke?
Only a small proportion of young people aged 15–17 smoke regularly, although smoking rates increase rapidly when young people reach early adulthood. Young men are more likely to smoke than are young women, Indigenous young people are more likely to smoke than non-Indigenous young people and those who are born in Australia are more likely to smoke than overseas-born young people.
• Just over one in ten young people aged 15–17 years reported smoking cigarettes or other tobacco products. 5% of 15–17-year-olds smoke at least weekly.
• 27% of 18–24-year-olds smoke on a daily basis, compared to 50% of Indigenous young people in the same age group.
How many young people have used illicit drugs and what drugs do they most commonly use? A minority, but still substantial number, of young people have used illicit drugs. Cannabis and stimulants are the most commonly used illicit drugs by 18–24-year-olds.
• Approximately one in five 16-year-olds and two-fifths of 18–24-year-olds had used illicit drugs. • 30% of young people try cannabis for the first time before they reach the age of 15 years. In contrast,
first use of stimulants most frequently occurs between the ages of 19 and 24 years (27%). • About 5% of young people aged 18–24 years are considered to have a cannabis abuse disorder;
4% are considered to have a stimulant abuse disorder. How many young people drive dangerously?
Young people also place themselves at risk by driving dangerously. Car accidents are the second leading cause of death for young people. 20–24-year-old Australians had the highest adjudication rate of all age groups for dangerous or negligent driving.
• Men aged 20–24-year-old were seven times more likely to be involved in adjudication for dangerous or negligent driving than women in the same age group.
• The proportion of young people who reported driving a motor vehicle while under the influence of alcohol decreased from 13.4% to 12.1% between 2004 and 2007.
• Just under 3% of Australians aged 14 years or older reported driving a motor vehicle while under the influence of illicit drugs in 2007.
How many young people have sex and how safe and consensual is the sex?
Unsafe sexual activity is a major risk for young people: one in three young people who had engaged in sexual intercourse reported having unwanted sex at some point in their lives and only two-thirds of
Ch
ap
te
r
1
To what extent are young people victims of crime and how safe do they feel?
Recorded crime statistics show that a minority of young people have been the victims of crime.
Nevertheless, being a victim of crime can negatively impact on health, well-being, perceptions of safety, educational achievement and socio economic attainment. Young people are also more likely than others to be affected by particular crimes, such as violence. Men, young people with disability and Indigenous young people are all more likely to be the victims of violent crime than other young people. Furthermore, regardless of crime levels, almost one quarter of young people feel unsafe walking home alone in their local area at night. Young women and young people with disability are most likely to feel unsafe. How many young people are involved in the criminal justice system?
For most young people involved in criminal activity, the offences are minor and the behaviour is usually short-lived. For young people whose offences are more serious and persistent, crime is strongly associated with disadvantage in other areas of life. Approximately 12,000 young people are under juvenile justice supervision orders, of whom about 650 are in detention centres. Indigenous young people are over-represented in both the juvenile justice system and adult prison population.
To what extent are young people involved in child protection?
Child abuse and neglect is linked to a range of short and long-term negative outcomes including, health and well-being, educational achievement and poverty. Young people who experience abuse are often from marginalised families as well. Younger children and Indigenous young people are both over-represented in the child protection system.
Conclusion
Overall, the picture of Australia’s young people is generally positive. They achieve high levels of educational attainment and performance, many young people are employed and they actively contribute to household domestic work and care. Young people also take part in community based activities, they are represented among Australia’s volunteers and some are civically engaged in a range of other areas. As such, young people are highly productive and make a substantial contribution to Australian society. Most young people successfully balance the competing demands of education, work, domesticity, friends, leisure and community participation. Young people generally rely on family and friends for practical and emotional support.
While this picture illustrates a broadly successful generation of young people, these years can also be enormously challenging, and are often filled with some risk taking. Of particular concern is the number of homeless young people, the prevalence of young people having unwanted and unprotected sex, the prevalence of young people drinking alcohol at risky levels and the high numbers of young people with a mental disorder and/or experiencing psychological distress.
Risk taking and positive outcomes are not equally distributed among young people. Indigenous young people, young people from a low socio economic status background, young people who are neither in work nor study, and young people with a disability are at risk of falling behind the broader population of young people in a range of areas.
Young people with a disability are at particularly high risk. On almost every economic and social measure they are more likely to be excluded and/or at greater risk than young people who do not have a disability. It is likely that this is a result of the high number of young people with mental health problems.
The fact that key demographic characteristics increase young people’s risks across a range of domains indicates that a cross-governmental, coordinated response to support these young people makes sense at a policy and practical level. Given the close relationship between educational attainment, employment and other social, health and substance use outcomes, investing in Australia’s young people has important social and economic implications, not just for young people themselves, but for the country as a whole.
Ch
ap
te
r 2
2 Introduction
The Social Policy Research Centre, University of New South Wales, was commissioned in 2009 by the Office for Youth to complete the State of Australia’s Young People report. This report forms part of the first work plan of the Australian Government Office for Youth, Department of Education, Employment and Workplace Relations.
The Australian Government makes a significant investment in young people through policies, programs and services which offer young people opportunities to participate, a safety net for those at risk of
disengaging and seek to build young people’s skills and capabilities. The Minister for Youth has overarching responsibility to lead the development of youth-specific policy and to oversee and shape the effects of broader government policies on young people. The Office for Youth was established in September 2008 to manage and coordinate these initiatives and is the auspicing body for the report.
There is a considerable amount of existing literature relating to young people in Australia. This report draws on that literature and other data sources to produce a single, comprehensive report which will be used as evidence to inform a National Strategy for Young Australians.
The State of Australia’s Young People describes how young people 12–24 years in Australia are faring and identifies those who may need additional support to do well. The report aims to inform the Office for Youth as it develops the National Strategy for Young Australians (Australian Government Office for Youth, 2009). It also aims to deepen understanding about young people; describe young people as a distinct and important population group; and identify areas of interest and need for consideration by different government agencies.
This report adds to existing information in the field. It does so by analysing the literature, secondary datasets and data from focus groups with young people and consultations with other key stakeholders. The context for this report is set by introducing the main demographic features of Australian young people and then addressing areas of central relevance to the lives of young people. These are divided into areas considered to be of key concern to young people themselves and other relevant stakeholders in their lives. The primary areas are education, employment, income and the economy, relationships with friends and family, and health and well-being. The report also includes sections on community engagement and social issues faced by young people. The report examines how young people are faring generally in these areas and explores which young people are doing well and which young people are facing challenges. It aims to provide a clear picture of the overall state of Australia’s young people, rather than a comprehensive analysis of individual life domains. Due the data availability, the report has a strong focus on young people aged 15–24 years.
Ch
ap
te
r
3
3 Methodology
This research was conducted using three methods. These included a literature review, secondary data collection and analysis, and consultations with stakeholders – focus groups with young people and interviews with other key stakeholders.
3.1 Research methods
Literature review
The report collates and synthesises existing literature on Australian’s young people. This literature comes from a wide range of sources including government and NGO reports and academic research on young people. Relevant literature was identified using a range of methods, including library databases, the internet, snowballing and references obtained from stakeholder interviews. Overall, the literature was drawn from a wide range of fields including, social policy, sociology, health, criminology, employment and education. It considers research addressing a range of geographies, from a national perspective to the local picture.
The literature has been systematically analysed to identify and describe key issues relating to the state of Australia’s young people aged 12–25 years. The literature review also explores the experiences of particular groups of young people, such as Indigenous young people, young people with a disability and young people living in rural areas, and identifies particular groups of young people who are not faring as well as others.
The report also draws upon analysis and reports produced by a number of agencies. The most commonly used resources were produced by the Australian Bureau of Statistics (ABS), Australian Institute of Health and Welfare (AIHW) and Australian Research Alliance on Children & Young People (ARACY).
Secondary data collection and analysis
Secondary datasets have been analysed to provide a coherent national picture of young Australians (12–24 years). A number of data sources containing demographic, social, health, time use and other statistics on young people were used. Datasets were selected that were nationally representative and included the latest available data at the time of analysis (March-May 2009) that covered key life domains for young people. Table 3.1 lists the datasets used and provides some basic information on the age range of young people included in the data, the number of observations and a brief description of the key information drawn from each data set.
Ch
ap
te
r 3
Table 3.1: Data sources: Age range of sample, number of observations, and a brief description of the usage of the data in the report
Data source Age
range (years)
N Brief description of usage in the report
ABS 2006 Census of Population and Housing
12 –24 3,507,200 Provides overall population statistics including information on education and employment, living arrangements, dwelling type, place of birth, and language spoken at home ABS 2005 National Health
Survey
15 –24 3,092 Provides information on alcohol consumption, smoking and exercise
ABS 2006 General Social Survey
18 –24 1,174 Provides information on civic engagement, volunteering, trust, personal safety, disability, and access to credit
ABS 2006 Time Use Survey
15 –24 2,161 Provides information on time use patterns, including time in paid work, domestic work and leisure
ABS 2007 National Survey of Mental Health and Wellbeing
16 –24 1,471 Provides information on problems associated with alcohol and illicit drug use, and mental health conditions
2007 HILDA 15 –24 2,441 Provides data on income and poverty, education and employment patterns for an entire year, and information about victims of crime 2007 HILDA: Self-completed
questionnaire
15 –24 2,055 Provides information on smoking and alcohol consumption for young people 15–17 years, and information on the importance of religion The data used was nationally representative. The datasets were provided by the Australia Bureau of Statistics (ABS), with the exception of the Household Income and Labour Dynamics of Australia (HILDA) dataset. The statistical analyses used for this report are representative of the Australian population. This was done by employing the population weights supplied with the datasets. The nature of the analysis is primarily descriptive, but at certain points multivariate analyses are conducted. Details of these analyses are provided in footnotes in the relevant sections.
Stakeholder consultations
Consultations were conducted with key stakeholders, including young people (via focus groups), and government policy makers, NGO youth sector personnel, youth advocates and academics. Young people focus groups
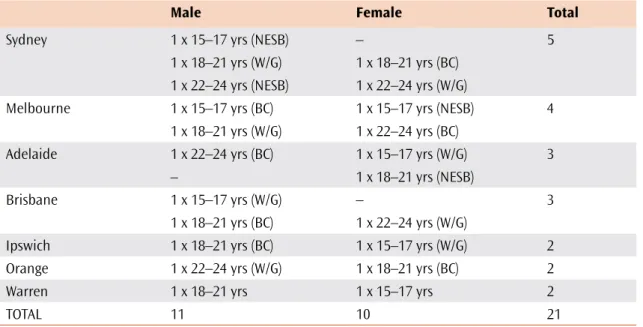
Focus groups were conducted with young people throughout Australia by Elliott & Shanahan Research in April-May 2009. In total, 27 group discussions were carried out over eight locations with five-six young people per group who were between the ages of 16–24 years (Table 3.2 and Table 3.3). In total, 158 young people participated in the focus groups.
Ch
ap
te
r
3
Table 3.2: Number of focus groups by location and gender and age range of young people
Male Female Total
Sydney 1 x 15–17 yrs (NESB) – 5
1 x 18–21 yrs (W/G) 1 x 18–21 yrs (BC) 1 x 22–24 yrs (NESB) 1 x 22–24 yrs (W/G)
Melbourne 1 x 15–17 yrs (BC) 1 x 15–17 yrs (NESB) 4
1 x 18–21 yrs (W/G) 1 x 22–24 yrs (BC)
Adelaide 1 x 22–24 yrs (BC) 1 x 15–17 yrs (W/G) 3
– 1 x 18–21 yrs (NESB)
Brisbane 1 x 15–17 yrs (W/G) – 3
1 x 18–21 yrs (BC) 1 x 22–24 yrs (W/G)
Ipswich 1 x 18–21 yrs (BC) 1 x 15–17 yrs (W/G) 2
Orange 1 x 22–24 yrs (W/G) 1 x 18–21 yrs (BC) 2
Warren 1 x 18–21 yrs 1 x 15–17 yrs 2
TOTAL 11 10 21
Notes: BC = Blue-collar household/occupation W/G = White or grey-collar household/occupation NESB = Non-English speaking background
Table 3.3: Focus groups with Aboriginal and Torres Strait Islander young people
Male Female Total
Sydney 1 x 15–17 yrs 1 x 22–24 yrs 2
Melbourne 1 x 18–21 yrs 1 x 15–17 yrs 2
Wagga Wagga 1 x 22–24 yrs 1 x 18–21 yrs 2
TOTAL 3 3 6
Other consultations
The research endeavoured to interview up to 15 government representatives and 10 NGO youth personnel, youth advocates and academics to capture key issues for young people. Twenty-five key stakeholders were interviewed.
The Australian Government Office for Youth identified up to 25 possible contacts. These contacts included mostly government representatives from commonwealth, state and territory governments, NGO youth sector personnel, youth advocates and academics. In addition, the Social Policy Research Centre contacted a further five non-government organisations that specifically target young people for inclusion in
their programs.
Initial contact with the stakeholders was made either by telephone or email. Stakeholders were reminded that their participation was voluntary. Several of the stakeholders chose at this point to withdraw from a telephone interview. The two main reasons for withdrawing were time constraints and feeling inadequately informed about the research area. Stakeholders contacted by telephone were followed up by email to organise an interview time.
Ch
ap
te
r 3
Twenty-one stakeholders agreed to participate in the study. Eight were government policy makers from commonwealth or state government departments. Nine stakeholders were from NGO organisations that specifically targeted young people. Finally, four stakeholders were either youth advocates or academics involved in research with children and young people.
Stakeholders participated in a semi-structured telephone interview for approximately 30 minutes. A time was organised that suited participants. The same interview schedule was used for all participants and they were sent a copy prior to interview. Telephone interviews were digitally recorded (with participant consent) and notes were written for each interview. All participants signed a UNSW Human Research Ethics’ Committee Participant Information Statement and Consent Form prior to the interview.
Ch
ap
te
r
4
4 Who are Australia’s young people?
To develop an understanding of young people 12–24 years in Australia, it is important to understand their broad demographics. How many young people live in Australia? Where do they live? Who do they live with? What is their cultural background? Are they religious? What do they feel strongly about? What are young people’s hopes, aspirations and concerns? This section answers these demographic and aspirational questions.
4.1 How many young people live in Australia?
Young people 12–24 years account for almost one in five of the Australian population (approximately 3.5 million persons). Figure 4.1 shows that there are slightly more young men than young women. The difference is largest among young people aged 15–19 years.
Figure 4.1: Number of young men and women 12–14 years, 15–19 years, and 20–24 years in Australia
Ch
ap
te
r 4
4.2 Where in Australia do young people live?
The distribution of young people 12–24 years across the eight states and territories of Australia mirrors the distribution of rest of the population, meaning that young people are proportionately represented around the country (see Figure 4.2).
Figure 4.2: Number of young people 12–24 years by Australian state and territory
Source: ABS 2006 Census of Population and Housing
Young people are most likely to live in New South Wales (NSW), Victoria or Queensland. Across the five most populated states, around two-thirds of all young people live in metropolitan areas. In NSW, Victoria and Queensland, approximately 60 per cent of young people live in metropolitan areas, compared to about three-quarters of all young people in both South Australia and Western Australia.
4.3 Who do young people live with?
About 2.8 million households in Australia contain a young person 12–24 years, which is about 28 per cent of all households. Most young Australians live with their parents, but living arrangements differ dramatically for young people in their early twenties. Figure 4.3 shows the proportion of young people living in
Ch
ap
te
r
4
As Figure 4.3 shows, young people in their early twenties are a disparate group with respect to their living arrangements. About 6 per cent live alone and a further 14 per cent live in shared group households. A further 14 per cent of young people 20–24 years reside in couple households with no children. A small proportion of young people living in a household with their partner and child/ren (6%) or alone with their child/ren (2%).
Figure 4.3: Living arrangements of young people 12–24 years in Australia
Source: Authors’ calculations, ABS 2006 Census of Population and Housing
It is important to recognise that young people are likely to be transient in their living arrangements. Young people, for example, may move from living with family, to living with friends, flatmates and/or a partner over a small number of years. Other young people may leave the family home only to return again. These situations were described by the young people in the focus groups:
I shifted back home last week. ... I was living with three friends. The six month lease was up and everyone decided to head back home because of money and stuff. (Male, 18-21-years)
Ch
ap
te
r 4
Rented, mortgaged or owned outright homes
Almost half of all young people (45%) live in owner-occupied mortgaged homes. A further 22 per cent live in homes which are owned outright. The remaining 33 per cent live in rented accommodation.
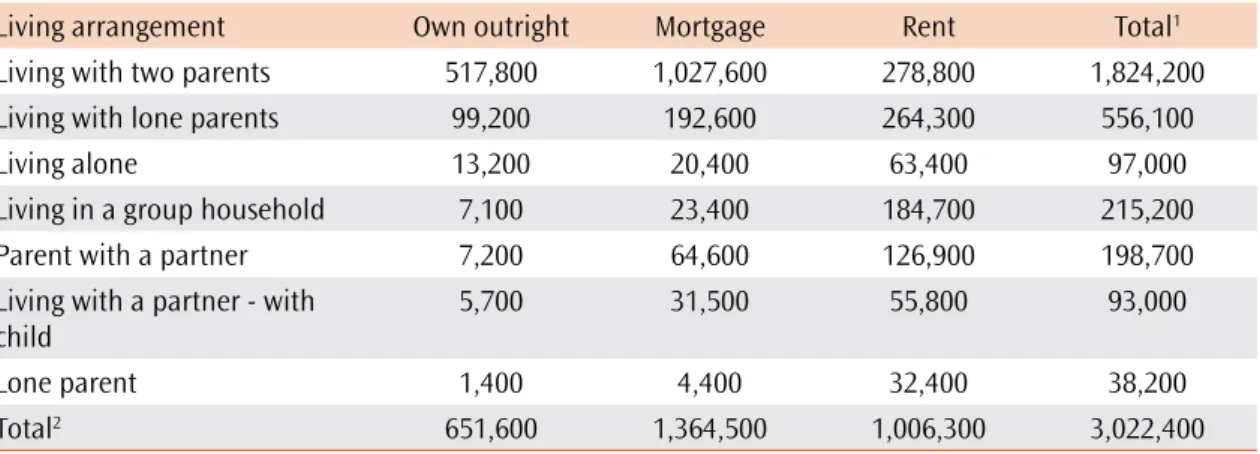
The tenure type young people live in is largely determined by who they live with. As Table 4.1 shows, three-quarters of young people 12–24 years who live in a owner-occupied accommodation with a mortgage live with both their parents (approximately 1 million young people), and a further 14 per cent live with a lone parent.
Just under half of all young people living in lone parent households live in rental accommodation. This compares to 15 per cent of young people living with both parents. The young people most likely to be living in rental accommodation are those who live in group households (82%). Similar proportions of young people living alone and young people living with a partner (both with and without children) are living in rental accommodation (approximately 60%). This may reflect difficulties experienced by young people and young families in attempting to get established in the property market.
Table 4.1: Living arrangement and tenure status of young people 12–24 years in Australia
Living arrangement Own outright Mortgage Rent Total1
Living with two parents 517,800 1,027,600 278,800 1,824,200
Living with lone parents 99,200 192,600 264,300 556,100
Living alone 13,200 20,400 63,400 97,000
Living in a group household 7,100 23,400 184,700 215,200
Parent with a partner 7,200 64,600 126,900 198,700
Living with a partner - with child
5,700 31,500 55,800 93,000
Lone parent 1,400 4,400 32,400 38,200
Total2 651,600 1,364,500 1,006,300 3,022,400
Source: Authors’ calculations, ABS 2006 Census of Population and Housing
1 Row total excludes young people in some other tenure type, not stated or living in non-private dwelling.
2 Column total excludes young people in other family arrangements, not classifiable or living in non-private dwelling.
As can be seen from who young people live with, most young people (79 per cent) are remaining in the parental home at least until they are 24 years of age. This may be a result of delayed departure from full-time education, but it is also associated with broader patterns of increasing financial dependency (Cobb-Clark, 2008) and high housing costs (Flatau et al., 2007). Cobb-Clark (2008) suggests that by living in the parental home, adult children can maintain their consumption levels.
Flatau et al., (2007) also found that education, family background and ethnicity are strongly related to decisions to leave the parental home. They found that young people living in crowded parental homes or homes where parents were mostly absent were likely to leave prior to turning 24 years. Contrarily, those born in non-English speaking countries, those whose first language was other than English and those who went to a Catholic school tend to be less likely to leave the parental home prior to 24 years of age. For young people who participated in the focus groups and who had a sound relationship with their
Ch
ap
te
r
4
Living at home is good because you have all your washing and cooking done for you and you can save money. The bad thing is having someone in your ear all the time. (Female, 18–21-years) You want the best of both worlds. You want to be independent, but at the same time you want someone to look after you. (Male, 22–24-years)
For many young people in the focus groups, the family home represented ‘a comfort zone and a security blanket’. It was also a place where most young people could return home if they needed to (Shanahan and Elliott, 2009).
Homelessness
A number of stakeholders, including young people who took part in the focus groups, raised homelessness among young people as a key area for concern. Homelessness is defined as both absolute (e.g. living on the streets) and relative (e.g. in temporary or emergency accommodation or living in boarding house).
Homeless young people often face multiple disadvantages such as poverty, poor access to health care, low educational participation and poor employment prospects (the Brotherhood of St Laurence, 2008). Homelessness is also linked to family conflict, violence and abuse, social isolation, substance abuse and mental health problems (DEECD, 2008; Chamberlain et al., 2007; Grace et al., 2008; Johnston and Chamberlain, 2008).
How many young people are homeless and which young people are more likely to be homeless? Approximately 32,444 young people aged 12–24 years were homeless on census night in 2006, accounting for 31 per cent of all homeless people (see Table 4.2). This equates to almost one in every hundred young person.
Table 4.2: Homeless people aged 12–24 years, 2006
Age Total Percentage of total
homelessness (%) Female % Male % 12–18 years 21940 21 54 46 19–24 years 10504 10 47 53 A 12–24 years 32444 31 52 48 All homeless 104676 100 44 56
Source: ABS Census, SAAP Client Collection and National Census of Homeless School Students 2006 in Chamberlain and MacKenzie, 2009.
12–18-year-olds accounted for a higher proportion of homeless people than 19–24-year-olds. It is also interesting to note that among 12–18-year-olds, females comprised a higher proportion of homeless people than males. Indigenous young people and young refugees also face a higher risk of homelessness than other young people (ABS, 2006a; Boese and Scutella, 2006).
Falling into and out of homelessness
DEECD (2008) found that homelessness is relatively short-term for some young people, but other young people become ‘chronically homeless.’ Furthermore, the younger and longer people are homeless, the more difficult it becomes for them to move out of homelessness (Chamberlain et al., 2007).
Ch
ap
te
r 4
Appropriate support can reduce the risk of long-term homelessness and its related disadvantages. In 2006–07, 15–24-year-olds comprised 39,300 Supported Accommodation Assistance Program (SAAP)1 clients,
approximately 33 per cent of all SAAP clients (AIHW, 2008b). An additional 18,700 10–17-year-olds were also supported by SAAP as children who accompanied their parent(s) or guardian(s) (AIHW, 2008b). Research addressing the barriers and facilitators for young people transitioning out of homelessness has identified stability, relationships and service provision as key issues. Wilks et al., (2008) found that young people emphasised emotional stability (such as relationships) over material stability (such as accommodation). Relationships can inspire young people to achieve a more secure lifestyle and impact on feelings of acceptance and support. Provision of stable accommodation was found to support emotional security, social inclusion and self-worth and respect. However, willingness to stay in the accommodation provided was affected by affordability, cleanliness, environment and location. Wilks et al., (2008) also found that homeless young people perceive that they have a sense of autonomy and independence, which may impact on how they cope with situations of authority and the housing situations they are willing to take-up.
4.4 How culturally diverse are young people?
Indigenous young people
The proportion of Indigenous young people is high compared to the broader population. Indigenous people account for 2.5 per cent of the Australian population, but Indigenous young people represent 3.6 per cent of all 15–19-year-olds and 2.8 per cent of all young people 20–24 years.
Place of birth
Four out of five young people were born in Australia. Of the one in five born overseas, most were born in Asia (6.6%) followed by Europe (2.6%; Table 4.3).
Table 4.3: Country of birth for young people 12–24 years in Australia
Country of birth Number Percentage
Australia 2,797,000 79.8 NZ and Oceania 69,900 2.0 Asia 231,500 6.6 Europe 91,200 2.6 Africa 64,600 1.8 Americas 22,500 0.6 Not known 230,500 6.6 Total 3,507,200 100.0
Source: ABS 2006 Census of Population and Housing
Language spoken at home
Most young people (79%) speak English at home. The remaining young people speak an Asian language (10%), another European language (4%), or another language2 at home (Table 4.4). The proportions of young people who speak an Asian or European language are higher than the proportion of young people who were born in these countries. This is likely to be a result of second generation Australians speaking their
Ch
ap
te
r
4
As expected, those born in Australia are most likely to speak English at home (91%). Young people born overseas are most likely to speak an Asian language at home (35%), followed by English (29%; Table 4.4). Table 4.4: Country of birth and language spoken at home for young people 12–24 years in Australia
Language spoken at home Born overseas Born in
Australia Total English 207,500 2,550,700 2,758,200 Other European 51,600 85,500 137,100 Asian 246,400 118,700 365,100 Other 19,800 15,900 35,700 Unknown 184,900 26,200 211,100 Total 710,200 2,797,000 3,507,200
Source: ABS 2006 Census of Population and Housing
4.5 What are young people’s hopes, aspirations and concerns?
I’ll have a stable family life, a good relationship with my wife and my kids. It will be chilled. We’ll own our home and a couple of cars … have a good job, not something boring but something I’d be happy doing. (15–17-year-old male)
As part of understanding who Australia’s young people are, it is useful to get a sense of their broad hopes, aspirations and concerns. The focus groups conducted by Shanahan and Elliott (2009) showed that young people are generally characterised by confidence and optimism. They were overwhelmingly confident about their own future. While young people discussed challenges that life had already presented and challenges they foresaw in the future, most strongly believed that they would succeed.
For most focus group respondents, short-term hopes centred on specific goals, such successfully completing secondary or tertiary education; obtaining employment in their preferred industry; or taking time out (in the form of a ‘gap year’, or travelling). Young people’s long-term goals were frequently emotional as well as economic. They most commonly aspired to be happy and to live a life with few regrets. While some young people hoped to acquire great wealth and aspired to owning large homes and expensive cars, respondents overwhelming desired a ‘comfortable’ standard of living rather than extreme wealth. Many respondents believed that financial success and luxury were a potential ‘bonus’ of a successful, fulfilling career rather than an end in themselves. Young people overwhelmingly aspired to a balanced life: a happy relationship; secure, rewarding employment; a ‘comfortable’ standard of living; and, in many cases, children
(Shanahan and Elliott, 2009).
The young people who took part in the focus groups highly valued family relationships, friendships, their health and independence.3 They were also enthusiastic about computers, communication technology, sport and having fun (Shanahan and Elliott, 2009).
Issues identified as being of greatest concern to young people in both the focus group and the survey of 625 young people (Shanahan and Elliott, 2009) were related to the economy. Without prompting, young people were most likely to report being concerned about the economy (22%) and employment (21%). This was followed by health and education (both 15%); environment (11%); and violence (7%); (Shanahan and Elliott, 2009). These concerns were quite different to those identified by respondents of Mission Australia’s National Survey of Young Australians a year earlier. Respondents to this latter survey largely identified health and social issues, such as body image, drugs, family conflict, suicide and personal safety (Mission Australia, 2008). The differences are likely to be related to the global economic crisis and media focus.4
3 Similar to findings from the 2008 Mission Australia survey.
Ch
ap
te
r 4
4.6 Conclusion
Young people (12–24 years) make up one in five of the Australian population. They are most likely to live in cities in the parental home. Of some concern is that almost one in every hundred young person is homeless. Young people are fairly culturally and linguistically diverse with a high proportion of Indigenous young people (compared to the total population), one in five young people born overseas, and one in five speaking a language other than English at home. Despite having some concerns about the economic climate, young people are generally confident and optimistic about their own future and have short-term and long-term goals.
Key points: who are Australia’s young people?
• One in five Australians are 12–24 years of age
• In the five most populated states between 60 and 75 per cent of young people live in metropolitan areas
• 28 per cent of all households contain a young person
• Two in three 12–19-year-olds live at home with two parents (66%), and a further 20 per cent live with one parent.
• Less than one in three 20–24-year-olds live at home with two parents (32%), with a further 10 per cent living with a lone parent.
• Young people in their early twenties who are not living with parents are either living in shared households (14%), with a partner and/or children (14%) or alone (6%)
• Almost half of all young people (45%) live in owner-occupied mortgaged homes. A further 22 per cent live in homes which are owned outright.
• 33 per cent live in rented accommodation. These young people are most likely to be living in group households or with a partner.
• Most (79%) young people remain in the parental home at least until they are 24 years of age. • Almost one in every hundred young people aged 12–24 years were homeless on census night
in 2006.
• 12–18-year-olds are more likely to be homeless than 19–24-year-olds. Female 12–18-year-olds, Indigenous young people and young refugees also face a higher risk of homelessness.
• Indigenous people account for 3.6 per cent of all 15–19-year-olds and 2.8 per cent of all young people 20–24 years.
• One in five young people were born overseas – mostly in Asia (6.6%) or Europe (2.6%). • One in five speak a language other than English at home – mostly an Asian language (10%) or
another European language (4%).
• Young people are generally confident and optimistic about their own future. They have short-term (e.g. education, employment, travel) and long-term goals that are generally characterised by a balance between happiness, establishing their own families, employment and financial security. Young people, however, are concerned about the economy, their future employment prospects and/ or employment stabilit