T A B L E O F C O N T E N T S ➔Key Data ➔Chairman‘s Letter ➔Investor Information ➔Management Report ➔Corporate Governance ➔Financial Statements
➔Report of the Supervisory Board
➔Governance Bodies
➔Ten-Year Financial Summary
➔Dates
➔Glossary
➔
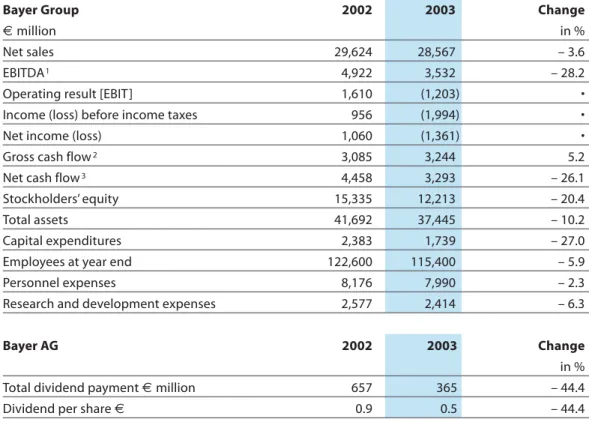
Bayer Group 2002 2003 Change
€ million in %
Net sales 29,624 28,567 – 3.6
EBITDA1 4,922 3,532 – 28.2
Operating result [EBIT] 1,610 (1,203) •
Income (loss) before income taxes 956 (1,994) •
Net income (loss) 1,060 (1,361) •
Gross cash flow2 3,085 3,244 5.2
Net cash flow3 4,458 3,293 – 26.1
Stockholders’ equity 15,335 12,213 – 20.4
Total assets 41,692 37,445 – 10.2
Capital expenditures 2,383 1,739 – 27.0
Employees at year end 122,600 115,400 – 5.9
Personnel expenses 8,176 7,990 – 2.3
Research and development expenses 2,577 2,414 – 6.3
Bayer AG 2002 2003 Change
in %
Total dividend payment € million 657 365 – 44.4
Dividend per share € 0.9 0.5 – 44.4
1 EBITDA = operating result (EBIT) plus depreciation and amortization
2 Gross cash flow = operating result (EBIT) plus depreciation and amortization, less gains on retirements of noncurrent assets, less income taxes, and adjusted for changes in long-term provisions
3 Net cash flow = cash flow from operating activities according to IAS 7
For a download of this table in excel-format please click here.
➔Quick Links
Bayer CropScience Bayer HealthCare
Key Data: Subgroups
➔
Operating Result [EBIT]
€ million 2002 586 2003 2002 2003 Change € million in %
Net external sales 4,697 5,764 22.7 Operating result [EBIT] (108) 324 •
Gross cash flow 516 924 79.1
Net cash flow 1,212 1,165 – 3.9 Capital expenditures 297 413 39.1
2002 2003 Change
€ million in %
Net external sales 9,372 8,871 – 5.3 Operating result [EBIT] 586 334 – 43.0 Gross cash flow 1,013 1,002 – 1.1 Net cash flow 1,575 782 – 50.3 Capital expenditures 476 407 – 14.5
Operating Result [EBIT]
€ million 2002 (108) 2003 324 334
Bayer Polymers
Bayer Chemicals Operating Result [EBIT]
€ million
2002
1,057
2003
(499) Operating Result [EBIT]
€ million 2002 (58) 2003 (1,180) 2002 2003 Change € million in %
Net external sales 4,322 3,400 – 21.3
Operating result [EBIT] 1,057 (499) •
Gross cash flow 473 291 – 38.5
Net cash flow 590 199 – 66.3
Capital expenditures 285 203 – 28.8
2002 2003 Change
€ million in %
Net external sales 10,423 9,897 – 5.0
Operating result [EBIT] (58) (1,180) •
Gross cash flow 1,130 1,029 – 8.9
Net cash flow 1,167 1,042 – 10.7
➔Quick Links ➔Overall Contents
“We are focusing on
innovation and growth“
2003 was an eventful year for our com-pany. I am sure that you, too, remember the nervousness associated with the fall in the price of our stock to 10 euros at the time of the first Baycol trial. Since then, things have taken a turn for the bet-ter – thanks to a great deal of productive activity in recent months.
In my letter a year ago, I reported on the progress of our reorganization, which surely was the most extensive in Bayer’s history. Now, I am pleased to confirm that we have successfully completed this project, made possible in part by your approval at the Annual Stockholders’ Meeting. Our holding company structure facilitates the further strategic realign-ment we embarked on last year. The basis of our new strategy is a clear focus on innovation and growth. The question “Quo vadis Bayer?” has been an-swered. In the future we will concentrate on three areas: health care (Bayer Health-Care), nutrition (Bayer CropScience) and high-tech materials (Bayer Material Science).
Bayer has always been an inventor com-pany, and we intend to continue working in research-intensive areas to find innova-tions that can benefit humankind.
We plan to combine our chemicals business – with the exception of H.C. Starck and Wolff Walsrode – and about one third of our polymers business into a new company named Lanxess, which we then aim to list on the stock market by the beginning of 2005. In this way we will improve the pers-pectives for these businesses. As an inde-pendent company, Lanxess will be able to respond more quickly and more flexibly to the challenges facing the European chemi-cals industry.
We firmly believe that the employees will soon feel at home within the new struc-tures, and that being fully independent will strengthen the new company’s self-awareness and sense of purpose.
There is no doubt in my mind that both companies – Bayer and Lanxess – will benefit from the separation. While Bayer’s future core portfolio comprises primarily research-intensive growth businesses, the portfolio of Lanxess consists mostly of cost-driven businesses operating in more mature markets. So it is clear that different business models and different ways of running these activities are essential for long-term success. Another factor is that we have only limited financial and man-agement resources at our disposal. These resources can now be deployed solely to strengthen and evolve our growth-inten-sive core businesses.
Thus the course has been set for the fu-ture. We have successfully implemented the new structure, realigned our corpo-rate stcorpo-rategy, and also streamlined our balance sheet.
It is, of course, a matter of great regret that we have had to take such high im-pairment charges as a result of the strate-gic realignment and of changes in our op-erating environment, particularly in the industrial businesses. This shows quite clearly that some of the acquisitions we made in the past did not prove as
success-ful as we had hoped. And these charges are also the reason why, for the first time in Bayer’s history, we have to report a sig-nificant net loss of€1.4 billion.
In saying this, however, we should not overlook the remarkable progress we made on the operating side in 2003. Let me give you a few examples:
We improved our operating result by 67 percent before the special items men-tioned, and thus achieved the perform-ance target we had set ourselves a year
Werner Wenning Chairman of the Board of Management of Bayer AG
➔Quick Links
ago – despite difficult economic condi-tions and negative currency effects. Our life science businesses, HealthCare and CropScience, contributed the most to this earnings improvement.
Our main controlling parameter, the gross cash flow, advanced by 5 percent to €3.2 billion. This testifies to our financial strength, which was unaffected by the non-cash impairments.
We again augmented our numerous effi-ciency improvement programs and now expect to achieve sustained savings of more than €2.5 billion by 2005.
In addition, we reached our stated goal of significantly reducing net debt. Since the acquisition of Aventis CropScience, our net debt has dropped by more than €9 billion to below €6 billion. This in turn gives us greater financial room to maneuver.
It is clear, however, that in view of the net loss for the year, we cannot possibly be satisfied with our showing for fiscal 2003 as a whole.
Despite the loss, we are proposing to pay a dividend for 2003 of€0.50 per share. This underlines our solid cash flow position and demonstrates our wish to take your interests into account by providing the greatest possible dividend continuity.
With this difficult year behind us, let us now focus on the road ahead. The main growth areas we have identified to bring us success in the future are new products from active substance research, the con-sumer health care businesses, the expand-ing markets of Asia, and new technologies such as biotechnology and nanotech-nology. I am convinced that these engines offer tremendous growth and innovation potential across our business portfolio. Take Bayer HealthCare, for example. We stand a good chance of taking our place among the global top three suppliers in all of our health care businesses except phar-maceuticals. In the future we will focus more closely on our competencies and ex-perience in the consumer-oriented over-the-counter medicines, diagnostic self-testing and companion animals busi-nesses, and we plan to expand our activi-ties in these areas. We will position the Pharmaceuticals Division as one of the leading medium-sized pharmaceutical suppliers. With our systematic restructur-ing and the successful launch of our anti-impotence drug Levitra®, we have taken the first steps toward the necessary strengthening of this business. We can also report progress in our research activities, one example being the current phase III clinical testing status of our Raf kinase inhibitor, a promising cancer drug. We also successfully integrated Aventis CropScience, and we are particularly proud that we were able to gain market share despite the integration process. As the world’s second-leading supplier over-all – and the number one in conventional crop protection – we are already in a neck-and-neck race with the market leader.
Thanks to an outstanding pipeline, we are confident that we will soon become the world’s largest crop protection company. In MaterialScience, too, our business units are among the global leaders. We possess acknowledged cutting-edge technologies and aim to exploit our growth potential in the coming years. This we plan to achieve mainly by investing in Asia, particularly China.
Bayer also benefits from the extensive knowledge of people, animals, plants and materials that we have gained during decades of research. We should not under-estimate the competitive advantages that can accrue from that knowledge, particu-larly in the innovative fields of biotechnol-ogy and nanotechnolbiotechnol-ogy, which often tran-scend subgroup boundaries.
Thus we are working at full speed to shape Bayer’s future. What, then, are our expecta-tions for the coming year?
Assuming that current business conditions do not worsen, we expect to increase the operating result before special items in 2004 in all of our subgroups except Health-Care. There, the effect of the patent expira-tion for our top-selling drug Cipro® proba-bly will not be offset by the earnings ad-vances we expect in the other HealthCare divisions. For the Bayer Group as a whole, we believe we can increase EBIT before special items by more than 10 percent in 2004.
Following the sharp fall in our stock in 2002 and at the beginning of 2003, I am obviously pleased with the recovery we have seen since then. After all, our share price had more than doubled by the end of the year from its low in March, giving an increase of nearly €10 billion in our market capitalization. That is something to build on, even though our stock is not yet where we would like it to be, as I’m sure you will agree.
On behalf of the Board of Management, I would like to thank you for the trust you continued to place in our company in 2003.
I would also like to thank our employees, who in this challenging year once again displayed their skills and their capabilities to the full. I firmly believe we have now laid the foundation for a successful future.
➔Quick Links
➔Overall Contents
Upward trend in stocks
German equity markets improved consid-erably in 2003. The DAX 30 stock index recorded a positive performance for the first time since 1999, gaining about 37 percent on the year, and the Dow Jones EURO STOXX 50 also rose 18 percent. The rally was a response partly to the end of the Iraq conflict and partly to the more optimistic assessments of business prospects by many companies. This brighter outlook was reflected in the fact that the Ifo business climate index rose
eight times in a row in 2003. Increasingly positive economic data, particularly from the United States and Asia, supported the trend.
Bayer stock, too, performed strongly in this environment. The year-end price of €23.22 was 13.5 percent above the end of 2002, giving a performance of 16 percent including the dividend. The share price declined in the early part of the year, dropping to a low of€10.28 on March 17, mainly because of the general downward
Stock price shows
marked recovery in 2003
Dividends Paid 1993–2003
Dividend per share (€) Total dividend payment
(€million)
Bayer stock recovered substantially during 2003, posting an overall performance (in-cluding the dividend) of 16 percent. Despite the Group’s net loss for the year, the Board of Management and Supervisory Board are proposing a dividend of€ 0.50 per share. This highlights our strong cash flow position and our expectation that the strategic realignment will significantly boost Bayer’s future earning power.
1993 377 1994 461 1995 541 1996 629 1997 710 1998 747 1999 949 2000 1.022 2001 657 2002 657 2003 365 0.56 0.66 0.77 0.87 0.97 1.40 0.90 0.50 1.02 1.30 0.90
40 50 60 70 80
trend in German equities at that time and the start of the first Baycol lawsuit in Texas. Following a verdict in our favor on March 18, the share price rebounded and had more than doubled by year-end (+126.0 percent). It thus outperformed the DAX 30 (+59.4 percent) in this period.
Dividend of€0.50 per share proposed
The Board of Management and the Super-visory Board believe the Bayer Group’s realignment should raise earning power in the future. To strengthen stockholders’ confidence in our potential, we have de-cided to uphold our policy of dividend continuity, even though the Group re-ported a net loss of€1,361 million for 2003. This strategy is supported by the continuing high level of gross cash flow, which amounted to €3,244 million for the year. At the Annual Stockholders’ Meeting on April 30, 2004 the Board of Management and the Supervisory Board will therefore propose a dividend of€0.50 per share, giving a payout of€365 million and a dividend yield of 2.2 percent based on the 2003 year-end price.
Communication with financial markets intensified
2003 was a challenging year for the Inves-tor Relations team. Events surrounding Baycol in the United States caused consid-erable anxiety among investors in the first half of the year. We succeeded in boosting both institutional and private investors’ confidence in our company through nu-merous one-on-one meetings and road-shows. Our communications activities were honored by IR Magazine, London, which ranked Bayer among the top three in the “Best Crisis Management” category. Dominating the second half of the year was the announcement that we would transfer parts of our chemicals and poly-mers businesses to a new company. Here, too, we arranged investor meetings, con-ference calls and several roadshows to make sure our target groups could obtain the information they required. Many ana-lysts and investors showed confidence in the Bayer Group’s plans to focus on high-growth, innovation-driven operations in the future.
In 2003 we organized 200 individual meetings with investors and analysts, nine investor conferences and 17 roadshows in
➔Quick Links
Bayer Stock Data 2002 2003
Dividend € 0.90 0.50
Earnings per share € 1.45 (1.86)
Cash flow per share € 4.22 4.44
Equity per share € 21.00 16.72
Year-end price* € 20.45 23.22
High for the year* € 40.80 23.85
Low for the year* € 17.45 10.28
Shares issued as of year end million 730.34 730.34
Shares to be issued upon the exercise of warrants million 0.0 0.0
Average daily share turnover on German stock exchanges million 3.8 5.4
Market capitalization at year end € billion 14.9 17.0
Total dividend payment € million 657 365
Price/earnings ratio 14.1 –
Price/cash flow ratio 4.8 5.2
Dividend yield % 4.4 2.2
*Xetra closing prices
Germany and abroad. Discussion focused on the Baycol lawsuits, our pharmaceuti-cals strategy and the realignment of the Bayer Group.
We regard timely communication with all investor groups as a guiding principle of investor relations work. Here, the Inter-net has an increasingly important role to
play. Bayer’s Investor Relations website (www.investor.bayer.com) offers a wide range of up-to-date information, com-plemented by innovative functions such as a free text message service for investor news and an interactive analysis tool. Private investors, too, can follow our investor relations meetings live via web-casts, with all the presentation material posted concurrently on the site.
For a download of this table in excel-format please click here.
Our relaunched investor relations website has received a number of international awards. The Canadian online resource “IR Web Report” voted Bayer’s the best of all the S&P 100 companies’ sites, while the U.K. company Investis ranked us first in its DAX 30 2003 International IR Survey. In January 2004 we received two further top rankings: MZ Consult of the United States awarded our site first place in its
IR Global Rankings, at the same time rating it the best in Europe and in the Conglomerates & Industrials category. A trusting dialogue with stockholders is fundamental to our corporate policy. The Investor Relations team will continue to pursue its goal of ensuring full, frank and timely communication with all investors.
High and Low Prices for Bayer Stock in 2003
€ Jan. 10 12 14 16 18 20 22 24 26 28 30
High and low prices Month-end price
Feb. 11.65
March April May June July Aug. Sept. Oct. Nov. Dec. 16.28 10.28 12.47 16.31 18.03 19.27 18.96 18.55 17.97 20.72 22.12 16.66 22.42 14.3 16.95 18.34 20.6 21.22 21.28 20.86 20.86 22.71 23.58
Management Report 2003
➔ General Business Development ➔ Operating Environment ➔ Performance by Subgroup ➔ Financial Condition
➔Value Management
➔Liquidity and Capital Resources ➔Earnings Performance
➔Asset and Capital Structure ➔Value Added
➔Proposal for Distribution of the Profit ➔Employees
➔Marketing and Distribution ➔Research and Development ➔Risk Management ➔ Future Perspectives ➔Economic Outlook ➔Business Strategy ➔Financial Strategy ➔Objectives for 2004 ➔ Glossary
However, earnings were hampered by net special charges of€2.6 billion, mainly related to the portfolio realignment we initiated in 2003. After these negative one-time effects, we recorded EBIT of minus
€1.2 billion for the year.
With our new Group structure, we now plan to sharpen our focus on core businesses in the fields of health care, nutrition and high-tech materials.
To that end, we intend to place major parts of the polymers and chemicals activities into a new, independent company called Lanxess, to be listed on the stock market by 2005. The remaining businesses of the Polymers and Chemicals subgroups, however, will be combined to form Bayer’s new MaterialScience subgroup.
In the future we intend to direct our financial and management resources primarily toward developing our core activities, most of which are in high-growth, innovative areas where we believe we have potential for expansion. That expansion should be driven by new prod-ucts from our active-substance research, growth in the consumer health business and increasing demand in Asia.
Also contributing to value creation should be our subgroups’ interdisciplin-ary use of technology platforms, activi-ties in the nanotechnology field, and the expansion of biotechnology and genetic engineering. These are important engines of innovation that should help to shape our future.
In connection with the strategic realign-ment, the planned stock market listing of Lanxess and changes in the operating envi-ronment, especially for those businesses that primarily serve the manufacturing industry, we extensively reviewed the valua-tions of all the relevant businesses and assets in line with our previous announce-ment. As a consequence, we recognized a
€1.9 billion charge to EBIT, comprising impairment losses and other valuation adjustments. Of this charge,€1.1 billion relates to Polymers, €0.5 billion to Chemicals and €0.3 billion to HealthCare. Total charges for the industrial business amounted to €1.6 billion, including
€1.0 billion related to the activities to be transferred to Lanxess.
The parts of Bayer Chemicals and Bayer Polymers that are to be transferred to Lanxess are listed as discontinuing operations, as is Bayer HealthCare’s plasma business in light of our strategic decision to divest it.
• Net loss of €1.4 billion due to net special charges of €2.6 billion • Gross cash flow advances 5 percent to €3.2 billion
• Net debt reduced by €2.9 billion to below €6 billion • Portfolio realignment initiated
Net Sales €million 2003 2002 2001 8,806 21,469 8,228 21,396 7,635 20,932 Domestic sales Foreign sales
We significantly improved our operating performance in 2003, with EBIT before special items advancing by €0.6 billion to €1.4 billion. This 67 percent increase was achieved despite an unsatisfactory business environment marked by a weak economy, very unfavorable currency parities and a substantial rise in raw material costs.
➔Quick Links Change in Sales 2002 2003 Reported – 2% – 4% Volumes 0% + 5% Prices – 2% 0% Exchange rates – 5% – 9% Portfolio changes + 5% 0%
Group sales in 2003 declined by 3.6 per-cent, or €1.1 billion, to €28.6 billion due to exchange rate factors, particularly the weakness of the U.S. dollar. In local cur-rencies, however, business improved by 5.0 percent.
EBIT fell from €1.6 billion in 2002 to minus €1.2 billion in 2003. This
€2.8 billion drop in reported earnings is due to a €3.4 billion negative swing in the balance of special items. While EBIT for 2002 was boosted by net special income of€0.8 billion, including the gain from the divestment of Haarmann & Reimer, the 2003 figure contains €2.6 billion in net special charges. Adjusted for the special items set forth below, EBIT climbed by €0.6 billion, or 66.9 percent, to €1.4 billion.
2002 2003 Change
€ milion in %
EBIT 1,610 (1,203)
Impairment losses, valuation adjustments (289) (1,927) Restructuring expenses, other asset write-downs (470) (508)
Portfolio changes 1,905 469
Other special items (364) (619)
Total special items 782* (2,585)
EBIT before special items 828* 1,382 + 66.9
* 2002 figures restated. The restatement relates mainly to 2002 income from product divestments. As of 2003, such divestment gains are classified as special items.
Operating Result [EBIT]
€ million 2003 2002 2001 1,676 1,610 (1,203)
The improvement in operating perform-ance (EBIT before special items) was achieved primarily through cost-saving and efficiency improvement measures that took effect during the year.
Special charges in 2003 comprised mainly impairment losses and valuation adjust-ments, totaling €1.9 billion, that were largely attributable to the strategic realignment of the portfolio and to changes in economic conditions. We also took a total of€0.5 billion in restructur-ing charges and other asset write-downs. The restructuring expenses related chiefly to site consolidations. We recorded special income of€0.5 billion from portfolio measures, principally the divestment of the household products business. The remaining net special charges of
€0.6 billion included a €0.3 billion charge taken on the basis of the final
agreement reached with the majority of insurers in connection with Lipobay/ Baycol, as well as expenses for achieving staff reductions through special early retirement plans and provisions for antitrust risks in the Polymers business area.
The exceptional charges of€1.1 billion for 2002 included €0.3 billion in impair-ment losses for the polyols and fibers businesses and a total of€0.5 billion in restructuring expenses and other asset write-downs. The remaining €0.4 billion in charges for 2002 consisted largely of the expense pertaining to the agreement con-cluded with U.S. federal authorities in the context of an investigation into pharmaceutical product pricing. Positive special items in 2002 comprised a total of€1.9 billion in income from the divestments of Haarmann & Reimer, the
Operating result [EBIT] 1,610 (1,203) •
of which discontinuing operations 760 (1,652)
of which special items from continuing operations 93 (1,064) of which special items from discontinuing operations 689 (1,521)
CFROI 8.3% 9.2%
Gross cash flow2 3,085 3,244 5.2
of which discontinuing operations 416 228
Net cash flow3 4,458 3,293 – 26.1
of which discontinuing operations 461 33
The global economy was highly unstable in the first half of the year due to the con-flicts in the Middle East region, stock market weakness and the high price of oil. Consumer and corporate confidence fell considerably. Toward the end of the third quarter the economy began to recover, spurred by expansionary economic poli-cies in many industrialized countries.
The euro zone, however, turned in a rather poor economic performance over-all. Economic growth for the year as a whole was unsatisfactory, due especially to weak domestic demand. The German economy suffered from declining private consumption as a consequence of concern about income and employment perspec-tives.
Operating Environment
Net Cash Flow
€ million 2003 2002 2001 3,880 4,458 3,293
Gross Cash Flow
€ million 2003 2002 2001 3,009 3,085 3,244
household insecticides business and the housing company Baywoge GmbH, as well as from product divestments made in connection with the Aventis CropScience acquisition.
The non-operating result of minus
€0.8 billion for 2003 included write-downs of€0.3 billion on investments in affiliated companies and a divestiture gain of€0.2 billion. After net tax income of
€0.6 billion, the Group recorded a net loss for 2003 of€1.4 billion.
Gross cash flow improved in 2003 by 5.2 percent year on year to €3.2 billion, mainly due to the increase in earnings from operations. Net operating cash flow, at €3.3 billion, was again at a high level. The net cash flow for 2002 was boosted by improvements in working capital manage-ment. In 2003, we succeeded in keeping working capital at virtually the same level. Net debt was reduced by €2.9 billion, to below €6 billion, thanks largely to the net cash flow and to income from divest-ments.
(EBIT) plus depreciation and amortization 2 Gross cash flow =
operating result (EBIT) plus depreciation and amortization, less gains on retirements of noncurrent assets, less income taxes, and adjusted for changes in long-term provisions 3 Net cash flow = cash flow
from operating activities according to IAS 7
➔Quick Links
In the United States, economic develop-ment was weak at the beginning of the year, especially because of the war in Iraq. Not until the second half of the year were consumer spending and corporate invest-ment markedly boosted by substantial tax cuts and historically low interest rates, along with improved prospects for corporate sales and earnings. Coupled with high government spending for national security, these effects triggered strong economic growth.
The Asian economy was hampered in the first half of the year by a number of politi-cal and economic factors, posting a weaker performance than expected. In the second half, growth accelerated in most Asian countries due to the global recovery. Buoyed by strong exports, some
economies came in well ahead of mid-year forecasts. Japan appears to have over-come its years of stagnation. Although the pace of growth later slowed a little follow-ing a positive trend in the first half, Japan’s economy recorded satisfactory growth for the year as a whole. Following a weak start as a result of the SARS outbreak, China’s economy gained distinct momentum dur-ing 2003, with growth in the full year well above expectations.
Latin America also gradually recovered from a two-year period of weakness, and growth-oriented economic policies in a number of countries laid the foundations for an upswing. With sluggishness in Mexico and Brazil, however, only moder-ate expansion was achieved overall.
In 2003 our business activities were grouped together in the subgroups Bayer HealthCare, Bayer CropScience, Bayer Polymers and Bayer Chemicals, compris-ing the followcompris-ing reportcompris-ing segments:
Subgroup Segments
Bayer HealthCare Pharmaceuticals, Biological Products; Consumer Care, Diagnostics; Animal Health Bayer CropScience CropScience
Bayer Polymers Plastics, Rubber; Polyurethanes, Coatings, Fibers
Bayer Chemicals Chemicals
Performance by Subgroup
Performance by Subgroup 2003 € million Sales 8,871 5,764 9,897 3,400 EBIT 334 324 (1,180) (499) Gross cash flow 1,002 924 1,029 291 Net cash flow 782 1,165 1,042 199 HealthCare CropScience Polymers Chemicalsauthorities in the context of an investiga-tion into pharmaceutical product pricing, net cash flow for the year amounted to
€782 million. The previous year’s net cash flow was boosted by refinements in work-ing capital management.
Salesof the Pharmaceuticals, Biological Productssegment, at €4,745 million, almost matched those of the previous year. In local currencies, sales rose by 11.4 percent.
Operating result [EBIT] 586 334 – 43.0
of which discontinuing operations (111) (353)
of which special items from continuing operations (130) (225) of which special items from discontinuing operations 0 (317)
CFROI 11.4% 13.4%
Gross cash flow* 1,013 1,002 – 1.1
of which discontinuing operations (78) (121)
Net cash flow* 1,575 782 – 50.3
of which discontinuing operations (129) (98)
* for definition see page 4
HealthCare
Salesin the Bayer HealthCare subgroup declined by 5.3 percent to €8,871 million, mainly due to currency factors. Adjusted for portfolio and currency effects, how-ever, business expanded by 9.2 percent.
EBITfell by 43.0 percent to €334 million. Before special items, EBIT increased by 22.3 percent to €876 million. Gross cash flow remained steady at €1,002 million. After disbursements made following an agreement reached with U.S. federal
Pharmaceuticals, Biological Products 2002 2003 Change
€ million in %
Sales 4,767 4,745 – 0.5
of which discontinuing operations 679 613
Pharmaceuticals 3,688 3,635 – 1.4
Biological Products 1,079 1,110 2.9
EBITDA* 164 130 – 20.7
of which discontinuing operations (79) (126)
Operating result [EBIT] (186) (425) – 128.5
of which discontinuing operations (111) (353)
of which special items from continuing operations (333) (515) of which special items from discontinuing operations 0 (317)
CFROI 0.1% 5.0%
Gross cash flow* 4 191 •
of which discontinuing operations (78) (121)
Net cash flow* 484 (163) •
of which discontinuing operations (129) (98)
➔Quick Links
Best-Selling Bayer HealthCare Products 2003 Change
€ million
in % Ciprobay®/Cipro® (Pharmaceuticals) 1,411 0.0
Adalat® (Pharmaceuticals) 676 – 15.5
Ascensia® product line (Diagnostics) 593 – 13.9 Aspirin® (Consumer Care/Pharmaceuticals) 574 – 2.5
Kogenate® (Biological Products) 497 24.3
ADVIA Centaur® system (Diagnostics) 387 13.8 Gamimune® N (Biological Products) 304 – 8.7 Avalox®/Avelox® (Pharmaceuticals) 299 6.8
Glucobay® (Pharmaceuticals) 273 – 4.9
Advantage®/Advantix® (Animal Health) 196 – 4.4
Baytril® (Animal Health) 170 – 7.1
Prolastin® (Biological Products) 166 9.9
Trasylol® (Pharmaceuticals) 157 1.9
Levitra® (Pharmaceuticals) 144 •
Canesten® (Consumer Care) 135 – 4.9
Total 5,982 0.2
Proportion of Bayer HealthCare sales 67.4% The PharmaceuticalsDivision increased
salesby 10.5 percent in local currencies. Driving this growth was the successful introduction of the erectile dysfunction drug Levitra®, which is now being mar-keted in the United States, Europe, numer-ous South American countries and the Asia/Pacific region. In the United States – the most important market – the product had already captured a 16 percent share of new prescriptions by the end of 2003. Levitra® also achieved a gratifying share of new prescriptions in other major markets. The patent dispute with Pfizer is ongoing. Business with the respiratory antibiotic Avalox®/Avelox® continued to expand in a highly competitive environment, with business up by 6.8 percent to €299 mil-lion. In local currencies, sales of this prod-uct rose by 20.4 percent. Sales of the anti-hypertensive drug Adalat® fell back by 15.5 percent to €676 million due to increased generic competition, parti-cularly in the United States. In local currencies, Adalat® sales were down by 7.6 percent. Sales of our anti-infective Ciprobay®/Cipro® remained constant at the high level of€1,411 million, despite the weakness of the U.S. dollar, with sales
in local currencies rising by 14.2 percent. The increase was mainly due to good busi-ness in the United States, especially prod-uct sales to the U.S. generics manufacturer Barr Laboratories and the introduction of the once-daily formulation Cipro® XR to treat urinary tract infections. Following the expiration of the U.S. patent for Cipro®, the Food and Drug Administra-tion extended Bayer’s exclusive right to market the antibiotic Cipro® (for twice-daily administration) in the United States until June 2004. Complementing our cardiovascular risk management portfolio is the inlicensed innovative antihyperten-sive drug Kinzalmono®/Kinzalkomb®, which has been launched in several Euro-pean countries, including Germany and Switzerland.
In the field of cancer research, our Raf kinase inhibitor, developed jointly with U.S.-based Onyx Pharmaceuticals Inc., has reached phase III clinical trials for the treatment of advanced renal cell carci-noma. Our factor Xa inhibitor for the pre-vention and treatment of thrombosis has also done well in trials so far and is cur-rently in phase II clinical testing.
Change in local currencies in % 14.2 – 7.6 – 6.0 8.5 33.4 24.4 4.2 20.4 4.2 11.2 4.4 25.2 18.2 • 6.1 11.9
To further streamline our portfolio, we intend to divest the plasma business of our Biological ProductsDivision. These activities are therefore reported as discon-tinuing operations. The Kogenate® busi-ness is not affected by this decision. Thanks to substantially greater production capacity and volumes sold, business with Kogenate® expanded by 24.3 percent, or
€97 million, to €497 million. Currency-adjusted sales rose by 33.4 percent. Con-tributing to this gratifying increase were gains in market share, particularly in the United States and Japan.
The primary growth market for the Pharmaceuticals, Biological Products segment is North America. Sales in the North America, Asia/Pacific and Latin America/Africa/Middle East regions were impaired by unfavorable currency parities. Business in Europe remained steady year on year.
European pharmaceutical companies are operating in an increasingly difficult environment marked by ongoing cost-containment measures in the health care sector. In the United States, the market continues to develop well. There, too, however, there is a growing debate about ways to reduce expenditure on drugs, for example through reimports. Market growth in Japan was considerably slower than in the United States or Europe. Before special items,EBITfor the segment grew by €260 million in 2003, to €407 million, thanks mainly to the upward trend in the Pharmaceuticals Division and the Kogenate® business of the Biological Products Division. In Pharmaceuticals, the improvement was also aided by cost reductions achieved through production facility closures and relocations and the consolidation of research activities. Additional contri-butory factors in the Biological Products
Pharmaceuticals, Biological Products 2002 2003 Change
External sales by market (€ million) in %
Europe 1,411 1,419 0.6
North America 2,084 2,154 3.4
Asia/Pacific 884 809 – 8.5
Latin America/Africa/Middle East 388 363 – 6.4
Total 4,767 4,745 – 0.5
Consumer Care, Diagnostics 2002 2003 Change
€ million in %
Sales 3,755 3,336 – 11.2
Consumer Care 1,716 1,403 – 18.2
Diagnostics 2,039 1,933 – 5.2
EBITDA* 941 889 – 5.5
Operating result [EBIT] 602 589 – 2.2
of which special items 214 268
CFROI 23.9% 21.5%
Gross cash flow* 827 668 – 19.2%
Net cash flow* 951 719 – 24.4%
➔Quick Links
Division were the optimization of production processes and improved cost structures for Kogenate®. The principal special charges in 2003 – totaling
€756 million – were impairment losses and other valuation adjustments for the plasma business, charges in connection with Lipobay/Baycol, and expenses for the closure of the research center in Kyoto, Japan, and the termination of research activities in Berkeley, California.
Salesof the Consumer CareDivision declined by 18.2 percent, or €313 million, to €1,403 million, mainly due to the divestment of the household insecticides activities and the strength of the euro. Adjusted for portfolio changes and currency effects, however, sales advanced by 11.6 percent. This business thus expanded much faster than the market, which grew by only 3 percent.
In the United States, the main growth market for Consumer Care, we scored major success with the launch of One-A-Day® WeightSmart. This vitamin product posted sales of€60 million in its first year on the market. Sales of the analgesic Aleve® in North America advanced by 18.8 percent in local currencies, boosting our share of the market for over-the-counter pain relievers. U.S. and Canadian sales of Aleve® totaled €89 million after translation.
Salesof the DiagnosticsDivision were down by 5.2 percent, or €106 million, to
€1,933 million. In local currencies, however, business grew by 5.1 percent, with Professional Testing up 10.6 percent and thus clearly outperforming the market, especially in the United States. Deserving special mention is the ADVIA Centaur®, sales of which rose by 24.4 per-cent in local currencies. The market posi-tion of the ADVIA® product line was fur-ther strengthened by the introduction of a new BNP test to assist in the diagnosis of heart failure. Canadian-based Visible Genetics, which we acquired in 2002, has now been successfully integrated, its product line expanding our offering in the field of nucleic acid diagnostics. Sales in Self-Testing receded by 14.2 percent, to
€626 million, due to weaker business in Europe and to lower U.S. numbers after translation. Competitive pressure has intensified in this market. We are confident that the new Ascensia® diabetes care systems we introduced in mid-2003 will help to improve our market position once again. Already successful in the German market is the Ascensia® Contour, which gained encouraging market share by the end of 2003.
Consumer Care, Diagnostics 2002 2003 Change
External sales by market (€million) in %
Europe 1,194 1,122 – 6.0
North America 1,581 1,504 – 4.9
Asia/Pacific 456 302 – 33.8
Latin America/Africa/Middle East 524 408 – 22.1
The global OTC business developed well, with particularly strong growth in the United States. There, the upward trend was enhanced by certain drug products coming off prescription status. Sales were also helped by a strong cold season in Europe and North America. On the other hand, business in over-the-counter drugs in Europe continued to be hampered by the effects of health care reform. The global diagnostic products industry grew more slowly than in the preceding years, the main reasons being the negative trend
for blood glucose monitoring systems, particularly in the United States, and the weak economy in the principal markets.
EBITfor the Consumer Care, Diagnostics segment slipped by 2.2 percent to
€589 million, marred by the lower sales in Self-Testing and adverse currency factors. We successfully completed the divestment of the household insecticides business, initiated in 2002, to U.S.-based SC Johnson & Son. Of the total gain on this sale,€256 million was realized in 2003.
Salesof the Animal Healthsegment fell by 7.1 percent, or €60 million, to
€790 million, due to negative currency effects. Adjusted for these effects, however, sales rose by 4.7 percent. This good performance resulted primarily from the
successful launch in North America of the new antiparasitic treatment Advantix®. As part of the ongoing portfolio adjust-ments, the rights to the Bayovac®/ Baypamun® products were sold to Pfizer Animal Health in December 2003.
Animal Health 2002 2003 Change
€ million in %
Sales 850 790 – 7.1
EBITDA* 219 202 – 7.8
Operating result [EBIT] 170 170 0.0
of which special items (11) 22
CFROI 30.5% 26.9%
Gross cash flow* 182 143 – 21.4
Net cash flow* 140 226 61.4
* for definition see page 4
Animal Health 2002 2003 Change
External sales by market (€million) in %
Europe 243 242 – 0.4
North America 337 305 – 9.5
Asia/Pacific 136 122 – 10.3
Latin America/Africa/Middle East 134 121 – 9.7
➔Quick Links
Bayer CropScience 2002 2003 Change
€ million in % Sales 4,697 5,764 22.7 Crop Protection 4,002 4,801 20.0 Insecticides 1,250 1,376 10.1 Fungicides 1,030 1,168 13.4 Herbicides 1,452 1,848 27.3 Seed Treatment 270 409 51.5 Environmental Science 605 692 14.4 BioScience 90 271 • EBITDA* 520 1,073 •
Operating result [EBIT] (108) 324 •
of which special items 67 (81)
CFROI 6.6% 10.3%
Gross cash flow* 516 924 79.1
Net cash flow* 1,212 1,165 – 3.9
* for definition see page 4
Sales in Europe remained at the previous year’s level. The declines in the other regions resulted mainly from negative currency effects.
The global market for animal health prod-ucts continued to grow at a moderate pace in 2003. The companion animals market segment continued to expand at an above-average rate, more or less independently of the economic cycle. By contrast, the livestock market segment stagnated, pri-marily because of sustained pressure on prices through increased use of generic products in agricultural production and the increasing efficacy of regulatory barri-ers to the use of veterinary medicines.
EBITremained constant year on year at
€170 million. Before special items, EBIT fell by €33 million, due to exchange rate developments and expenses for product introductions.
CropScience
Salesof the Bayer CropSciencesubgroup climbed by 22.7 percent to €5,764 million, largely because of the Aventis CropScience acquisition. Exchange rates had a negative effect. After adjusting for portfolio changes and currency factors, business grew by an impressive 11.8 percent in a market that stagnated in local currency terms.
Sales of the Crop ProtectionBusiness Group rose by 20.0 percent to €4,801 mil-lion. This increase was mainly due to acquisitions and a gratifying increase in sales of our top products.
Sales of Confidor®/Gaucho®/Admire®/ Merit® rose by 5.2 percent to €590 mil-lion, the largest increases being recorded in Germany, France and Brazil. Business with Folicur®/Raxil® also improved con-siderably, advancing by 21.2 percent to
Folicur®/Raxil® (Fungicides/Seed Treatment) 315 21.2
Puma®/Accord® (Herbicides) 226 •
FLINT® (Fungicides) 200 25.8
Basta®/Liberty® (Herbicides) 159 •
Decis®/K-Othrine® (Insecticides/Environmental Science) 159 •
Betanal® (Herbicides) 143 • Fenikan®/Javelin® (Herbicides) 115 • Aliette®/Mikal®/Chipco® Signature (Fungicides/Environmental Science) 107 • Balance®/Merlin® (Herbicides) 106 • Total 2,120 47.1
Proportion of Bayer CropScience sales 36.8%
€315 million, mainly due to higher volumes in the United States and Brazil. Sales of Folicur®/Raxil® more than dou-bled year on year in both these countries. FLINT® also fulfilled our high growth ex-pectations, with sales gaining 25.8 percent to €200 million. In light of this product’s effectiveness against Asian rust, there was particularly high demand in Brazil for the new formulations Stratego®‚ for soybeans and Sphere®‚ for coffee crops.
Sales of the products acquired with the Aventis CropScience transaction, notably Puma®/Accord® and Basta®, also devel-oped well.
Envidor®, our new broad-spectrum acari-cide for use in perennial crops, was suc-cessfully launched in Japan and Brazil last year. The new seed treatment Poncho® got off to a good start following its registra-tion in the United States, already account-ing for a major share of sales of the Seed Treatment unit in its first year on the market.
Sales of the Environmental Science Busi-ness Group improved by 14.4 percent to
€692 million. This was mainly due to the products Merit®, MaxForce®, Premise®, Deltagard® and K-Othrine®, as well as to the performance of the Bayer Advanced®/ Bayer Garden® line.
The BioScienceBusiness Group saw sales advance to €271 million. Sales of our vegetable seeds developed favorably, as did our cotton and canola seed products in the United States and Canada. FiberMax® and InVigor® achieved particularly large increases.
In 2003 we pressed ahead with the inte-gration of Aventis CropScience, which is now largely complete. With the exception of the active substance propoxycarbazone, we have now effected all of the individual product divestitures mandated by the antitrust authorities.
Sales of Bayer CropScience were encour-aging in North America, Latin America, Europe, Africa and the Middle East, while business in Japan and South Korea was below expectations. 33.5 • 40.9 • • • • • • 61.8
➔Quick Links
CropScience 2002 2003 Change
External sales by market (€million) in %
Europe 1,851 2,296 24.0
North America 1,024 1,339 30.8
Asia/Pacific 797 963 20.8
Latin America/Africa/Middle East 1,025 1,166 13.8
Total 4,697 5,764 22.7
In our assessment, the global market for crop protection products – measured in local currencies – did not change signifi-cantly in size from the previous year. Measured in euros, however, there was a downward trend in 2003 due to the sharp rise in the value of the euro against the U.S. dollar and other currencies. Business in Europe was impacted by the exceptionally dry weather, the main effect of which was lower fungicide usage. Vol-umes decreased in the important markets of France and Germany, with agriculture in eastern Europe also affected by the drought.
The North American market benefited from favorable weather patterns and good growing conditions along with a high level of insect infestation. Prices, however, remained in decline.
Developments in the Asia/Pacific region included a further reduction in rice acreages in Japan and South Korea, which caused the market for crop protection products to shrink. The markets of both Australia and India recovered from the adverse climatic conditions of the previ-ous year.
In Latin America, economic conditions generally stabilized in 2003, leading to increased usage of crop protection prod-ucts and thus to a gratifying improvement in business.
EBITclimbed sharply from minus
€108 million to €324 million despite negative currency effects, the growth in earnings being mainly due to higher sales. While special items in 2002 comprised mainly the proceeds of individual product divestments, in 2003 they included primarily restructuring charges. EBIT before special items improved by
€580 million to €405 million.
Gross cash flow advanced significantly to
€924 million due to the improvement in EBIT. Net cash flow declined by 3.9 per-cent to €1,165 million, the previous year’s figure having been boosted by the success of the program to improve working capital management that we embarked on in 2001.
Operating result [EBIT] (58) (1,180) •
of which discontinuing operations (147) (783)
of which special items from continuing operations (296) (715) of which special items from discontinuing operation (169) (663)
CFROI 8.2% 8.8%
Gross cash flow* 1,130 1,029 – 8.9
of which discontinuing operations 131 145
Net cash flow* 1,167 1,042 – 10.7
of which discontinuing operations 148 13
* for definition see page 4
Polymers
Salesof the Bayer Polymerssubgroup receded by 5.0 percent to €9,897 million, mainly as a result of unfavorable currency parities. After adjusting for currency and portfolio effects, however, business grew by 3.8 percent. Because of high special charges, particularly impairment losses,
EBITdeclined from minus €58 million in 2002 to minus €1,180 million in 2003. The current unsatisfactory situation in Polymers is mainly attributable to high raw material and energy costs combined with heightened competitive pressure. Gross cash flow shrank by 8.9 percent to €1,029 million. With working capital
virtually unchanged, net cash flow declined accordingly by 10.7 percent to
€1,042 million.
Salesof the Plastics, Rubbersegment fell by 7.6 percent in 2003, though by only 0.8 percent in local currencies. Adjusted for both currency and portfolio effects, business was up by 1.5 percent. Sales of Thermoplas-tic Polymers declined by 5.1 percent to
€2,842 million, mainly because of lower selling prices and adverse currency parities. Rubber Polymers sales dropped by
11.0 percent year on year to €1,971 million, again due to selling price erosion and, in addition, to unfavorable business conditions
Plastics, Rubber 2002 2003 Change
€ million in %
Sales 5,210 4,813 – 7.6
of which discontinuing operations 3,337 3,096
Thermoplastic Polymers 2,995 2,842 – 5.1
Rubber Polymers 2,215 1,971 – 11.0
EBITDA* 511 237 – 53.6
of which discontinuing operations 185 (6)
Operating result [EBIT] 76 (666) •
of which discontinuing operations (48) (716)
of which special items from continuing operations (7) 1 of which special items from discontinuing operation (84) (594)
CFROI 6.8% 6.8%
Gross cash flow* 420 368 – 12.4
of which discontinuing operations 137 142
Net cash flow* 457 198 – 56.7
➔Quick Links
in Europe. Sales were also lower by
€117 million as a result of the divestiture of PolymerLatex in May 2003.
Sales in Europe declined by 3.6 percent to
€2,337 million. Adjusted for the divesti-ture of the PolymerLatex business, sales increased in a difficult business environ-ment characterized by lower output in most customer industries.
In North America, sales fell by 15.3 per-cent to €1,186 million, particularly because of currency effects. Although sales of polycarbonates advanced due to higher demand from the electronics sector, this did not offset the decline in sales of styrenics and rubber polymers that was due mainly to lower demand from the automotive industry.
Sales in Asia/Pacific were down by 8.9 per-cent to €975 million. In local currencies, however, business was steady year on year. This region, too, saw encouraging growth in our polycarbonates business.
In Latin America, the downswing in the automotive sector led particularly to lower sales of rubber polymers.
EBITfor the Plastics, Rubber segment dropped to minus €666 million in 2003 following €463 million in impairment losses and €130 million in other special charges, primarily restructuring expenses. EBIT before special items fell to minus
€73 million. This was attributable mainly to declining selling prices and higher raw material and energy costs.
In light of the strategic realignment of the Bayer Group and changes in the operating environment for some businesses in the Plastics, Rubber segment, it was necessary to review the valuations of the relevant assets. These impairment tests were also prompted by a continuing weaker-than-expected performance by some of the seg-ment’s businesses. The ABS business, in particular, is being impacted by the ongo-ing relocation of important customer industries to Asia. Business conditions for our European and North American solid rubber locations featured only slow mar-ket growth. Increased raw material and energy costs had a further negative
Plastics, Rubber 2002 2003 Change
External sales by market (€million) in %
Europe 2,425 2,337 – 3.6
North America 1,401 1,186 – 15.3
Asia/Pacific 1,070 975 – 8.9
Latin America/Africa/Middle East 314 315 0.3
impact. Overcapacities in some markets served by the Plastics, Rubber segment led to fierce competition, with substantial declines in prices and margins marring prospects for future development. Impair-ment losses totaling €463 million were recognized for this segment.
Polyurethanes, Coatings, Fibers 2002 2003 Change
€ million in %
Sales 5,213 5,084 – 2.5
of which discontinuing operations 199 167
Polyurethane Materials 3,197 3,184 – 0.4
Coating Materials 2,016 1,900 – 5.8
EBITDA* 782 656 – 16.1
of which discontinuing operations (3) (7)
Operating result [EBIT] (134) (514) •
of which discontinuing operations (99) (67)
of which special items from continuing operations (289) (716) of which special items from discontinuing operations (85) (69)
CFROI 9.3% 10.4%
Gross cash flow* 710 661 – 6.9
of which discontinuing operations (6) 3
Net cash flow* 710 844 18.9
of which discontinuing operations 9 16
* for definition see page 4
Polyurethanes, Coatings, Fibers 2002 2003 Change
External sales by market (€million) in %
Europe 2,252 2,309 2.5
North America 1,690 1,526 – 9.7
Asia/Pacific 744 730 – 1.9
Latin America/Africa/Middle East 527 519 – 1.5
Total 5,213 5,084 – 2.5
Despite growth in volumes,salesof our
Polyurethanes, Coatings, Fiberssegment dropped by 2.5 percent in 2003, particu-larly as a result of currency effects. Sales of Polyurethane Materials were down by 0.4 percent to €3,184 million, while Coatings Materials decreased by 5.8 per-cent to €1,900 million. Before currency translations, however, sales rose by 6.2 percent.
➔Quick Links
Sales in Europe failed to meet our expec-tations as a result of the weak economy, increasing by just 2.5 percent. Our MDI business made gratifying gains, however, benefiting from higher demand for heat insulating materials.
In North America, sales dropped by 9.7 percent in euros, to €1,526 million, but grew by 7.2 percent in local currencies. Our MDI and TDI businesses benefited from strong growth in the construction, electrical and electronics industries. Sales of Coatings Materials were down year on year due to the downturn in the automo-tive and furniture industries.
Sales in Asia/Pacific were slightly below the previous year, at €730 million. In local currencies, however, business improved by 12.5 percent, mainly due to the high growth rates of major customer industries in this region, particularly in Greater China, which in turn led to considerably higher sales of polyurethane raw materi-als.
EBITfor the Polyurethanes, Coatings, Fibers segment fell from minus €134 mil-lion in 2002 to minus €514 million in 2003. Before impairment losses of€671 million and other special items, EBIT climbed by 12.9 percent to €271 million as a result of higher volumes and the success of our restructuring program. Further increases in raw material costs and the continuing low level of selling prices had a negative effect. The other special items of€114 million mainly comprised restructuring charges for polyether, TDI and fibers.
Impairment tests resulted in the recognition of€671 million in impair-ment losses for the Polyurethanes, Coatings, Fibers segment. Impairment losses for the polyols and fibers businesses already having been recognized in the previous year, a further write-down was necessary in 2003 because the original economic assumptions had to be revised downward in light of these businesses’ long-term perspectives. The polyols and fibers businesses were impacted by overca-pacities and continuing strong competi-tive pressure in all regions, particularly Asia. The resulting decline in prices, com-bined with the sustained high level of raw material costs, created constant pressure on margins. Our economic expectations for other businesses also declined. The solvent-free powder coatings business that passed to us with the acquisition of Sybron Chemicals Inc. in 2000 now oper-ates in a difficult environment marked by low capacity utilization and low prices. This business was also hurt by high raw material and energy costs.
Functional Chemicals 512 514 0.4
Process Chemicals 890 740 – 16.9
H.C. Starck 607 564 – 7.1
Wolff Walsrode 230 222 – 3.5
Other (incl. Haarmann & Reimer in 2002) 868 197 – 77.3
EBITDA* 1,489 263 – 82.3
of which discontinuing operations 1,363 172
Operating result [EBIT] 1,057 (499) •
of which discontinuing operations 1,018 (516)
of which special items from continuing operations (1) 0 of which special items from discontinuing operations 858 (541)
CFROI 8.5% 6.7%
Gross cash flow* 473 291 – 38.5
of which discontinuing operations 363 204
Net cash flow* 590 199 – 66.3
of which discontinuing operations 442 118
* for definition see page 4
Chemicals
The Bayer Chemicalssubgroup had sales
of€3,400 million in 2003. Adjusted for portfolio and currency effects, business was up by 0.8 percent despite the lack of a recovery in major customer industries. To further optimize the portfolio, we sold the organic pigments business to Sun Chemicals in the first quarter of 2003 and divested Walothen GmbH to the Wihuri group of Finland in the fourth quarter of the year.
Sales of the Industrial Chemicals unit declined by 2.5 percent year on year to
€975 million. In local currencies, how-ever, sales rose by 3.1 percent, thanks largely to growth in basic chemicals. Cus-tom Manufacturing was 12.6 percent below the previous year at €188 million, mainly because of increased competition from Asian suppliers in the agrochemicals area and continuing weakness in the pho-tographic chemicals market. Process Chemicals saw a drop in business, particu-larly in textile chemicals, with sales down
by 16.9 percent to €740 million. Sales of Functional Chemicals remained steady year on year at €514 million. When adjusted for currency effects, however, sales of this business unit improved by 5.9 percent, with good gains in industrial biocides and specialty material protection products. Sales of Wolff Walsrode de-creased by 3.5 percent to €222 million. Business at H.C. Starck, also hampered by exchange rates, receded by 7.1 percent to
€564 million. Currency-adjusted sales, however, rose by 1.1 percent from the pre-vious year.
The decline in sales in all regions is mainly due to the fact that the previous year’s fig-ures contained the business of the divested Haarmann & Reimer group. In Europe, sales moved back by 15.0 percent to
€1,812 million. Adjusted for currency effects, business declined by 1.3 percent. In the other regions there was an addi-tional negative effect from currency trans-lations. Business in North America shrank by 29.4 percent to €622 million. Adjusted
➔Quick Links
for currency effects, however, sales remained at the previous year’s level. The economy of this region weakened consid-erably in the first half of the year as a result of the Iraq war and the high price of oil. In the second half, however, consumer spending and growth indicators pointed to an upswing. This overall economic trend was also reflected in the markets served by Bayer Chemicals, with currency-and portfolio-adjusted sales improving in the second half by 4.6 percent from the same period of 2002.
Sales in Asia/Pacific fell by 21.6 percent to
€624 million, but remained steady after adjusting for currency and portfolio effects.
Business in the Latin America/Africa/ Middle East region dropped by 33.5 per-cent to €342 million. Adjusted for cur-rency and portfolio effects, sales decreased by 4.0 percent. Although this region has basically overcome the recent stagnation phase, the upward trend was restrained by a lack of demand in domestic markets and economic weakness in Mexico and Brazil. In connection with the strategic realign-ment of the Bayer Group and the deterio-ration in business conditions, we reviewed and adjusted the business plans of all the strategic business entities that are to be transferred to Lanxess. On the basis of
current and forecasted market and com-petitive conditions and a fundamental reappraisal of long-term returns on past investments, we recognized impairment losses of€476 million for the Chemicals segment. These write-downs relate partic-ularly to the fine chemicals business, where there is sustained pressure on margins resulting from adverse exchange rates, ongoing consolidation in customer industries, overcapacities in certain market segments and increased competi-tion, particularly from Asian suppliers.
EBITfell from €1,057 million in 2002 to minus €499 million in 2003. Of the high earnings for 2002, the Haarmann & Reimer activities, divested in 2002, accounted for €980 million, including a
€933 million gain on the divestiture. EBIT for 2003, however, was hampered by minus €541 million in special items, comprising mainly impairment losses. EBIT before special items declined by
€158 million, or 79.0 percent, to
€42 million. Gross cash flow receded by
€182 million to €291 million, partic-ularly due to the lower earnings from oper-ations. Net cash was also sharply down, at €199 million.
Chemicals 2002 2003 Change
External sales by market (€million) in %
Europe 2,131 1,812 – 15.0
North America 881 622 – 29.4
Asia/Pacific 796 624 – 21.6
Latin America/Africa/Middle East 514 342 – 33.5
“Bayer is committed to increasing stockholder value. Our aim is to convince investors by delivering a strong performance and by communicating openly, fairly and honestly.”
Werner Wenning, Chairman of the Board of Management of Bayer AG
CVA-based system
The prime objective of the Bayer Group is to sustainably increase enterprise value. In 1994 we became one of the first German companies to embark on the development of a value management system, which we introduced throughout the Group in 1997. The system is used for planning, controlling and monitoring purposes. Our basic controlling parameter is the cash value added (CVA), which indicates the degree to which the cash flows needed to cover the costs of equity and debt and of reproducing depletable assets have been generated. If the CVA is positive, the com-pany or business entity concerned has cre-ated value. If it is negative, the anticipcre-ated capital and asset reproduction costs have not been earned. Gross cash flow and CVA are profitability indicators for a single reporting period. For a year-on-year com-parison we therefore use the delta CVA, which is the difference between the CVAs of two consecutive periods. A positive delta CVA shows that value creation has improved from one period to the next.
Calculating the cost of capital
Bayer calculates the cost of capital by the weighted average cost of capital (WACC) formula. WACC is the average of the cost of the company’s debt and equity financ-ing, weighted according to their respective market values. The cost of equity corre-sponds to the return expected by our stockholders and is computed from capital market information using a market-derived capital pricing model (MCPM). The cost of debt used in calculating WACC is based on our terms for a ten-year corpo-rate bond issue.
To take into account the different risk and return profiles of our principal businesses, we calculate the cost of capital after taxes for each of our subgroups. This is currently 9.0 percent for HealthCare, compared with 7.0 percent for CropScience (due to the higher leverage) and 7.0 percent for Poly-mers and Chemicals (because of the lower cost of equity). The minimum return required for the Bayer Group as a whole comes out at 7.5 percent.
➔Quick Links
Gross cash flow, cash flow return on investment, and cash value added as performance yardsticks
The gross cash flow (GCF), as published in our cash flow statement, is the measure of our internal financing capability. Bayer has chosen this parameter because it is relatively free of accounting influences and thus a more meaningful performance indicator.
The profitability of the Group and of its individual business entities is measured by the cash flow return on investment (CFROI). This is the ratio of the GCF to the capital invested (CI). The CI is derived from the balance sheet and comprises the assets required for operations – stated at cost of acquisition or construction – plus working capital, less interest-free liabilities
(such as short-term provisions). To allow for fluctuations during the year, the CFROI is computed on the basis of the average CI for the respective year.
Taking into account the cost of capital and of asset reproduction in relation to the CI, we determine the minimum GCF
required, the GCF hurdle. Subtracting the GCF hurdle from the GCF actually achieved in a given period gives the CVA. If the GCF hurdle is equaled or exceeded, the required return on equity and debt plus the cost of reproducing depletable assets has been earned.
The GCF hurdle for 2003 was €3.7 bil-lion. The cash flow achieved was €3.2 bil-lion, or 88 percent of the hurdle. Thus the capital and asset reproduction costs were almost completely earned. The CVA rose from minus €559 million in 2002 to minus €429 million in 2003, giving a delta CVA of€130 million, which means the return on capital improved by this amount year on year.
The CFROI increased from 8.2 percent in 2002 to 9.2 percent in 2003, due both to the higher gross cash flow and to the lower capital invested.
€ million 2002* 2003
Gross cash flow 3,008 3,244
CVA (559) (429)
CFROI 8.2% 9.2%
Average capital invested 36,755 35,401