Masthead Logo
Western Michigan University
ScholarWorks at WMU
Transportation Research Center Reports Transportation Research Center for Livable Communities
11-30-2017
16-08 Does Location Matter? Performance
Analysis of the Affordable Housing Programs in
Dallas-Fort Worth
Shima Hamidi
University of Texas at Arlington
Somayeh Moazzeni
University of Texas at Arlington
Jinat Jahan
University of Texas at Arlington
Reza Sardari
University of Texas at Arlington
David Weinreich
University of Texas at Arlington
Follow this and additional works at:https://scholarworks.wmich.edu/transportation-reports Part of theTransportation Engineering Commons
This Report is brought to you for free and open access by the
Transportation Research Center for Livable Communities at ScholarWorks at WMU. It has been accepted for inclusion in Transportation Research Center Reports by an authorized administrator of ScholarWorks at WMU. For more information, please contactmaira.bundza@wmich.edu.
Footer Logo WMU ScholarWorks Citation
Hamidi, Shima; Moazzeni, Somayeh; Jahan, Jinat; Sardari, Reza; and Weinreich, David, "16-08 Does Location Matter? Performance Analysis of the Affordable Housing Programs in Dallas-Fort Worth" (2017).Transportation Research Center Reports. 8.
TRCLC 16-08
November 30, 2017
DOES LOCATION MATTER?
Performance Analysis of the Affordable Housing Programs
in Dallas-Fort Worth
FINAL REPORT
Shima Hamidi, Somayeh Moazzeni, Jinat Jahan, Reza Sardari, David
Weinreich
DOES LOCATION MATTER? Performance Analysis of the Affordable Housing Programs in Dallas-Fort Worth
ii Technical Report
Documentation Page 1. Report No.
TRCLC 16-08
2. Government Accession No. N/A
3. Recipient’s Catalog No. N/A
4. Title and Subtitle
DOES LOCATION MATTER?
Performance Analysis of the Affordable Housing Programs in Dallas-Fort Worth
5. Report Date November 30, 2017
6. Performing Organization Code N/A
7. Author(s)
Shima Hamidi, Somayeh Moazzeni, Jinat Jahan, Reza Sardari, David Weinreich
8. Performing Org. Report No. N/A
9. Performing Organization Name and Address Western Michigan University
1903 West Michigan Avenue Kalamazoo, MI 49008
10. Work Unit No. (TRAIS) N/A
11. Contract No. TRCLC 16-08 12. Sponsoring Agency Name and Address
Transportation Research Center for Livable Communities (TRCLC)
1903 W. Michigan Ave., Kalamazoo, MI 49008-5316
13. Type of Report & Period Covered Final Report
9/1/2016 – 11/30/2017 14. Sponsoring Agency Code N/A
15. Supplementary Notes 16. Abstract
On June 2015, the Texas Department of Housing and Community Affairs lost a case in the U.S. Supreme Court due to their failure to provide equitable affordable housing under the Low Income Housing Tax Credit (LIHTC) program. The U.S. Supreme Court decision has shaken the affordable housing definition by highlighting the importance of location in housing affordability. To best assist low-income families, what should ‘high-opportunity areas’ concretely provide? First and foremost is transportation
affordability.
Transportation is more than a sheer convenience for Americans. Looking solely at housing costs is a misleading measure of affordability and a disservice to low-income families. A recent study by the PI, found that, households in 44% of all Multifamily Section 8 properties in the nation, spend on average more than 15 percent of their income on transportation costs, making these properties effectively unaffordable. According to this methodology, more than 73% of Section 8 Multifamily properties in Dallas Fort Worth (DFW) are unaffordable. This study has received extensive media attention by The Dallas Morning News, CityLab and other media outlets.
Yet there is little understanding on the affordability and effectiveness of other rental assistance programs such as Public Housing, LIHTC and the Housing Choice Voucher Program. There is also little understanding about the long term effects of location on low income households in terms of providing accessibility to opportunities and, as a result, affecting the chance of upward mobility.
This study seeks to address these gaps by developing an innovative approach to evaluate the short-term and long-term affordability of all state and federal rental assistance programs in the Dallas-Fort Worth metropolitan area. We used disaggregated data at the property level and measured built
environment variables around each property. We then estimated transportation costs for a typical household that qualifies under these programs using solid transportation costs modeling tailored for
low-DOES LOCATION MATTER? Performance Analysis of the Affordable Housing Programs in Dallas-Fort Worth
iii income households. This study sheds light on the relative merit of each program in ensuring affordability when factoring in transportation costs.
Second, this research seeks to identify long term affordability and opportunities for upward mobility for all census blocks in the Dallas-Fort Worth metropolitan region. We produced a series of “Catalyst Areas” maps. Catalyst Areas represent areas with adequate access (by modes other than driving) to major destinations such as educational facilities, healthy food, health care facilities, public transit, and job opportunities. This would help low-income households to not only spend less on transportation, but also, by providing access to opportunities, increase their chance of upward mobility.
Finally, this study provides recommendations to further federal and state initiatives in
coordinating housing and transportation and is designed to inform regional and local planners on location-efficient investments. This study also recommends that the priority in affordable housing investments for low-income households should be given to Catalyst Areas.
17. Key Words
transportation affordability, access to opportunity, location efficiency, transportation costs, equity
18. Distribution Statement No restrictions.
19. Security Classification - report Unclassified
20. Security Classification - page Unclassified
21. No. of Pages 22. Price
1
Disclaimer
The contents of this report reflect the views of the authors, who are solely responsible for the facts and the accuracy of the information presented herein. This publication is disseminated under the sponsorship of the U.S. Department of Transportation’s University Transportation Centers Program, in the interest of information exchange. This report does not necessarily reflect the official views or policies of the U.S. government, or the Transportation Research Center for Livable Communities, who assume no liability for the contents or use thereof. This report does not represent standards, specifications, or regulations.
Acknowledgments
This research was funded by the US Department of Transportation through the Transportation Research Center for Livable Communities (TRCLC), a Tier 1 University Transportation Center at Western Michigan
2
T A B L E O F C O N T E N T S
E X E C U T I V E S U M M A R Y ……….…….….…. 0 3 I N T R O D U C T I O N ……….…….………..….…. 0 4 R E S E A R C H O B J E C T I V E S A N D G O A L S ……….……….. 0 5 P h a s e 1 : A S S E S S I N G T R A N S P O R T A T I O N A F F O R D A B I L I T Y O F T H E M A J O R A F F O R D A B L E P R O G R A M S ……….……….………... 0 6 1 - 0 1 | I N T R O D U C T I O N ………..…….………. 0 7 1 - 0 2 | L I T E R A T U R E R E V I E W ……….……....……. 0 8 O V E R V I E W O F A F F O R D A B L E H O U S I N G P R O G R A M S ……….…….…... 0 8 T R A N S P O R T A T I O N C O S T S A N D A F F O R D A B I L I T Y S T U D I E S ………..…….……1 9 1 - 0 3 | M E T H O D O L O G Y ……….……….. 2 1 S A M P L E ……….…….………. 2 1 T R A N S P O R T A T I O N M O D E L S ………...……….……….. 2 3 T R A N S P O R T A T I O N C O S T S C A L C U L A T I O N ………...……….. 2 4 1 - 0 4 | R E S U L T S A N D D I S C U S S I O N ……….……….……….…… 2 6 1 - 0 5 | P O L I C Y R E C O M M E N D A T I O N S ……….………..……… 4 4 P h a s e 2 : M E A S U R I N G A C C E S S T O O P P O R T U N I T Y ………... 4 8 2 - 0 1 | I N T R O D U C T I O N ………..…….………. 4 9 2 - 0 2 | L I T E R A T U R E R E V I E W ……….……....……. 5 0 2 - 0 3 | M E T H O D O L O G Y ……….……….. 5 3 R E S E A R C H D E S I G N………..……….………...……….. 5 6 2 - 0 4 | R E S U L T S A N D D I S C U S S I O N ……….….………….………....… 7 0 A C C E S S T O O P P O R T U N I T I E S B Y W A L K I N G ……….………7 0 A C C E S S T O O P P O R T U N I T I E S B Y D R I V I N G ……….………8 4 A C C E S S T O O P P O R T U N I T I E S B Y ……….………9 7 C O M P A R I S O N O F T H E T H R E E T R A N S P O R T A T I O N M O D E S ……...……...…….. 1 1 0 2 - 0 5 | P O L I C Y R E C O M M E N D A T I O N S ……….……… 1 1 1 C O N C L U S I O N S ……….……… 1 1 6 R E F E R E N C E S ……….……….…………1 1 7 A P P E N D I X A ………. 1 2 5 A P P E N D I X B ……….……1 3 33
| E X E C U T I V E S U M M A R Y
On June 2015, the Texas Department of Housing and Community Affairs lost a case in the U.S. Supreme Court due to their failure to provide equitable affordable housing under the Low Income Housing Tax Credit (LIHTC) program. The U.S. Supreme Court decision has shaken the affordable housing definition by highlighting the importance of location in housing affordability. To best assist low-income families, what should ‘high-opportunity areas’ concretely provide? First and foremost is transportation affordability.
Transportation is more than a sheer convenience for Americans. Looking solely at housing costs is a
misleading measure of affordability and a disservice to low-income families. A recent study by the PI, found that, households in 44% of all Multifamily Section 8 properties in the nation, spend on average more than 15 percent of their income on transportation costs, making these properties effectively unaffordable. According to this methodology, more than 73% of Section 8 Multifamily properties in Dallas Fort Worth (DFW) are unaffordable. This study has received extensive media attention by The Dallas Morning News, CityLab and other media outlets.
Yet there is little understanding on the affordability and effectiveness of other rental assistance programs such as Public Housing, LIHTC and the Housing Choice Voucher Program. There is also little understanding about the long term effects of location on low income households in terms of providing accessibility to opportunities and, as a result, affecting the chance of upward mobility.
This study seeks to address these gaps by developing an innovative approach to evaluate the short-term and long-term affordability of all state and federal rental assistance programs in the Dallas-Fort Worth
metropolitan area. We used disaggregated data at the property level and measured built environment
variables around each property. We then estimated transportation costs for a typical household that qualifies under these programs using solid transportation costs modeling tailored for low-income households. This study sheds light on the relative merit of each program in ensuring affordability when factoring in
transportation costs.
Second, this research seeks to identify long term affordability and opportunities for upward mobility for all census blocks in the Dallas-Fort Worth metropolitan region. We produced a series of “Catalyst Areas” maps. Catalyst Areas represent areas with adequate access (by modes other than driving) to major destinations such as educational facilities, healthy food, health care facilities, public transit, and job opportunities. This would help low-income households to not only spend less on transportation, but also, by providing access to opportunities, increase their chance of upward mobility.
Finally, this study provides recommendations to further federal and state initiatives in coordinating housing and transportation and is designed to inform regional and local planners on location-efficient investments. This study also recommends that the priority in affordable housing investments for low-income households should be given to Catalyst Areas.
4
| I N T R O D U C T I O N
Each year, the federal government spends the colossal amount of 50 billion dollars in housing programs assistance for low-income households (Congressional Budget Office, 2015). Yet, severe housing affordability challenges continue to plague American cities and disproportionately affect the most vulnerable communities (Desmond, 2015). The growing concern of the last decade is the inadequacy of the long-established measure of affordability, which ignores the importance of transportation.
The U.S. Department of Housing and Urban Development’s (HUD) measure of affordability is such that a household should spend no more than thirty percent of its budget on housing costs (Belsky, Goodman, & Drew, 2005, Lang, 2012, Schwartz, 2015). Yet, in the search for affordability, low-income households make critical trade-offs notably between housing and transportation costs. The burden of housing and
transportation costs is even more acute for the low-income households with fewer housing and
transportation options (Roberto, 2008). A serious limitation of the standard metric of affordability is that it does not engage with the key aspect of livability for low-income households, transportation affordability. Vulnerable groups, who often lack private transportation, also suffer from a spatial mismatch. The mismatch between individual needs and the location of critical services has been researched on the pertinent basis of transportation equity (Welch, 2013; Grønbjerg & Paarlberg , 2001; Archibald and Putnam Rankin, 2013; Allard, 2008). Although HUD has aimed to provide housing welfare participants with access to economic, social, and recreational opportunities (Welch, 2013; Welch & Mishra, 2013), little is known on how well these housing programs spatially match low-income residents with high-access-high-opportunity areas.
Location, via its transportation costs, is central to evaluate true housing affordability, but also plays a long-term role in achieving opportunity and promoting upward mobility (van Wee & Geurs, 2011; Woetzel et al., 2014; Welch, 2013; Chetty et al., 2014). It is not only the provision of affordable housing that matters, but also the availability of a supportive system to enhance the well-being and livability of people and
communities.
This study seeks to fill these gaps by evaluating location affordability and access to opportunities for all federal and state housing programs in the Dallas-Fort Worth metropolitan area. All the aforementioned gaps are addressed: the study uses innovative and robust methodology, solid transportation costs modeling tailored for low-income households, comprehensive disaggregated data, and evaluates for spatial distributions of services for these low-incomes families.
This study is conducted in an effort to further federal initiatives in coordinating housing and transportation and is designed to inform regional and local planners on location-efficient, high opportunity investments. The research will also have practical value, as it will tell HUD and other organizations whether the rental housing they subsidize is truly affordable and how, in the future, it can be made more so by directing subsidies to better (more compact, walkable, and transit-served) locations.
This project consists of two phases. Phase 1 is assessing the transportation affordability (and location efficiency) of major federal and state level affordable housing programs. Phase 2 is analyzing access to opportunities for all census blocks in the study area.
5
| R E S E A R C H O B J E C T I V E S A N D G O A L S
Assessing whether state and federal affordable housing programs are truly providing affordability when transportation costs are factored
Producing a map of “Catalyst Areas” as areas with high accessibility to opportunities: For every census block in the study area, through a comprehensive accessibility analysis, we measure accessibility to major destinations (high quality education, health care facilities, supermarkets, healthy food, etc.) and combine these into an overall Opportunity Index for each block and will visualize it as the map of Catalyst Areas.
Providing policy recommendations for delivering true affordability for low-income households: Informed by our findings, we produce a list of policy implications at the state and federal level on how to integrate the value of location in the concept of affordability and various affordable programs designs. Depending on the type of rental assistance programs, the policies could range from how to incentivize location efficient investments to how to discourage investments in inaccessible low opportunity areas.
6
Phase 1:
ASSESSING TRANSPORTATION AFFORDABILITY OF THE MAJOR
AFFORDABLE PROGRAMS
7
1 - 0 1 | I N T R O D U C T I O N
According to the National Association of Home Builders, housing affordability has been declining in the Dallas-Fort Worth metro area since 2013. As a result, the issue of housing affordability in this region has been receiving enormous attention in recent years. Such critical housing affordability issues are not confined at the local level but also nationwide. For this, the federal government spends about 50 billion dollars annually to provide housing assistance specifically for low income families (Congressional Budget Office, 2015). However, the housing cost burden is still a critical issue for low income households (Fischer and Sard, 2017). This raises the question about the effectiveness of housing assistance programs and the response depends on how the definition of affordability is conceptualized.
Historically, the measure of housing affordability has been viewed as the ratio of housing cost to income (Schwartz and Wilson, 2008). Since the United States National Housing Act of 1937, the housing cost-income ratio threshold has grown and by 1981, the standard was raised to 30% of household income, which is still considered affordable for most housing assistance programs (Schwartz and Wilson, 2008; HUD, n.d.a). Transportation cost, on the other hand, is the second largest expenditure for an American family (CTOD and CNT, 2006). Due to limited choices of transport modes and in search of affordability, vulnerable low income families make critical trade-offs between housing and transportation costs. Previous studies explored that households may be willing to spend more for housing and less for commuting or may choose more affordable dwelling farther from jobs with higher transportation costs (Salvin, 2014). This often leads low income
working groups to suffer from spatial mismatch. The mismatch between individual needs and the location of daily services has been researched on the pertinent basis of transportation equity (Welch, 2013; Grønbjerg and Paarlberg, 2001; Allard 2008).
In a car-oriented region like DFW, the situation might be exacerbated for low income families with a lack of private vehicles. It is not only the provision of affordable housing that matters, but also the access to daily needs and availability of a supportive system to enhance the well-being and livability of people and communities. This study seeks to identify these gaps by evaluating location efficiency for major affordable housing programs in DFW.
To address the gaps, this study uses an innovative and robust methodology with disaggregated data at the property level and measures built environmental variables around each property. Then, compared to the methodology of the Housing + Transportation Affordability Index and Location Affordability Index (LAI) that measure location affordability for typical households (Hamidi, et. al, 2016), this study uses a more rigorous methodology to estimate housing-transportation costs specifically for low income households for whom HUD is intended to provide housing support. Property level data of major assistance programs was collected from HUD portals as well as from local agencies. The inclusion of address-level disaggregated data for all available housing assistance programs in DFW and the use of solid transportation cost modeling tailored for low
8 income groups make this study unique relative to previous studies on affordable housing programs in DFW (Zandt and Mhatre, 2009).
Transportation equity and location efficiency are growing concerns in this region, so this study can provide an insight for current as well as long term performances of rental-assisted properties. This study was conducted in an effort to guide further federal initiatives to consider the combined effect of housing and transportation. It will tell HUD and other organizations whether the rental housing they subsidize is truly affordable and how, in the future, it can be made more so by directing subsidies to better (more compact, walkable, and transit-served) locations. For this, it is fundamental to understand the mechanism of major affordable housing programs of HUD which have been discussed as a program overview in the next section.
1 - 0 2 | L I T E R A T U R E R E V I E W
OVERVIEW OF AFFORDABLE HOUSING PROGRAMS
HUD is responsible for the majority of the federal housing programs to support a distressed economic group of people. In a recent report, HUD (2016a) listed overall 100 active and authorized housing assistance programs. Schwartz also (2015) provides an overview of major national housing assistance programs under different categories. The major HUD programs primarily focus on the availability of affordable housing units for the low and very low income groups as well as ensuring to protect people from housing discrimination. Table 1 presents a summary of major affordable programs covered in this study.
These programs have different funding mechanisms. The Low Income Housing Tax Credit (LIHTC) program, for instance, allows investors to deduct their federal income taxes by $1 for every dollar of tax credit to cover the project costs. The rent of LIHTC assisted properties cannot exceed 30% of the income limit for particularly sized households and the property can be occupied for at least 15 years (Schwartz, 2015). Similarly, the Housing Trust Fund (HTF) with a minimum affordability period of 30 years provides funding to the Public Housing Authorities (PHA) for construction and preservation of rental housing as well as support for
homeownership to households living below the poverty level (HUD, 2016a, Homes and Community Renewal, 2015). PHAs are also encouraged to play a role in the revitalization of severely distressed public housing and related activities under the HOPE VI program. The residents relocated due to HOPE VI receive a voucher to rent housing units in the private market with the intention to allow them to move into better neighborhoods (Goetz, 2010).
9
Table1: Summary of the Major Housing Assistance Programs Covered in this Study
Categor
y Housing Programs Established by Eligibility Location Preference Mechanism Type
P
ubl
ic H
ous
ing
Housing Trust Fund (HTF) Article XVIII of the Private Housing Finance Law (PHFL)
Households <= 30 %
Area Median Income (AMI) and <= 50 % AMI
Areas with distressed economic condition (HUD, 2016a)
Fund through contributions from Fannie Mae and Freddie Mac
Rent and Ownership
HOPE VI The United States Housing Act of 1937
Residents of severely distressed public housing
Neighborhoods with closer proximity to economic opportunities (Goetz, 2010).
Capital cost to PHA for major
reconstruction of housing. Vouchers to the recipients to rent housing in private market
Rent
Section 32 Public Housing Homeownership Program
The United States Housing Act of 1937
Households <= 80 % AMI
- Down payment assistance or subordinate mortgages, and/or below market financing to purchase home Ownership Nonprofi t Se ct or and c om m u ni ty de ve lopm e nt HOME Investment Partnerships The Cranston-Gonzalez National Affordable Housing Act
Households <= 60 % AMI and <= 80 % AMI
- Fund to the state and local agencies to support rehabilitation and construction of rental housing. Rent and Ownership M ul tifa m ily or P riv at e ly owne d pr oject -ba se d Section 8 Project-Based Rental Assistance Renewal Program
- Households <= 30 %AMI and <= 50 %AMI; Or, <= 80 %AMI (depending on availability of unit)
- Renewal of expiring contracts on units already receiving project-based Section 8 rental assistance.
Rent
Rental Assistance Demonstration (RAD)
Consolidated and Further Continuing Appropriations Act, 2012
Owners of other any HUD assisted properties
- Allow owners of other type HUD assisted properties convert units to project based Section 8 programs
Rent
Section 236 or Below Market Interest Rate (BMIR)
National Housing Act, 1968 Households <= 80 % AMI
- Combined mortgage insurance and reduced interest rate for the mortgagee to develop low rental housings
Rent H ous ing f or p e opl e wi th Spe ci al N e eds Section 811 Project Rental Assistance (PRA) Program (PRAC811)
The National Affordable Housing Act of 1990
Households <= 30 % AMI or <= 50 %
AMI and also have at least one adult member with disability
- Interest free capital advances to sponsors Rent
Section 202 Supportive Housing for the Elderly Program (202/PRAC)
The Housing Act of 1959 Households <= 30 %
AMI and have at least one person 62 years of age or older
- Capital grants and
project rental assistance to developers
Rent
Continuum of Care Program (CoC)
The Homeless Emergency Assistance and Rapid Transition to Housing Act of 2009 (HEARTH Act)
Homeless individuals or families - Fund to developers to provide housing facilities to accommodate homeless
Rent and Ownership V ouch e r P rog ra m s
Housing Choice Vouchers (HCV)
The United States Housing Act of 1937
Households <= 30 % AMI
Participants’ preference. Most of the voucher holders live in MSA neighborhoods (Galvez, 2010)
Monthly rental subsidy to the recipients Rent
Ta xe s a nd H ous ing
Low Income Housing Tax Credit (LIHTC)
The Tax Reform Act of 1986 Households <= 50 % AMI; Or, <= 60 % AMI
Census tracts in which 50 percent or more of the households have incomes below 60% AMI (Di and Murdoch, 2010)
Allocation of tax credits (an amount of money that can be offset against a tax liability) to developers to
10 Some of these programs, such as Section 202 and Section 811, are designed for elderly people and persons with disabilities. Under the Section 202 program, rental assistance is provided to landlords to cover the difference between the renters’ share toward rent and the HUD permitted expense to operate the project (HUD, 2016a). In the same way, the Section 811 program provides rental support to households with disabled members. The CoC aims to provide housing facilities to immediately rehabilitate homeless people and provide them with long term housing stability. For the geographic area in which the CoC programs operate, they select agencies (private nonprofit organizations or local governments) to provide the funding to support the
homeless (HUD, 2016a). Another category of housing assistance initiatives includes voucher programs like HOV, HCV and PBV programs. Among all voucher programs, HCV is the largest federal rental subsidy program (Getsinger et. al, 2017) which provides low income families with vouchers to find their preferred housing unit (HUD, 2016a). In other assistance programs such as CDBG and HOME programs, HUD provides grants to state and local governments to implement local housing strategies intended to increase homeownership to low income groups (DeHaven, 2009; HUD, n.d.-b). In the next section, we explain how the subsidies in these programs work and if the location or transportation costs play any role in the subsidy calculations for these programs.
The Low Income Housing Tax Credit Program
The maximum monthly rent is calculated according to this formula:
Max Monthly Rent = [Percentage Factor*Area Median Income]*0.3/12 Percentage Factor = f (Development Type, Unit Type)
Development Type = The initial applicable income depends on what proportion of units dedicated for low incomes;
a) If at least 20% of units are for low income households, the maximum income level is set as 50% of the area median income (AMI). This is known as “20/50 set aside”;
b) From 40% and above, tenants whose income is at 60% or below of the AMI qualify. The second scenario is referred to as “40/60 set aside.”
c) New York City has a special “25/60 set aside” (HUD, 2010). AMI figures are published by HUD annually and made available from the HUDUSER Website.1
The rent is also adjusted by household size and number of bedrooms as established by the Internal Revenue Service (IRS) (HUD, 2010). For example, under the 40/60 criteria, the percentage factor for a household with three members would be: 42% for a studio, 48% for a one-bedroom unit, 54% for a two-bedroom unit, 60% for three and four-bedroom units (Polton, 2005).
In the case of a two-bedroom unit, for example, the rent calculation would be as follows:
11 For 20/50 Max Rent = 0.45 (AMI)*0.3/12
For 40/60 Max Rent = 0.54 (AMI)*0.3/12
According to the IRS, the rent cannot exceed 30% of this applicable income. That is why the 45% or 54% max rent of that AMI is then multiplied by 0.3. Finally, the amount is divided by 12 to obtain the maximum monthly rental charge.
Location Criteria for LIHTC: To best leverage the subsidy, there is a strong incentive for developers to aim
for the lowest-rent areas (Lang, 2012). Developers also can benefit from a 30% increase if the development is located in Difficult Development Areas (DDAs) and Qualified Census Tracts (QCTs) (Oakley, 2008; Eriksen, 2009; Burge, 2011; Lang, 2012; Dawkins, 2013). For all of these reasons, the location matters in the LIHTC program.
The standards for DDAs and QCTs are determined by HUD and the Department of Treasury (Tegeler, et al, 2011). The QCTs are the tracts where the poverty rate is above 25% or at least half the households of that census tract have an income of less than 60% of AMI (Lang, 2012, Abt Associates Inc, 2010, Tegeler, et al, 2011). The DDAs are areas where construction, development, and utility expenses are high relative to revenue (Abt Associates Inc, 2009, Tegeler, et al, 2011). Such incentives tend to lead LIHTC projects to be located in predominantly minority and high-poverty areas than other rental assistance housing programs (Abt Associates Inc, 2010, Schwartz, 2015).
The highest percentage of LIHTC projects was found to be located in central cities where the minority concentration is high (Abt Associates Inc, 2010). About 46% of LIHTC developments are located in central cities, about 29% development units are in suburban areas, and 25% of such developments are located in non-metropolitan areas (Schwartz, 2015).
In the QAP, the state agency sets the priorities to select the projects competing for tax-credits. QAP considers 10 items to prioritize the projects and “location” is one of them (Gramlich, 2014). The QAP may give
preference to the developers who submit the projects that are likely to serve particular target groups or locations (Gramlich, 2014). For example, it gives preference to the projects that can serve the lowest income group for a longer period of time, located in QCTs or DDAs. Also, the state QAP can consider LIHTC projects to be located with proximity to daily necessities and other important services (Adkins et. al, 2017).
Housing Choice Voucher (HCV)
In this program, HUD provides funding to the PHAs and the PHAs operate the voucher program locally. PHAs provide subsidy to the owner of rental project units to support low income households. The landlord receives two types of payments: one from the renters and another from the PHAs. The renters’ portion of the payment is called the ‘total tenant payment (TTP)’ and is based on household income. On the other hand, PHA’s portion of the payment is known as ‘rent subsidy’ (Technical Assistance Collaborative, n.d.). The program considers the TTP to determine the minimum amount a family can contribute for rent and utilities regardless of the location of the unit they selected (HUD, n.d.-c). The program determines the TTP based on the monthly
12 adjusted income or monthly gross income of households to pay the rent for supported properties. The amount of TTP a family pays is the highest of the following amounts (HUD, 2002):
30% of the family’s monthly adjusted income;
10% of the family’s monthly gross income;
Welfare rent (in States where applicable); or
Minimum Rent ($0 to $50 set by the PHA)
The first time receiver of voucher-assistance must not pay more than 40% of their adjusted income when they first receive the voucher and initially move into the unit. This maximum initial rent burden is applicable when the gross rent of the selected unit exceeds the applicable payment standard (HUD, 2016). The subsidy the PHA then pays toward the rent is the difference between the payment standard of the rental unit and TTP.
It is important for a family to know the maximum amount of subsidies provided by PHA while they are selecting a unit. A family with a monthly adjusted income of $325 must contribute $98 for monthly rent or a maximum of $130 during the first month of tenancy. PHA can contribute up to $102 to adjust the payment standard of a rental unit. If the family chooses a unit that costs more than PHA’s payment standard, then the family has to pay more of its income toward rent (Technical Assistance Collaborative, n.d).
Welfare Rent applies in states that have “as-paid” public benefit programs. The maximum amount designated for rent and utilities is called the “welfare rent” (Kier Property Management and Real Estate LLC, 2010). Such welfare programs designate a specific amount for shelter and utilities and adjust that amount based upon the actual payment a family spends for shelter and utilities. For example, the designated amount for shelter and utilities can be no more than $200. The monthly income of a family is $520. If welfare assistance for other needs is $220 and other income is $100, then the welfare rent would be = $520 – ($220+$100) = $200.
Location Criteria HCV projects: The recipients of HCV have the flexibility to select the housing units of
their preference. This program encourages participants to live in safe and low-poverty neighborhoods. This can bring benefits like access to better quality housing with safety, employment, better education, and retail services (McClure, 2010). For this, the PHAs have incentives to find landlords who have their housing units located in low-poverty neighborhoods and then provide a list of those housing units to new participants of the HCV program (Devine, et al, 2003). The availability of suitable units also depends on the willingness of
landlords to participate in the HCV program.
Previous research found that, when participants search for new housing units they primarily consider the suitable size of the housing unit and whether the utility costs are covered within monthly rent payment. Their secondary concerns are neighborhood environment, school quality, proximity to jobs, and convenient access to shopping and transportation (Galvez, 2010). Some participants prefer to live in proximity to their previous housing location due to their inclination to live closer to their relatives, friends, or within familiar social networks (Devine, et al, 2003, Galvez, 2010). Sometimes the challenges faced by the recipients also influence their location decision. For example, recipients might be unfamiliar with low-poverty neighborhoods; they
13 may experience discrimination and rejection from landlords, a considerable amount of moving costs, and competition among voucher holders for the same apartment, all of which can influence their location decision (Galvez, 2010). Yet, location efficiency and the consequent transportation costs are not part of the criteria for the subsidy allocation.
Continuum of Care (CoC)
The CoC program is primarily designed to support homeless individuals or families that are in immediate need of housing assistance. The program plan seeks to address four basic perspectives:
- Identify a homeless individual’s or family’s need for a home through assessment and connect them to suitable housing and related services
- Provision of safe, decent alternatives to the streets and provision of emergency shelter
- To support people through transitional housing to develop the necessary skills to access permanent housing
- Support and provision for permanent housing and supportive services (Schwartz, 2015; HUD, 2012) In addition to these, this program can also establish the standard for rental assistance to support homeless individuals or families (HUD, 2012). Any rental assistance programs funded through CoC may charge program participants to pay rent (Technical Assistance Collaborative, n.d.). The occupancy charge system for the CoC program is the same as for the HCV program in that it uses the calculations of ‘Total Tenant Payment’ as discussed above (HUD: CoC 2.0, n.d, Technical Assistance Collaborative, n.d). However, the major difference is that, at any time, the CoC program does not allow a household to pay more than the highest amount
calculated. For that, PHAs need to carefully maintain the process of determining a households’ share of rent so they are not overcharged (Technical Assistance Collaborative, n.d).
Location criteria for CoC: The CoC program interim rule under the Title 24 CFR 578.7(c) emphasized that,
in order to serve the homeless and extremely low income people, the Continuum should develop a plan. The plan should synchronize the housing and service system implementations within an area to serve the existing homeless as well as low income individuals and families (Cornell Law School, n.d. a). The HUD did not mention any fixed regulations to locate CoC projects on any site with specific preferences. From previous studies, it has been found, that particular factors can influence the housing authorities to decide the location for CoC
programs. For example, for relocating a CoC settlement in St. Paul County, Minnesota, the housing authorities considered the location of schools where children of extremely low income or homeless families were
attending. The housing authorities tried to carefully consider the relocation of housing units relative to the location of schools so as to not interrupt the education of affected children. For that, they made the decision in their settlement in collaboration with the new and previous school districts to allow homeless children to study uninterruptedly. In their agreement, they sought to ensure that relocated students could still attend schools utilizing school buses; therefore, a regular school bus stop was added nearby to their new living center (HUD, 2009).
14 Section 202 Supportive Housing for the Elderly Program (202/PRAC)
This program is specifically designed to provide housing supports to low income people of 62 years or older (HUD, 2016a). This program aims to enable residents to live independently as long as possible with an effort to avoid the cost of institutional care in nursing homes (Schwartz, 2015). This program subsidizes housing in two ways: first, providing capital funds to nonprofit organizations to cover the cost of property acquisition,
rehabilitation and construction of housing units and second, providing project rental assistance funds to the PHAs or developers to cover the difference between HUD approved operating costs and the renter’s payment (Schwartz, 2015, HUD, 2016a). Similar to HCV, under this program, families have to pay 30% of their adjusted income for rent. PHAs or sponsors cover the rest of the amount for rent. Aside from these, project rental assistance funds may also be used to provide supportive services like transportation, housekeeping or laundry (HUD, 2016a).
Location criteria for Section 202: According to Title 24 CFR Section 891.125, in locating a housing unit in a
specific area, the following criteria should be approved by the housing authorities (HUD, n.d., Tegeler, et al, 2011):
- The location should be suitable in order to comply with the relevant provision of “Title VI of the Civil Rights Act of 1964, the Fair Housing Act, and Rehabilitation Act of 1973” to ensure prohibition of discrimination in terms of race, color, religion, age, gender, disability or national origin (Cornell Law School-Section 891.125, n.d-b. HUD, n.d.).
- The sites for new housing construction should not be located in areas of ‘minority elderly
concentration’ and must not be located in areas of racial mix in order to avoid increased ‘proportion of minority to nonminority elderly residents’. It might be exceptional in some cases to be located in an ‘area of minority’ if there are overriding housing needs and that can be supported by this project. - Also, the site must provide a broad range of housing choices as well as try to avoid
excessive-concentration of assisted persons within an area that contains a higher proportion of low income people (Tegeler et al, 2009, Cornell Law School, n.d.-b). The environment of the neighborhood should not be unfavorable to family life and should not contain substandard dwellings.
- The emphasis should be given to the accessibility of sites to commercial, social, educational,
recreational, health, and civic facilities and services that are usually found in neighborhoods (Tegeler et al, 2009, Cornell Law School, n.d.-b)
Section 811 Project Rental Assistance (PRA) Program (PRAC811)
This program supports low income persons with disabilities to live independently with the provision of supportive services as well as subsidized rental housing units (HUD, 2016a). The rent for a rental assisted unit is calculated in terms of TTP as discussed earlier in this section. The amount should not exceed a maximum of 30% of the monthly adjusted income; 10% of the monthly gross income; welfare rent (welfare recipients as paid localities only) or $25 minimum rent as discussed above. Like other rental assistance programs, PHAs or sponsors provide subsidies to the participants to cover the difference between housing operating costs and the tenant’s contribution toward rent (HUD, 2016a).
15
Location criteria for Section 811: This program follows the same site and neighborhood standards as for
the Section 202 program. However this program has few additional site and neighborhood requirements: The travel time and cost via private vehicles as well as public transit should not be excessive while
commuting from the neighborhood to areas of employment that have jobs for low or very low income workers (Cornell Law School, n.d.-c)
The housing units under this program need to be located in neighborhoods where other family housing is also located. It may not be located adjacent to facilities like daycare centers for persons with disabilities, medical facilities or other types of housing facilities that are serving persons with disabilities (Cornell Law School, n.d.-c).
Multifamily Housing Assistance
This study also covers three different programs under the category of Multifamily Housing Assistance including Section 236 or Below Market Interest Rate, Section 8 Project Based Rental Assistance Renewal Program, and Rental Assistance Demonstration.
The Section 236 or Below Market Interest Rate (BMIR) provides support to construct low-cost rental housing by reducing mortgage interest or debt service expenses for the mortgagee. The Section 236 program allows developers to receive interest subsidies in terms of a reduced mortgage interest rate as low as 1% (Schwartz, 2015, HUD. Gov, (N.D): HUD Occupancy Handbook). HUD provides an annual subsidy to developers to cover the ‘difference between a market-rate mortgage and a mortgage charging at an interest rate of 1%’ (Schwartz, 2015, p. 204). This interest reduction helps to decrease operating costs and consequently can provide a reduced rental structure (HUD. Gov, (N.D): HUD Occupancy Handbook).
Properties under this program have a HUD approved basic rent and market rent (Kier Property Management and Real Estate LLC, 2010). The basic rent is the rent that the tenants must pay depending on their income and owners must collect to cover the property’s operating costs. The market rent is the amount of rent that the landlord would charge if the mortgage for the property was not subsidized. In the case of properties with no utility allowance, the tenants of this program can pay either a maximum of 30% of their monthly adjusted income or the approved basic rent of the Section 236. In the case of properties with utility allowances, the rent they pay is either a maximum of 30% of their monthly adjusted income less the utility allowance, or 25% of their monthly adjusted income, or the basic rent. The tenants never pay less than the basic rent or more than the market rent for the assisted properties.
Though this program no longer provides insurance or subsidies for new mortgage loans, existing Section 236 properties continue to operate under the program (HUD, 2016). In some cases, if Section 236 properties experience increased operating costs which cause basic rents to increase beyond the affordable limit for low income people, then HUD provides assistance through Section 8 Loan Management Set-Aside (LMSA), Rent Supplement, or Rental Assistance Program (RAP) to those Section 236 properties to reduce operating costs (HUD. Gov, (N.D): HUD Occupancy Handbook). This program follows the same location standards as the 202/PRAC and PRAC811 programs.
16
Section 8 Project-Based Rental Assistance Renewal Program: HUD renews “Section 8 Project-Based Housing
Assistance Payments (HAP) contracts” with landlords of multifamily rental housing properties. Rental assistance calculations follow the same regulations as discussed under the HCV program. The location standards for this program are the same as HUD’s site and neighborhood standards already discussed under the 202/PRAC and PRAC 811 programs (HUD, n.d., Cornell Law School, n.d.).
Rental Assistance Demonstration (RAD) allows for the conversion of HUD financed units to project-based
Section 8 contracts. There are competitive and non-competitive components for conversion. The competitive components allow for up to 60,000 units of other HUD assisted programs to convert into Section 8 rental assistance contracts. For rental assistance, this program follows the rental allowance calculation described under the HCV program and the location criteria as described under the HUD’s site and neighborhood regulations, mentioned under the 202/PRAC and PRAC 811 programs.
Housing Trust Fund (HTF) program
The funds for assisting low income people are provided to states. States then distribute the money to qualified nonprofit and for-profit organizations or to the state-designated agencies (HUD, 2016a).
This program provides support for both housing rent and homeownership. For rental assistance, this program considers an amount equal to or lesser than 30% AMI as the maximum limit for rent; households living in the assisted properties must pay that fixed amount. In order to make the HTF properties affordable for
households living below 30% AMI, the National Low Income Housing Coalition (NLIHC) suggested having units with mixed rents in HTF properties. They suggested that, HTF assisted properties can have 30% of units that accept the rent equal to 30% AMI, 30% of units for rent equal to 20% AMI, and 30% of units that accept rent equal to 10% AMI (NLIHC, 2017). For homeownership, this program targets households with incomes less than 50% AMI. Under the HTF program, at least 80% of the funds is used for rental housing (i.e. construction, rehabilitation and maintenance of rental units) and another 10% is used to support first-time homebuyers. It provides assistance to homebuyers by helping with the down payment, closing costs, and interest-rate buy-down assistance.
Location criteria for Housing Trust Fund: this program requires the site and neighborhood standards
under Section 93.150 (HUD, 2015). According to this section, the housing authority should operate the HTF program in locations that are suitable from the standpoint of supporting the provisions of Title VI of the Civil Rights Acts of 1964 and the Fair Housing Act (Cornell School of Law, n.d.). For new construction of any rental housing unit, the criteria of the site should follow the same requirements as Section 202/PRAC program. Some local authorities have additional location considerations. New York, for example, gives a higher priority to blights due to the existence of substandard housing stock and unsanitary conditions. They define blights as areas which have an aged housing stock or vacant non-residential properties where private developers are unwilling to provide affordable housing without government support (Homes and Community Renewal, 2015).
17 The HOPE VI
This program was established with the goal to transform or revitalize severely distressed public housing. This program is also called Housing Opportunities for People Everywhere (HOPE). The activities under this program include the provision of capital costs for changing the physical shape of public housing (e.g. demolition,
reconstruction and other physical improvements), provision of support services, and provision of planning and technical assistance (HUD, 2016a). This program also provides support for the demolition of severely
distressed public housing units and the procurement of sites for ‘off-site construction,’ and it initiates support service programs for relocated residents due to the revitalization of housing units (HUD.GOV: About HOPE VI). The residents relocated due to HOPE VI receive a voucher to rent housing units in the private market (Goets, 2010, Schwartz, 2015). The rental subsidy for voucher holders of any public housing is calculated in the same way as HCV (HUD, 2002). People can move to neighborhoods from their distressed public housing unit and eventually can come back to the redeveloped housing site. Even if they don’t return, previous studies found that residents move to a better neighborhood of improved social and economic conditions where they generally prefer to live (Goets, 2010, Smith et al. 2002). The relocated residents with vouchers have the flexibility to choose other neighborhoods in which to live (Smith et. al, 2002).
Location Criteria for selecting a place for HOPE VI Development: HUD does not explicitly define
“severely distressed housing” or how they determine the list of properties to support and if there is any criteria for the locational preferences. However, according to the literature, HOPE VI programs work for housing units needing a broad range of rehabilitation efforts. Popkin et al. (2002) studied the HOPE VI units in five different cities in the U.S. In all cases, the administering local housing authorities submitted an application for HOPE VI grants to address the problems of their most severely damaged public housing. All of them were built before 1970, with the oldest developed in 1941. They were obsolete and in extremely poor physical condition. In all cases a HOPE VI grant was provided to the properties which were reported with problems of damage due to severe weather conditions, asbestos in floors, damaged piping, nonfunctioning toilets, leaking roofs and sewers, inoperable elevators, unit design and site layout problems.
All housing developments discussed by Popkin et al (2002) were located in high-poverty and predominantly minority neighborhoods. The neighborhoods of those developments were found to be located typically in convenient locations in terms of access to public transit and downtown employment centers with proximity to daily amenities and recreational facilities. Public transit was accessible within a 15-minute walking distance from the housing developments. Overall according to the literature, to fund projects with HOPE VI grants, HUD considers the severity of structurally distressed conditions of public housing in addition to the location relative to extremely poor or minority neighborhoods (HUD, 2016, Popkin, 2002). Since 2010, no new funding has been appropriated and HUD is currently administering only the existing grants (HUD, 2016a).
Section 32 Public Housing Homeownership Program
Under this program, the PHAs make public housing units affordable to purchase by low income families. The PHAs may sell the entire development or a portion of public housing to eligible public or non-public housing residents. This program provides subsidy to low income families through “(i) down-payments or closing cost
18 assistance, (ii) subordinate mortgage and (iii) below market financing” (HUD: Guidance for PHAs developing a section 32 homeownership plan, n.d.-e, p. 2). The PHAs allow for purchasing a house with a 1% down-payment (HUD, n.d). The closing costs are typically thousands of dollars in fees that a borrower needs to pay to several third parties at the time a mortgage closes (The FreeandClear, n.d.). This program provides assistance to low income home buyers to pay these closing costs while purchasing a home. Below market financing helps
homebuyers to purchase a home for less than the current market value of that home. A subordinate mortgage takes into account the process of involving a second mortgage on a property as a legal agreement which ranks one mortgage behind another mortgage to collect repayment from a debtor. HUD defines this mortgage as “a loan secured by a mortgage against a homeowner’s property that is inferior to the first loan and secured against the same property”. Subordinate mortgages are frequently structured as “soft” (involving no interest and no payment by the purchaser) and are typically forgiven gradually overtime. The following is an example discussed by HUD (n.d.-e, p. 12) regarding the calculation of varying amounts of subsidies to support
homeownership under the Section 32 Public Housing Home Ownership Program:
Item Amount
Fair Market Value (appraised value of existing unit) $ 90,000
Sales Price (PHA-determined below market sale price) $ 70,000
First Mortgage Proceeds (1st Mortgage amount based on purchaser’s income $ 52,000
Down-payment (minimum 1% of sales price, here 5%) $ 3,500
Closing Costs (from local down-payment or closing cost assistance) $ 3,000
PHA Mortgage Needed = (Sales Price – First Mortgage – Down payment) $ 14,500
Total Subsidy Received from PHA:
Below Market Financing (Difference of Fair Market value and Sales Price) $ 20,000
Second Mortgage (or Subordinate Mortgage) $ 14,500
Total PHA Contribution $ 34,500
Table 2: Calculation of Subsidy under Section 32 Public Housing Home Ownership Program
In this example, the PHA will provide a total of $34,500 in support to low income families in order to purchase their targeted house.
Location Criteria for Section 32 Public Housing Homeownership Program: The location of the
property purchased under this program depends on the preference of the homebuyer; PHAs approve any properties located within their operational jurisdictions (HUD, n.d.-e).
HOME Investment Partnership (HOME)
This program provides grants to states and participating jurisdictions (PJs) to fund a wide variety of affordable housing activities that generally fall into four categories: assistance to homebuyers for housing acquisition; construction of rental housing; rehabilitation of owner-occupied housing; and direct rental assistance (HUD. GOV: HOME Investment Partnerships Program, n.d.; Jones, 2014).
19 Forty percent of HOME funds are allocated for states and 60% to the localities. Once a PJ receives the formula allocation, it must provide the fund to specific projects within 24 months and spend the fund within a five-year period. Otherwise, the funds will revert to HUD and will be relocated to other PJs. Projects that use HOME funding need to meet income criteria and conditions of affordability requirements. For example, for rental assisted units, the rents must be less than the fair market rent of similar units within the jurisdiction, or the rent should be equal to 30% of the adjusted monthly income of a family whose income is 65% of AMI. Additionally, for rental housing, at least 90% of occupants that receive tenant-based rental assistance must have incomes of no more than 60% of the area median income. The remaining 10% of households must have incomes at or below 80% of AMI (Jones, 2014). The HOME project provides rental subsidy by covering the difference between a household’s share of income toward rent (i.e. 30% of a household’s adjusted income) and the rent limit established by the PJ. For homebuyer assistance, the initial purchase price of housing or the value of it after rehabilitation should be equal to or less than 95% of the median purchase price of a home in that jurisdiction as determined by the Secretary of HUD (Jones, 2014).
Location Criteria for HOME Development: For HOME programs, the participating jurisdiction is
responsible to determine that the site meets the requirements similar to the 202/PRAC and PRAC 811 program (Cornell Law School, n.d.-c).
TRANSPORTATION COSTS AND AFFORDABILITY STUDIES
Previous studies have criticized HUD’s simple percentage (or ratio) of the income-to-housing cost measure to define housing affordability. They indicated that the ratio fails to include other ‘cost of living variables’, such as transportation and other living expenditures (Jewkes and Delgadillo, 2010). In most cases, housing
affordability studies disregarded the spatial dimensions of transit cost despite the influence of distance on land cost, housing value, and household transportation costs (Mattingly and Morrissey, 2014).
Transportation, however, is the second largest spending sector of a household budget (CTOD and CNT, 2006, U.S. Bureau of Labor Statistics (2007). In recent years, transportation cost in affordability has become a growing concern and is suggested to be factored in while measuring affordability for low income families (Hamidi et. al, 2016, Mattingly and Morrissey, 2014, Isalou et. al, 2014). This issue is getting attention not only in the United States but also in other countries where ratio of income-to-housing cost is considered to
measure housing affordability. For instance, Mattingly and Morrissey (2014) found that there is decreased affordability in the peripheral areas of Auckland-Netherland if transportation costs are included in the
measure. In some urban fringes, the percentage of income spent for housing and transportation was found to be more than 70%. Results of these studies suggest that when transportation costs are incorporated into methods of quantifying affordability, a better image of affordability is presented over traditional measures of housing affordability.
The reason is simple. Residents living in location efficient neighborhoods require less travel time and
20 for influencing the cost of housing and transportation, especially the distance between residential
neighborhoods and work places. Developing affordable housing for low income families in location efficient areas can reduce VMT at a greater rate than developing that land for higher income households (CNT, 2015). Litman (2017) thus considered “location efficient” or “Affordable-Accessible Developments” as lower-cost residential areas in which households can reduce transit costs due to compactness, multimodal choices, and affordable access to activities and services.
The greatest challenge in studying transportation affordability is determining the measurement methodology for transportation costs and incorporating that into the concept of affordability. In 2006, the Center for Neighborhood Technology (CNT) attempted to address this challenge by developing the Housing +
Transportation Affordability Index. The H+T Index took into account not only the cost of housing but also the intrinsic value of location as quantified through transportation costs. According to CNT, housing is affordable if the combined costs of housing and transportation do not exceed 45% of a household’s income. Later in 2013, in a joint project by the departments of Transportation and Housing and Development, the index was
upgraded to become the Location Affordability Index (LAI). The LAI is based on the same methodology as the H+T Affordability Index but uses the most recent and better quality data with more coverage.
One major limitation of both the H+T index and the LAI is that they measure affordability for a typical
household. Both indices fail to measure affordability when accounting for transportation costs for low income households as the primary users of HUD rental assistance programs (Hamidi, et al, 2016). The travel and vehicle ownership patterns of low income households are likely to be significantly different from those of higher-income households.
Most recently, Hamidi et al (2016), using disaggregate household travel data from 15 diverse regions around the U.S., estimated and summed automobile capital costs, automobile operating costs, and transit fare costs for households at 8,857 HUD multifamily Section 8 rental assistance properties. Their models account for all of the built environmental variables which are also known as so-called D variables (i.e. density, diversity, design, destination accessibility and distance to transit) that found to affect travel and vehicle ownership in peer-reviewed literature. Their analysis is based on disaggregate (household) travel and vehicle ownership data for tens of thousands of households in many diverse metropolitan regions of the U.S. This allows travel to be modeled in terms of the precise built environment in which households reside and travel occurs. They found that the mean percentage of income expended on transportation was 15% for households at the high end of the eligible income scale. However, in highly sprawling metropolitan areas and in suburban areas of more compact metropolitan areas, a higher percentage of household budgets is spent on transportation, which exceeds the 15% threshold.
This study is built on the work of Hamidi et al.’s (2016) findings and modeling efforts. Our study, however, covers all major affordable housing programs in DFW. Focusing on various programs yields the ability to assert comparisons on the efficiency of these programs in providing true affordability.
21
1 - 0 3 | M E T H O D O L O G Y
To calculate housing and transportation affordability, this study follows the work of Hamidi et al. (2016). Inclusion of address level disaggregated data and use of a transportation cost model designed to consider low income people provides higher validity as compared to the LAI methodology.
SAMPLE
We gathered address level data for properties in major affordable housing assistance programs in DFW
through an extensive data collection process. We used three major data sources in our data collection process: 1) “Picture of Subsidized Households” website: This particular website of HUD contains the data of Public Housing, Housing Choice Vouchers (HCV), Section 8 Project Based Rental Assistance, Rent
Supplement, Below market interest rate - section 236 (S236/BMIR), Section 202 Supportive Housing for the Elderly Program (S202 PRAC) and Section 811 Supportive Housing for Persons with Disabilities (S811 PRAC), HOME Investment Partnership Program and of Low Income Housing Tax Credit (LIHTC). 2) HUD eGIS Storefront: This site provides HUD's geospatial datasets with web-based mapping tools. For our study, we extracted location data for Multifamily Assisted properties, Public Housing properties and HOME Investments Partnerships (HOME).
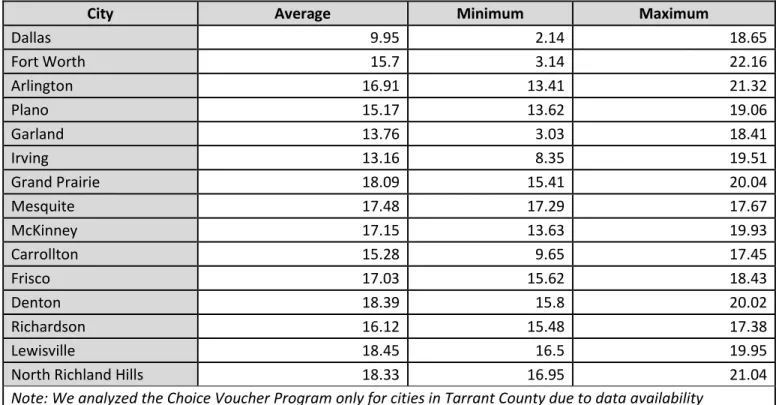
3) Local Housing Agencies in DFW: Contacting the local agencies in DFW, we acquired the data for Housing Choice Vouchers (HCV) and Continuum of Care (COC) for Tarrant County.
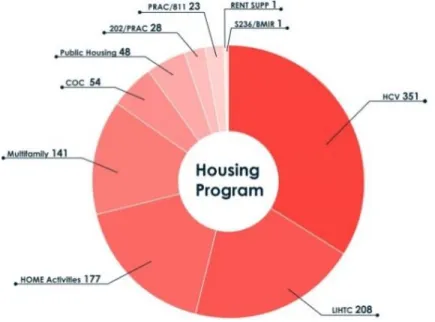
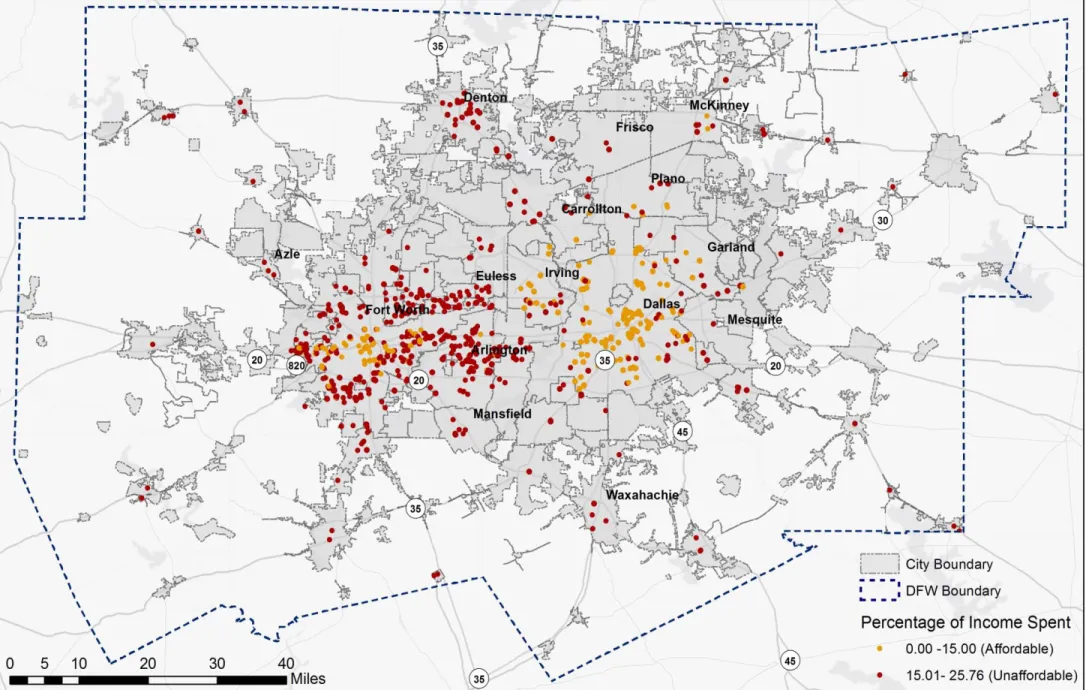
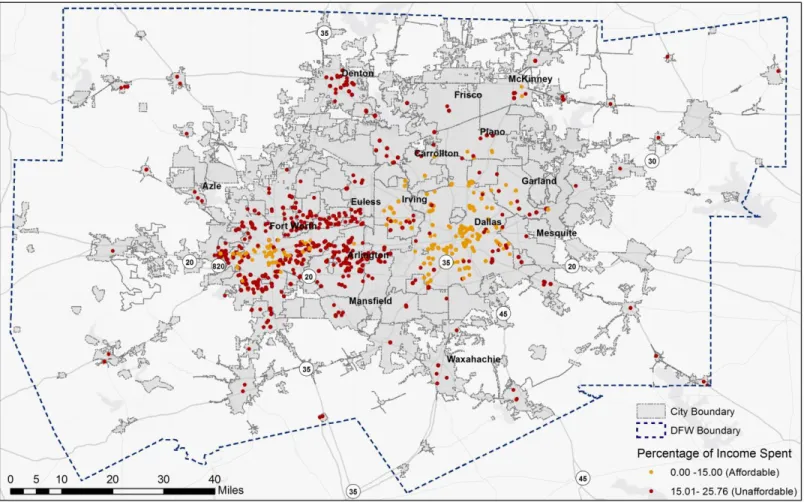
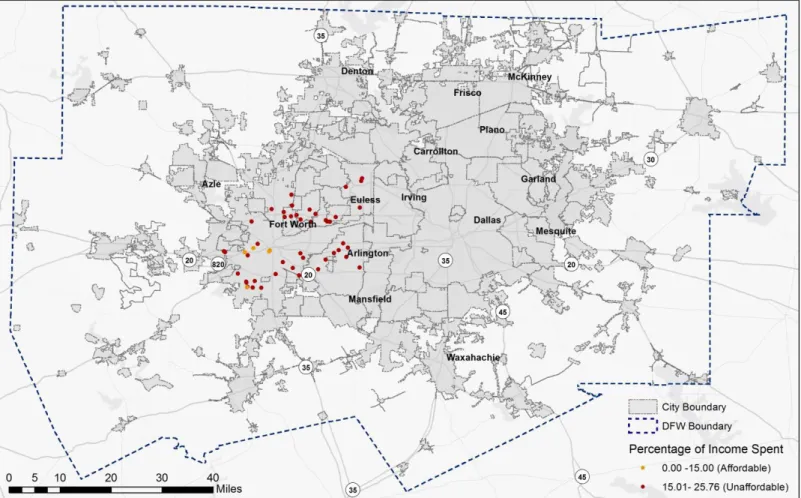
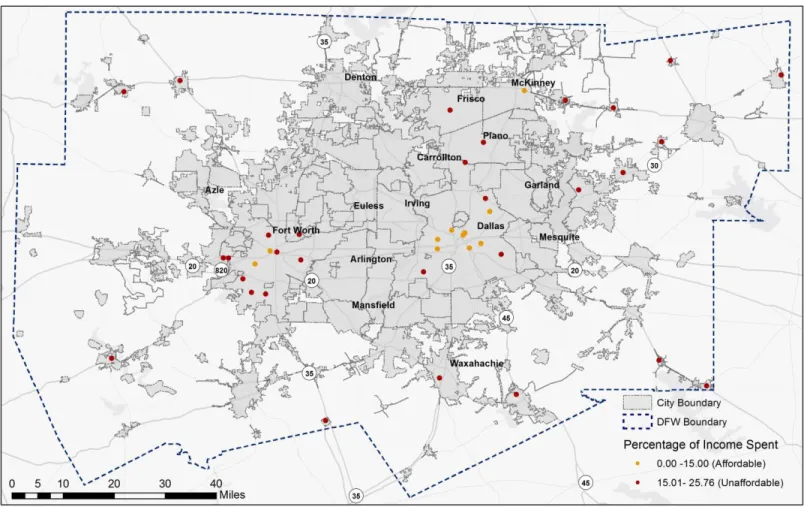
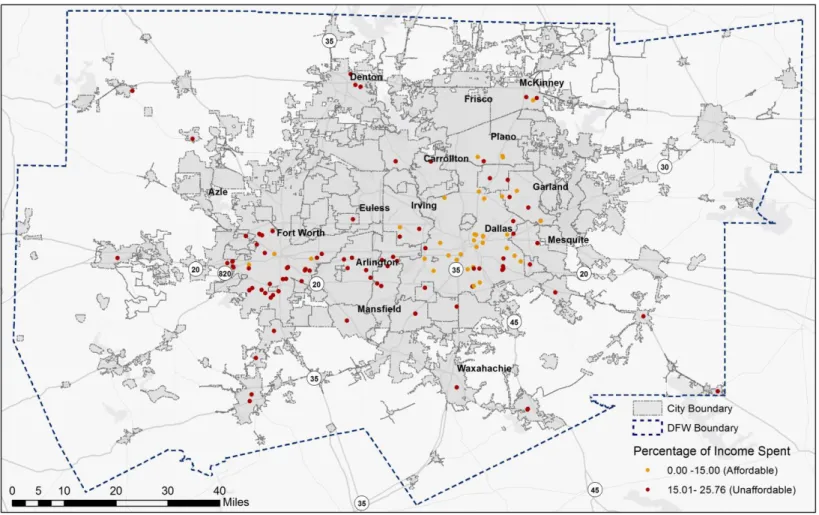
We successfully geocoded all 1032 housing assistance properties found in the sample. Figure 1 shows the number of housing properties under different programs and Figure 2 shows spatial distribution of these properties in DFW region.
22
Figure 2: Location of assisted housing properties in DFW
23 In order to estimate transportation outcomes, we created network buffers of ¼-mile, ½-mile, and 1-mile around these locations using Business Analyst and measured D variables in these buffers. The D variables that are extensively related to travel within the literature are population and job density (actden), diversity
measured in terms of jobs–population balance and land-use entropy (entropy), design measured in terms of intersection density (intden) and street connectivity (int4way), destination accessibility measured in terms of jobs reachable within a given travel time by automobile(emp10), and distance to transit measured as the frequency of transit service in the neighborhood (tfreq). Variables extracted from these datasets and used in subsequent transportation cost calculations are shown in Table 3. The table makes reference only to ½-mile buffers, but data for ¼-mile and 1-mile buffers are also available. This gave us a total of 21 built environment variables around each housing assistance property.
Category Symbol Definition Level
Outcome variables
vmt Household VMT Household
transit Household number of transit trips Household
veh Number of household vehicles Household
Household
sociodemographic variables
hsize Number of household members Household
emp Number of household workers Household
inc Household income (in 1982 dollars) Household
Built
environmental variables
actden Activity density within a half mile (sum of population and
employment divided by gross land area in square miles) Household
entropy
Land use mix within a half mile of a household (entropy index based on net acreage in different land use categories that ranges from 0, where all developed land is in one use, to 1, where developed land is evenly divided among uses)
Household
intden Intersection density within a half mile (number of intersections
divided by gross land area in square miles) Household
int4way Proportion of 4-way intersections with a half mile (4-or-more-way
intersections divided by total intersections) Household
emp10 Proportion of regional employment accessible within a 10-minute
travel time via automobile Household
sf Single-family housing unit (dummy variable; yes=1, no=0)
tfreq Aggregate frequency of transit service within a quarter mile of
block group boundary per hour during evening peak period Block group
Table 3: Variables Used in the Household Transportation Cost Calculations
TRANSPORTATION MODELS
In this study, we use the same methodology as CNT, LAI and Hamidi et al. (2016) and estimate household transportation costs as the sum of three terms - automobile ownership, automobile use and public transit:
24 Where,
C = cost factor (i.e. dollars per mile)
F = function of the independent variables (F_AO is auto ownership, F_AU is auto use, and F_TU is transit use) For computing the F variables, instead of developing transportation models, we borrow equations from Hamidi et al.’s (11) study since their models have all of the specifications we need for this study.
(1) Household vmt = oddsanyvmt*vmtpred
a) oddsanyvmt = exp [1.7+(0.2*hsize)+(0.3*emp)+(0.03*inc)+(0.9*sf)-(0.02*emp10)-(0.7*entropy)-(0.003*intden)-(0.01*pct4wy)-(0.0009*tfreq)]
b) vmtpred = exp [2.6+(0.2*hsize)+(0.2*emp)+(0.007*inc)-(0.008*emp10)-(0.005*actden/1000)-(0.3*entropy)-(0.002*intden)-(0.003*pct4wy)-(0.00009*tfreq)]
(2) Household vehicle ownership = exp [-0.1+(0.1*hsize)+(0.1*emp)+(0.009*inc)+(0.3*sf)-(0.002*emp10)-(0.006*actden/1000)-(0.1*entropy)-(0.0009*intden)-(0.001*pct4wy)-(0.003*tfreq)]
(3) Number of household transit trips = oddsanytransit*transittrip a) oddsanytransit = exp [-2.8+(0.2*hsize)+(0.3*emp)-(0.02*inc)–
(0.8*sf)+(0.5*enthropy)+(0.003*intden)+(0.01*pct4wy)+(0.0009*tfreq)] b) transittrip = exp [0.9+(0.1*hsize)–(0.006*inc)+(0.2*entropy)]
Finally, we used sociodemographic characteristics of a typical low income household in all transportation equations as the focus of this paper was to evaluate affordability for a typical low income household. As a result, in all five equations, sociodemographic characteristics (household size, household income, and number of workers in the household) were kept constant so the variation in predicted transportation outcomes is a result of the built environmental variability and not sociodemographic characteristics. To obtain
sociodemographic characteristics of a typical low income household, we used the National Household Travel Survey (NHTS) database and extracted a subsample of households who qualify for HUD rental assistance, i.e. those with annual incomes of less than 80% of AMGI.
TRANSPORTATION COSTS CALCULATION
Transportation costs consist of vehicle costs (a household’s expenses to own and use private vehicles) and public transit costs (transit fares). Vehicle costs are divided into fixed and variable costs. Fixed or ownership costs are not generally affected by the amount a vehicle is driven. Depreciation, insurance, and registration fees are considered fixed. Variable costs are the incremental costs that increase with vehicle mileage. Fuel is a variable vehicle cost proportional to mileage (Litman, 2009).
We computed vehicle fixed costs based on our household vehicle ownership model and the average cost of car ownership. Our average car ownership costs are based on a car ownership cost calculator called the True Cost to Own® pricing (TCO®) system developed by Edmunds Inc. The components of TCO® are depreciation, interest on financing, taxes and fees, insurance premiums, fuel, maintenance, repairs and any federal tax