Clist, Paul (2010) Aid allocation, composition and
effects. PhD thesis, University of Nottingham.
Access from the University of Nottingham repository: http://eprints.nottingham.ac.uk/11642/1/Clist_2010_PhD.pdf Copyright and reuse:
The Nottingham ePrints service makes this work by researchers of the University of Nottingham available open access under the following conditions.
· Copyright and all moral rights to the version of the paper presented here belong to
the individual author(s) and/or other copyright owners.
· To the extent reasonable and practicable the material made available in Nottingham
ePrints has been checked for eligibility before being made available.
· Copies of full items can be used for personal research or study, educational, or
not-for-profit purposes without prior permission or charge provided that the authors, title and full bibliographic details are credited, a hyperlink and/or URL is given for the original metadata page and the content is not changed in any way.
· Quotations or similar reproductions must be sufficiently acknowledged.
Please see our full end user licence at:
http://eprints.nottingham.ac.uk/end_user_agreement.pdf A note on versions:
The version presented here may differ from the published version or from the version of record. If you wish to cite this item you are advised to consult the publisher’s version. Please see the repository url above for details on accessing the published version and note that access may require a subscription.
A
A
,
C
OMPOSITION AND
E
FFECTS
PAUL CLIST
T
HESIS SUBMITTED TO THE
U
NIVERSITY OF
N
OTTINGHAM
FOR THE DEGREE OF
D
OCTOR OF
P
HILOSOPHY
2
Contents
1. INTRODUCTION ... 9
2. THE TAX REVENUE EFFECTS OF AID GRANTS AND LOANS ... 15
2.2GRANTS VERSUS LOANS... 16
2.3METHODOLOGY ... 17
2.4RESULTS ... 21
Testing for the Break ... 27
Medium Term Aid Effects ... 29
Differences in Country Groups ... 31
2.5DISCUSSION ... 33
2.6CONCLUSION ... 37
3. LITERATURE REVIEW: AID ALLOCATION ... 39
3.2NORMATIVE LITERATURE:WHO SHOULD GET AID?... 40
3.3FINANCIAL PROGRAMMING RULES AND PERFORMANCE BASED ALLOCATION (PBA)FORMULAS ... 43
Critique of PBAs ... 45
3.4POSITIVE LITERATURE:WHO DOES GET AID? ... 46
3.5DESCRIPTIVE LITERATURE:AWIDER CRITIQUE ... 50
Earliest Descriptive works ... 50
Latest Descriptive works ... 52
Critique of Indices ... 53
3.6CONCLUSION ... 53
4. 25 YEARS OF AID ALLOCATION PRACTICE: COMPARING DONORS AND ERAS ... 55
3
Differences Over Time ... 57
Poverty and Policy Selectivity ... 58
4.3ECONOMETRIC APPROACH ... 60
Which Estimator? ... 62
Period Averaging ... 67
The Main Specification ... 67
Proximity ... 70
Which Donors?... 72
4.4RESULTS ... 72
Question 1: What are the Donor Differences? ... 72
Question 2: what are the changes over time? ... 76
Question 3: has poverty selectivity increased? ... 79
Question 4: has policy selectivity increased? ... 81
Robustness Checks ... 85
4.5DISCUSSION ... 87
4.6CONCLUSION ... 89
5. PULL THE OTHER ONE: GOOD GOVERNANCE AND THE FORGOTTEN POLICY LEVER IN AID ALLOCATION ... 92
5.2LITERATURE REVIEW ... 94
5.3ASIMPLE MODEL OF AID MODALITY CHOICE ... 106
5.4EMPIRICAL APPROACH ... 111
4
The Dependent Variables ... 115
Sample ... 116 Data Presentation ... 117 5.5RESULTS ... 119 AIDA Database ... 124 5.6DISCUSSION ... 128 5.7CONCLUSION ... 132 6. CONCLUSION ... 134 APPENDIX A ... 139
APPENDIX B: DESCRIPTIVE LITERATURE... 144
Identifying Donor-Errors ... 144
Latest Descriptive Works ... 151
APPENDIX C ... 157
APPENDIX D ... 166
Dependent variables ... 166
Independent variables ... 166
5
Table 2.1 Determinants of Tax/GDP Ratios (FE), 1970-2005 ... 23
Table 2.2 Determinants of Tax/GDP Ratios (FE), 1970-1990 ... 24
Table 2.3 Determinants of Tax/GDP Ratios (FE), 1985-2005 ... 25
Table 2.4 Determinants of Tax/GDP Ratios, Period-Averaged Panel (FE)... 27
Table 2.5 Testing for Breaks in 1984 ... 28
T M “ T E ... 30
Table 2.7 Splitting the Sample by Income Level, Lagged Aid (FE)... 32
Table 3.1 Selection of Existing Literature ... 48
Table 4.1 Diagnostics To Choose Between Estimators ... 66
Table 4.2 1982-2006, Parsimonious Specification, Eligibility Stage ... 73
Table 4.3 1982-2006, Parsimonious Specification, Level Stage (Standardised Coefficients) ... 74
Table 4.4 Wald Tests ... 74
Table 4.5 Chow Tests for Changed Relationships ... 77
Table 4.6 Wald Statistics for Donors with Significant Changes, Using the 4P Framework ... 78
Table 4.7 Retesting the GWOT dummies, USA ... 79
Table 4.8 Income Coefficients: by Step, Period, Stage and Donor ... 80
Table 4.9 1992-2006 Main Specification Eligibility Stage, Augmented With Policy Variables Interacted With Time Dummies ... 82
Table 4.10 1992-2006 Main Specification Level Stage, Augmented With Policy Variables Interacted With Time Dummies ... 83
Table 4.11 Augmented with CPIA: 2001-2006 Cross Section, Eligibility Stage ... 84
Table 4.12 Augmented with CPIA: 2001-2006 Cross Section, Levels Stage ... 85
Table 4.13 Step 1 and 2, Including Geographical Distance... 86
Table 5.1 Determinants of GBS recipients, Eligibility Stage 1997-2007 ... 120
Table 5.2 Determinants of GBS recipients, Eligibility Stage 2005-2007, Robustness Check ... 121
Table 5.3: Determinants of GBS recipients, Eligibility Stage 2005-2007 ... 122
Table 5.4: Determinants of GBS recipients, Level Stage 1997-2007 ... 123
Table 5.5 Program Aid, 2002-2006... 125
Table 5.6 Program Aid 2005-2007, robustness check ... 126
Table 5.7 Civil Society 2002-2006, Probit ... 127
6
L
IST OF
T
ABLES
(A
PPENDICES
)
Table A 1: Instrumental Variable Results (using annual data) ... 141
Table A 2: Determinants of Tax/GDP Ratios (RE), 1970-2005 ... 142
Table A 3: Investigating Time Effects, 1970-2005 FE ... 143
Table B 1 OECD Fragmentation Measure for DAC Members 2006, by Donor ... 154
Table B 2 Collections of Data ... 155
T B A ‘ E P I ficient Aid Channels Table ... 156
Table C 1 Descriptive Statistics ... 160
Table C 2 France: By Step and Time Period ... 161
Table C 3 Germany: By Step and Time Period ... 162
Table C 4 Netherlands: By Step and Time Period ... 162
Table C 5 Japan: By Step and Time Period ... 163
Table C 6 Sweden: By Step and Time Period ... 163
Table C 7 UK: By Step and Time Period ... 164
Table C 8 USA: By Step and Time Period ... 164
7
Figure 4.1 OLS and Latent predictions of Aid Allocations ... 62
Figure 4.2 PTS and Freedom Index, 2006 with ISO Labels ... 70
Figure 4.3 2006 ODA Commitments by Donor, as a % of Total Commitments ... 72
Figure 4.4 Poverty Sensitivity Coefficients 1982-2006 Level Stage, by Donor ... 81
Figure 5.1: Different Aid Instruments ... 94
Figure 5.2: Fraction of Recipients that are Allocated GBS ... 117
Figure 5.3 Percentage of GBS/Aid ... 118
Figure 5.4 Civil Society and General Programme Aid as % of Aid, 2002-2007 ... 119
L
IST OF
F
IGURES
(A
PPENDICES
)
Figure B 1 SPA Average Scores By Donor 2004-2006 ... 1538
A
CKNOWLEDGEMENTS
While this thesis is the work of a sole author, many people have contributed to its motivation, methodology and ideas. My two supervisors, for the most part, allowed me to make my own mistakes and learn my own lessons. Prof. Oliver Morrissey was particularly influential in the aid-tax chapter, indeed a co-authored version of chapter two is forthcoming in the Journal of International Development (DOI: 10.1002/jid.1656). Dr. Alessia Isopi was generous with her time for the model in the pragmatic selectivity chapter. In truth, their main contribution was simply in testing ideas through rigorous discussion, something that is keenly felt.
Helpful comments on the aid and tax chapter came from an anonymous referee, and Christopher Kirby gave very detailed feedback on the aid allocation chapter; both without any real reward.
Participants at seminars in Nottingham (various), New Delhi (Indian Statistical Institute and Delhi School of Economics) and Oxford (CSAE conference 2010) improved both the research and its presentation.
On a more personal note, I would like to thank my wife who has often reminded me that the questions herein are worth asking, and who did her best to understand the answers. Lastly, I would like to thank the God who says:
lf out for the hungry and satisfy the desire of the afflicted,
Isaiah 58.10 (ESV)
and
D
and whoever makes haste with his feet misses the
Proverbs 19.2 (ESV)
This process of knowledge creation has certainly not felt hasty, but neither has it diminished the desire.
9
1.
I
NTRODUCTION
Aid is not homogeneous in goal, composition or effect. This is a common theme throughout the thesis, and while it is a simple assertion it has far-reaching consequences. The idea of a heterogeneous effect has been partially incorporated into the aid-growth literature, and as research on development aid inevitably takes place in the shadow of the controversial research by Burnside and Dollar (1998; 2000, BD hereafter), this is a sensible starting point. That research has cast a long shadow for a number of reasons. First, it offered a simple
T
gives clear guidance as to its implications. Second, the research was given prominence in an important World Bank (1998) report. Third, while many research ideas become popular in unusually clear link running from a
growth (Easterly, 2003).
Perhaps in part because of its impact, the BD research has been widely criticised. The most direct attack on the BD results is also the simplest. Easterly, et al. (2004) retain the methodology, specification and country coverage of BD, but extend the sample from 1970 93 to 1970 97, and include previously excluded observations. This simple extension results in the aforementioned result disappearing (although it is replicated in the 1970 93 period). Burnside and Dollar (2004) have engaged with this criticism, and a number of papers corroborate their general conclusion (Collier and Dehn, 2001; Collier and Dollar, 2002, 2004; Collier and Hoeffler, 2004). However, a large number of papers directly attack the BD results and methodology (these include, but are not limited to, Dalgaard and Hansen, 2001; Easterly, 2003; Guillaumont and Chauvet, 2001; Hansen and Tarp, 2000; Hansen and Tarp, 2001; Lensink and White, 2001; Roodman, 2007).
While there have been many critiques and debates focused directly upon BD, the literature on aid effectiveness (narrowly defined as the effect of aid on growth) has splintered. Various stories have been told, each proposing a variable that determines the effect of aid on growth. The growth effect of aid has been found to be conditional on: the amount of aid (i.e. it has diminishing returns, Hansen and Tarp, 2001; Lensink and White, 2001); the economic environment (Guillaumont and Chauvet, 2001, who find aid helps to mitigate the negative effects of certain adverse economic circumstances); export price shocks (Collier and Dehn, 2001); civil war and good policies (Collier and Hoeffler, 2004); volatility (Lensink and
1 Introduction Paul Clist
10
Morrissey, 2000); investment (Gomanee et al., 2005a), and whether or not the recipient is in the tropics (Dalgaard et al., 2004).
A number of surveys and general discussions of the literature are available (Doucouliagos and Paldam, 2008; Doucouliagos and Paldam, 2009; Doucouliagos and Paldam, 2010; Hansen and Tarp, 2000; Roodman, 2007). However, a striking point is that the papers are so copious and profuse as to allow different summaries of the literature to arrive at opposite conclusions, each citing a large evidence base:
When we review the literature we find that the overwhelming majority of recent empirical studies do conclude that aid increases economic growth, and below we cite more than studies that find that growth would be lower in the absence of aid (Addison et al., 2005)
There would appear to be one inescapable conclusion from the preceding data... the vast majority of the literature finds that aid is effective in promoting growth (McGillivray, 2004b)
There appear to be almost no findings in the contemporary literature that a find a significant effect of aid on growth, b) are robust, and c) are free of the methodological problems described here (Roodman, 2008)
It is worth noting that the distinct conclusions found within the aid-growth literature are perhaps unavoidable. In order to accurately estimate the effect of aid on growth, the econometrician needs to successfully control for other factors. However, much of the profession is sceptical regarding our ability to do this (Rodrik, 2006). Indeed, there are also a large number of technical econometric complications as well (Durlauf et al., 2005; Roodman, 2008).This difficulty means a variety of specifications and approaches will be used, and so a diverse set of results is to be expected. Unfortunately in cross-country regressions on the
aid- L (1983)
One effect of the sheer size of the aid-growth literature has been the promotion of the growth effect of aid as the salient criterion on which aid should be judged. This comes in part
from a
and effect. Clemens et al. (2004) argue that the heterogeneous goals of aid mean we should expect heterogeneous effects. Indeed, as they argue, if economic growth is not the objective
11
of a large proportion of aid, it is unsurprising if it does not meet that objective. However, the persistent focus and attention on the aid-growth link, coupled with contrasting conclusions, has fuelled the belief that aid is inherently and severely flawed, as the number of critics in the public sphere illustrates (Bolton, 2008; Calderisi, 2006; Glennie, 2008; Moyo, 2009).
H
outcome. Alternatively, acknowledging the heterogeneous effects of aid means a more nuanced view can be taken, as different types of aid given for different reasons have different effects. Truly incorporating this would mean allowing for a growth effect of aid to be more complicated than purely mediated by one factor.
The unfortunate focus on establishing a growth effect of aid through cross-country regressions has meant that other questions regarding aid have been less widely discussed. However, a focus on the effects of aid is both understandable and fitting. The recurring critique is that aid is not as effective as it should be: Easterly (2006, pp.154) states that $2.3 trillion has been spent on aid over five decades with little measurable effect. As mentioned, without a counterfactual it is difficult to truly understand the effect of aid. It is clear, mes been a spectacular success... [it] has also been, (World Bank, 1998, pp.1) The recognition that aid has heterogeneous effects immediately implies that aid can become more effective as the causes of this differential impact are understood, and such knowledge utilised. The desire to maximise utility is at the heart of economics, and so a desire to increase aid effectiveness is not remarkable. However, the fact that the situations of many of the world s citizens remain so dire after so much aid explains the intensity of this focus.
So, what is to be done? While the question of aid effectiveness remains important, the econometric research in the field has reached something of an impasse. Indeed, the point of diminishing returns of further research into the growth effect of aid has surely been reached. Rather than add to the voluminous literature on aid effectiveness, we take a different approach, agreeing with Rajan and Subramanian (2005, pp.22-23) perhaps more fruitful to move beyond the inconclusive debate of whether aid is effective, and focus on specific ways it can be made to work better, by better understanding the
T
specific questions, with the ultimate aim of improving our understanding of the broader ones. For example, a recurring theme in the thesis is governance. While attempts to
1 Introduction Paul Clist
12
establish the effect of aid on growth face technical problems, focusing on more narrowly defined research questions enables us to examine specific channels of effect from aid to
T
ectiveness
of aid.
If governance is undermined by aid, this would represent a major concern over the effects of aid. A commonly cited channel for this detrimental effect is the link between aid and tax, a topic dealt with in the second chapter. Specifically, the concern is that aid results in the state becoming too independent from its own citizens, as the taxation link is weakened due to the increase in external finance (Moore, 2007). The recent historical evidence shows that the link between taxation and governance is strong (Ross, 2004), and so any evidence that aid breaks this link, and so undermines good governance, is an important matter. Knack (2001) reports that aid has indeed damaged governance on average, but without modelling the channel endogeneity is a problematic complication. However, governance is not the only concern when considering the relationship between aid and tax. If there is found to be a negative tax revenue effect of aid, donors may find that they are financing tax cuts rather than investment. If this is the case, aid may be non-additional but rather crowd-out development expenditure.
I focus on the specific link between aid and tax, and the assertion that different types of aid have different tax effects. This claim comes from Gupta et al. (2004), who state that aid loans have a positive relationship with tax revenues whereas for aid grants that relationship is negative. If this link is established, it implies a clear policy recommendation for donors to minimise a possible source of negative governance effects. However, aid loans have a problematic history, as they have helped produce heavily indebted countries, and have in some cases meant aid meant a net negative revenue transfer. Establishing the strength of evidence of a differential tax revenue effect is therefore crucial.
The broader debate over the relative merits of aid grants and aid loans became both controversial and newsworthy in 2001 when there was a disagreement between donor nations over the amount that the IDA W B
disburse in the form of aid grants (World Bank, 2001). The second chapter deals with both the general arguments surrounding the two modalities, and the specific question of their tax revenue effect.
13
The third chapter is an extended literature review of various types of research that have examined aid allocation. It is important to understand aid allocation because it sheds light upon the goal with which aid is given, and informs expectations as to its possible effects. By summarising four approaches, the chapter gives a broader view of aid allocation. First, it discusses literature that proposes an ideal allocation, as informed by some allocation principle. Second are the tools used by donors to calculate appropriate allocations. These shed light on the relative importance of different factors, as proposed by donors themselves. However, the third literature discussed uses actual allocations to infer the relative importance of these factors. These revealed preferences inform discussions of the goals of aid. Fourth is the disparate descriptive literature that describes various aspects of how donors give aid. Appendix B includes a longer discussion of this literature, including the
ey try to capture.
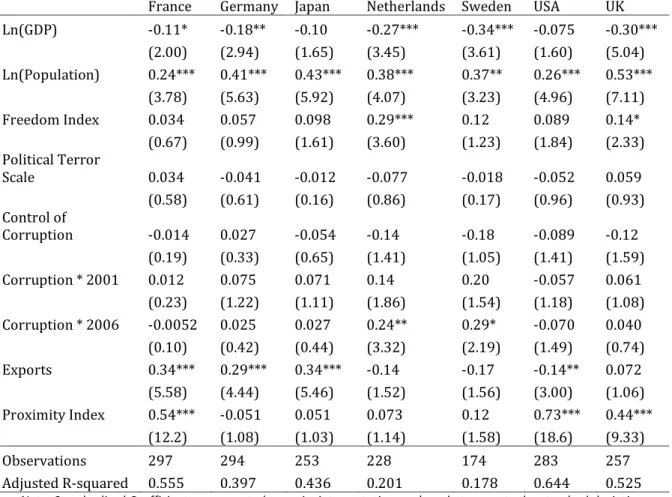
The fourth chapter is a contribution to the positive aid allocation literature. It examines aid allocation practice for seven donors over a 25 year period. The 4P specification is used, as the factors that influence donors are assigned amongst poverty, population, policy and proximity. The previous specification in general use was originally conceptualised as a dichotomy between recipient need and donor interest (the RN-DI model). The chapter differs by allowing donor interest to be replaced by a broader notion of proximity. This means that donors are not necessarily understood to be selfish for giving aid to countries that are geographically closer. Proximity is taken in a broad sense, meaning geographical, commercial, historical, cultural and linguistic proximity are all included. Population is by now a common augment to this specification, but policy has increasingly become important because of the Burnside and Dollar (1998, 2000) research.
The chapter makes a salient contribution to a specific debate within the literature regarding aid selectivity. A number of papers argue that policy has been an increasingly important factor in aid allocation (Berthélemy and Tichit, 2004; Dollar and Levin, 2006) whereas others report that aid selectivity has been low and static (Easterly, 2007; Hout, 2007a, b; Nunnenkamp and Thiele, 2006). The chapter contributes to the debate in a number of important ways. First, we estimate individually by donor, rather than pooling all donors. While pooling all donors may seem an appropriate action, it can lead to erroneous conclusions. For example, if all major donors are insensitive to policy, but numerous smaller donors have become marginally more policy sensitive in recent years, a pooled
(non-1 Introduction Paul Clist
14
weighted) regression could lead to a conclusion of increased policy selectivity. In this situation, it is not that aid has become more sensitive to policy, but rather that aid donors (in a non-weighted average) have become more sensitive to policy.
The fourth chapter finds little evidence that policy selectivity has been practised. While it is beyond the scope of this research to fully explain why this might be the case, the
“ D T “ D
by Buchanan (1977)
I “
(2000) used this moral hazard problem framework to examine the incentives a donor faces, especially in the context of conditionality. To summarise, the donor and recipient first agree a contract of reform and aid. In the second period the recipient then reneges on the promise, but the donor does not punish the recipient as it does not want to punish the poor within that country. It may be that in the long term punishing the recipient would be the most effective action, but donors are constrained by their current incentives. This inability to withhold aid (which I term Samaritan impulse) in the second period explains neatly why conditionality has failed to be used (Collier, 1997). However, there is no reason why moving
“ D
This, while not fully explored, hints at why the fourth chapter fails to find evidence for increased policy selectivity.
The fifth chapter “ D
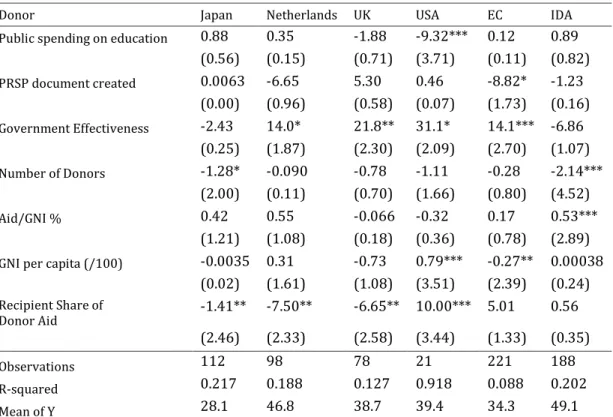
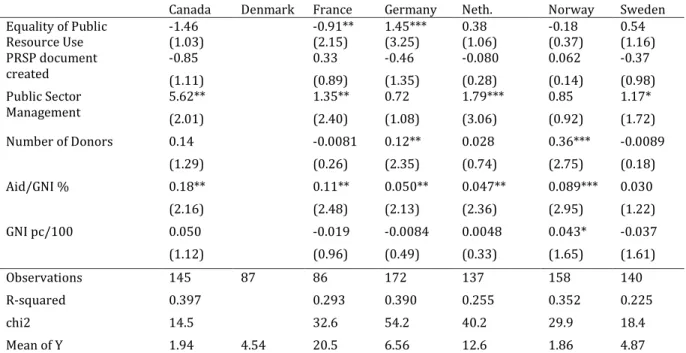
selectivity. While the Samaritan impulse deals with the inability to alter the amount of aid in response to different levels of governance, pragmatic selectivity introduces the composition of aid as a second policy lever. Through policy documents it is identified that while the volume of aid may be chosen to satisfy the Samaritan impulse, implicitly the type of aid is chosen so as to satisfy the desire for efficiency. The theoretical literature that deals with modality choice is reviewed, before an original but simple model is introduced. The empirical section tests both the extent (if any) of pragmatic selectivity, but also the factors that determine the composition of aid more generally. The results confirm that the relative efficiency of modalities is important, and also that this effect is larger than that of preference alignment.
15
2.
T
HE
T
AX
R
EVENUE
E
FFECTS
O
F
A
ID
G
RANTS
A
ND
L
OANS
In the conventional aid effectiveness literature, aid has been judged by its ability to increase growth rates in the recipient country. Those expecting a robust and unambiguously positive effect from aid have been disappointed (Roodman, 2007), which has led to more attention on aid itself. Specifically, it is now widely recognised that aid is not homogenous in goal:
(Clemens et al., 2004, p.1) At the heart of this shift is the acceptance that different types of aid do not just differ in aim but also in effect. It is then important what aid finances, implying a need to address fungibility, especially if from productive to non-productive spending, and broader fiscal effects. Consumption spending is thought to be an
have a positive impact on growth (Gomanee et al., 2005a). However, to the extent that consumption spending finances the provision of public goods, aid used in this way may contribute to increasing welfare, growth and reducing poverty (Gomanee et al., 2005b; Mosley et al., 2004). In short this is an issue of fungibility, as aid can be redirected from the proposed aim of increasing investment to either increasing consumption or substituting for tax revenue. In this case total revenue and expenditure increases by less than the aid hence the potential benefits from aid are not fully realised (McGillivray and Morrissey, 2001).
Thus donors wish to know what they are funding, be it tax cuts, consumption or investment. However, the link between domestic tax and foreign aid is not merely an issue of fungibility; the importance of the relationship between foreign aid and domestic revenue can also be approached from a political economy perspective. Bräutigam and Knack (2004) find that high aid receipts are associated with deteriorating governance. Moss et al. (2006) focus on a possible channel for this, arguing that if aid substitutes for tax revenue the citizen-government relationship can be undermined. Thus while the short-term concern for the donor may simply be whether they are funding investment or tax cuts, this aid-tax link has broader and longer-lasting implications.
Recently, an argument that the aid-tax revenue relationship is conditional upon the type of aid has surfaced. The idea is that if aid is given in loan form, it does not affect tax revenue collection. However if aid is given in the form of grants, there is an adverse effect upon tax
2- Aid and Tax Paul Clist
16
revenue collection which may in turn diminish any positive effect of aid. Existing evidence on this point is in two parts: cross-country and single-country. The cross-country evidence is based upon cross-country econometrics, where a tax revenue equation is augmented with the two aid variables. This evidence is, so far, supportive of the idea (Gupta et al., 2004; Odedokun, 2003). The single-country evidence however, does not support the conclusion that aid reduces tax effort (Morrissey et al., 2007; Osei et al., 2005). This paper contributes to this literature by adding to the cross-country evidence for the effect of aid on the tax/GDP ratio for a large set of developing countries over the period 1970-2005.
Section 2 reviews the debate regarding loans and grants. Section 3 outlines the current cross-country research and econometric methodology. Section 4 reports the results and further evidence. Section 5 discusses, and Section 6 concludes.
2.2
G
RANTS VERSUS
L
OANS
This chapter contributes to the wider debate regarding whether aid should be given in the
albeit on concessional terms). The most common argument, dating back to Schmidt (1964),
T
behaviour of the recipient governments because they have to be repaid, loans encourage better fiscal management and greater tax effort than grants while, additionally, the latter may substitute for (discourage) domestic revenue efforts (Gupta et al., 2004). In financial terms the difference relates to the degree of concessionality of the transfer relative to market terms for aid the important feature is that the grant element or concessionality is at least 25% although it tends to be far higher, especially for the poorest countries (Morrissey and White, 1996). Cordella and Ulku (2007) argue that higher concessionality is more likely to be growth promoting in poor countries with heavy debt obligations because it adds less to the debt burden and so does not increase the likelihood of default. If grants replace loans, debt burdens are reduced and the impact on growth is potentially positive. As grants are fully concessional they should be favoured for indebted poor countries.
The report of the International Financial Institution Advisory Commission (IFIAC, 2000) recommended that the World Bank should replace its loan programme, specifically IDA, with a grant programme aimed at poverty alleviation, and the United States administration supported this on the basis of three arguments (Sanford, 2002). First, increased grants would
17
not add to heavy debt burdens in poor countries. Second, loans are inappropriate for financing social sector programs, such as education, as the benefits are realised over a long time period and do not generate financial returns to service a loan (Salazar, 2002). Third, as grants do not burden recipients with the need for repayment they allow greater political
conditions (Sanford, 2002).1 There are dissenting voices. Some think that the move towards grants has already gone too far (Nunnenkamp et al., 2005). Britain was vocal in its opposition to the US IDA grants proposal (DFID, 2001), arguing that the current system made effective use of the limited resources available.
None of the arguments on financing, promoting conditionality or managing debt burdens are persuasive in choosing between concessional loans and grants. As aid loans are highly concessional, there is no strong argument against being fully concessional and providing grants. The choice may well come down to the one empirically testable proposition: the effect on tax revenue. If Gupta et al. (2004) are correct that loans encourage but grants discourage tax effort, then there is an argument against grants. If they are incorrect (and the case-study evidence is correct), the balance of arguments favours grants for the poorest countries. The paper addresses this directly.
2.3
M
ETHODOLOGY
To answer this question, we must engage with the literature on the determinants of tax revenue. Unfortunately, cross-country studies of the determinants of the tax/GDP ratio (Tanzi, 1992) rarely include aid among the explanatory variables. Teera and Hudson (2004) find the coefficient on aid to be insignificant in their estimates of tax performance in developing countries. Gupta et al. (2004) find that aid has a negative effect on tax effort, but that this varies depending on the type of aid: loans are positively correlated with tax revenue whereas grants are negatively correlated with tax revenue, and infer that grants induce lower tax effort. A core part of this chapter reinvestigates this relationship distinguishing between loans and grants, arguing that the effect of grants has become positive since the mid-1980s. This is the period since adjustment lending became the modus operandi of aid,
1
However, there is no reason a priori to imagine that grants would be a more efficient means for donors to influence policy in a recipient country. Loans may provide a better incentive for donors to monitor recipients. While grants can be used selectively
preferences or proved malleable in the past
(Lerrick and Meltzer, 2002, p.1) concessional loans can be deployed in the same way.
2- Aid and Tax Paul Clist
18
adding to the evidence that conditional lending tends to be associated with more positive effects of aid (see also Mosley et al., 2004).
To our knowledge, only two previous studies have specifically examined the effect of the composition of aid on tax revenue across countries. Gupta et al. (2004), with data from 107 low and middle-income countries pooled over the period 1970-2000, and Odedokun (2003), with data for 72 low-income countries pooled over the period 1970-99, use cross-country regression analysis to investigate the response of recipient government revenue effort to aid. Specifically, they test whether the tax/GDP ratio differs in response to aid grants and loans. Both find evidence to support the hypothesis that aid grants reduce recipient government tax effort (as represented by the tax/GDP ratio), and that concessional loans increase recipient tax effort. As they carry out a more sophisticated econometric analysis, Gupta et al. (2004) is the focus of our discussion and motivates our analysis.
The empirical approach of Gupta et al. (2004) follows Lotz and Morss (1967) to model the tax to GDP ratio as determined by variables chosen to proxy for the tax base structure of the economy. The approach is similar to the standard treatment in the literature on the determinants of the tax/GDP ratio (Tanzi, 1992; Teera and Hudson, 2004); additional explanatory variables are often included, although Gupta (2007)1 shows that few variables are robustly significant. Coefficients from a cross-country regression are interpreted as the
indicator of tax effort (Stotsky and WoldeMariam, 1997). Gupta et al. (2004) augment a
G
loans (L) as a percentage of GDP. Their baseline regression equation takes the form:
(1)
They control for four determinants of taxable capacity. Agricultural (Agr) and Industrial (Ind) value added as a percentage of GDP are included as the sector composition of value added is viewed as a key determinant of the tax base. A large agricultural sector reduces taxable capacity ( ) as agriculture is largely a subsistence activity in most low-income
1
The reader should note that Gupta et al. (2004) and Gupta (2007) are not only different papers, but are written by different authors.
19
countries, which is difficult to tax directly (Emran and Stiglitz, 2005). A large industrial sector is easier to monitor and tax ( ). Openness (Trade, the sum of exports and imports as a percentage of GDP), is included as trade taxes are relatively easy to collect ( ) and are a major share of tax revenue in low-income countries (Ghura, 1998; Greenaway and Milner, 1991). GDP per capita (Income) is included as a proxy for the level of economic development ( ), to capture increased tax buoyancy (the responsiveness of revenue to income growth) and collection efficiency. However, empirical evidence on the relationship between the tax/GDP ratio and per capita GDP, controlling for economic structure, is inconclusive (Tanzi, 1992). As the dependent variable is non-negative and skewed, the log transformation is used to provide a normal distribution. Nonlinearities in the relationship between aid and the tax ratio are allowed for by the inclusion of squared aid variables.
Gupta et al. (2004) estimate equation (1) using alternative techniques and specifications (including other explanatory variables), and the results are found to be quite robust. The coefficient on Agriculture is negative and significant while the coefficients on Industry and Trade are positive and significant. The coefficient on GDP per capita, however, is consistently negative and significant, contrary to expectations.1 The coefficient on Loans is positive and that on Grants is negative, including when lagged values are used, and both are almost
always signif T
an average of 4 per cent of GDP to 8 per cent of GDP could decrease revenues by just 0.4 GDP (Gupta et al., 2004, p.402). We make two changes to the specification, first by treating imports (M) and exports (X) separately as the revenue implications should differ (they are not taxed at the same rate and, in general, under trade reforms since the 1980s export taxes were largely eliminated before import taxes were reduced). Second, we allow for diminishing returns to the income variable by including its square. The resulting specification follows:
(2)
A concern with this specification is potential endogeneity. Endogeneity bias arises when an
1
Teera and Hudson (2004) also find the coefficient on per capita income to be negative (when significant), and interestingly also find a negative coefficient on the share of manufacturing for developing countries in their sample.
2- Aid and Tax Paul Clist
20
independent variable (aid in this case) is correlated with the error term, i.e. the variable is endogenous (or not orthogonal to the error term). Endogeneity refers to an inherent identification problem: either because there is a potential bi-directional contemporaneous relationship between the dependent variable and the independent variable of interest, and/or because an omitted third variable may co-determine both, the true effect of the independent variable on the dependent variable is not identified. To ensure identification one needs a predetermined variable, an instrument that is not correlated with the error term. In some cases, an appropriately lagged aid term may be predetermined and hence a valid instrument (correlated with the endogenous regressor but not with the error term); otherwise, one looks for other predetermined variables.
The instrumental variables (IV) approach is a standard method of dealing with endogeneity: one identifies a set of variables that are correlated with the dependent and specific independent variables but are not correlated with the error term. The IV approach is problematic, especially for the current context. Although the aid allocation literature has identified a number of potential instruments that are correlated with aid, these are likely to
GDP aid variables, i.e.
the effect of aid on tax/GDP across countries is not uniform. The aim is to estimate the average response; if the sample contains some countries where tax/GDP responds to aid and others where it does not, the IV method would estimate ( the former group of countries on the entire sample. Furthermore, IVs generally exhibit high standard errors and low significance, so when using fixed effects estimation there is too little variance to identify the coefficients (i.e. IV does not solve the identification problem). However, the fixed effects estimator is an appropriate method for (2) given that unobserved country-specific characteristics are likely to help explain cross-country differences in tax/GDP ratios.
Two further problems with the IV approach arise specifically for the specification in (2). First, there are two aid terms; while the same instrument set can be used for each, either loans or grants or both will not be well identified (the instrument set is likely to be weak). Second, the inclusion of quadratic aid terms implies that these must be instrumented (which imposes demands on the limited number of available instruments) or excluded. These concerns imply that the standard IV method is not appropriate. Nevertheless, we report IV results in the appendix (Table A 1): these results are quite similar to those reported below, and it
21
transpires that, using annual data, aid lagged twice is a statistically valid instrument (in addition to total global aid disbursed and a colony variable). The results support the use of lagged aid below; whilst aid may take a number of years to influence tax revenue, and thus lagged aid may be correlated with the error terms (and not a valid instrument), suitably lagged aid serves the purpose of an instrument and captures the dynamic effect of aid.
Specification (2) is quite parsimonious, and there may be a problem of omitted variables. Gupta (2007) examined some 20 potential determinants of tax/GDP (in a sample of up to 105 countries); few other than those included as controls in (2) were robustly significant. The two exceptions are debt share and the share of taxes from income, profits and capital gains, both of which were mostly (but not always) significant. The former is likely to be endogenous; ceteris paribus, countries with high debt are likely to have higher taxes while countries with a tax shortfall are likely to increase debt. Data on the latter are not available for most of our sample. The analysis of Gupta (2007) suggests that (2) includes the variables commonly found to be significant (and unobserved country-specific variables are allowed for in the estimation).
2.4
R
ESULTS
We here estimate (2) for a larger sample of countries over a longer time period (details on the data sources and definitions are provided in Appendix A). Although the extended dataset covers 107 countries over the period 1970-2005, there are many missing observations so the number of countries used in each regression is smaller (a maximum of 82). Table 2.1 reports the results of estimating (2) using fixed (FE) effects estimators for the full sample; the first set of results include current aid, the second set lagged aid (as a control for potential endogeneity). The FE estimator has the advantage of allowing for unobserved country specific characteristics that do not change over time. If the unobserved effects are correlated with the other explanatory variables, failing to take them into account will bias the results.1
The results in Table 2.1 are very similar to Gupta et al. (2004); all coefficients have the same sign and are of similar magnitude and significance. Including additional years in the sample
1
It may be the case that any unobserved effects are uncorrelated with all explanatory variables in any time period, in which case random effects (RE) will produce more efficient estimators. If there is a correlation, the RE estimators will be inconsistent. It transpires that FE is preferred for our estimation, although RE provides very similar results and are provided in Appendix A, Table A 2.
2- Aid and Tax Paul Clist
22
(for the same countries) does not alter the results. The distinction between imports and exports appears to be vindicated as the coefficients are significant but with opposite signs, and even to off-set one another (although in the sample the value of Imports tends to be greater than Exports).1 It is not evident why the coefficient on exports should be negative (we consider reasons later after seeing if the results persist under alternative estimates). The coefficient on Agriculture is negative and significant while the coefficient on Industry is positive and significant. For the aid variables, Loans are positively related, and Grants
negatively related to the tax to GDP ratio and both are significant. The coefficient on Income
is significant but negative; although this is not what is expected it is a common finding in the literature. However, when we augment (2) to include income-squared, the coefficient on income becomes insignificant whereas that on income-squared is negative and significant (other variables are qualitatively unaffected). This suggests a non-linear relationship
GDP ceteris paribus.
To control for the possibility of endogeneity bias, that donors give more aid in the form of grants to fiscally constrained countries (or that an unobserved variable influences both aid composition and tax effort), we use aid variables lagged one year, on the assumption that the current tax/GDP ratio will not influence the magnitude or composition of previous year aid flows (as noted above, this assumption may not hold, but the use of lagged aid may still be appropriate). The results using lagged aid variables are given in the final two columns of Table 2.1.
1
This shows that the two should not be combined. Gupta et al. (2004) most probably found a positive significant effect because imports are higher in the sample.
23
Table 2.1 Determinants of Tax/GDP Ratios (FE), 1970-2005 Variable Current Aid Lagged Aid
Loans 1.25*** 1.31*** 0.69** 0.82** (3.57) (3.88) (1.99) (2.44) Loans 2 -0.0028* -0.0028* -0.0012 -0.0016 (1.78) (1.84) (0.59) (0.81) Grants -1.18*** -1.00*** -0.76*** -0.62*** (5.42) (4.73) (3.48) (2.92) Grants2 0.00033 0.00029 -0.000014 -0.000075 (1.49) (1.35) (0.05) (0.29) Agriculture -1.16*** -0.86*** -1.17*** -0.85*** (8.59) (6.37) (8.54) (6.26) Industry 0.51*** 0.78*** 0.55*** 0.85*** (3.48) (5.38) (3.73) (5.79) GDP -0.0054*** 0.0008 -0.005*** 0.0014 (8.82) (0.92) (8.46) (1.51) GDP2 -0.0000004*** -0.0000004*** (9.45) (10.04) Imports 0.55*** 0.49*** 0.50*** 0.44*** (6.10) (5.67) (5.59) (5.11) Exports -0.51*** -0.54*** -0.45*** -0.48*** (5.17) (5.55) (4.52) (5.00) N 1554 1554 1558 1558 Countries 82 82 81 81 F-Stat 30.4 37.9 28.0 37.0 Overall R2 0.34 0.40 0.33 0.38
Notes: The dependent variable is the log of the Tax/GDP ratio multiplied by 100 to assist interpretation. All independent variables are measured as a percentage of GDP, except GDP (per capita). Numbers in parentheses are t-statistics; ***, ** and * indicate significance at 1%, 5% and 10% levels respectively. N is the total number of observations and the number of Countries is also reported. Fixed Effects are shown; results using Random Effects are similar and can be found in the appendix, Table A 2.
As the data cover a 35 year period, the next step of the research is to ascertain whether there have been any changes over the period. There is no reason a priori why we would expect a consistent relationship over a 35 year period, especially when there have been large changes to both tax and aid. Specifically, aid volumes have grown substantially since 1970, and there has been a general transition from trade-based to income-based taxes (e.g. Attila et al., 2009). Table 2.2 reports the results of estimating (2) for the twenty-year period 1970-1990, and Table 2.3 does the same but for the period 1985-2005. While many variables have similar relationships, the difference is clear for the aid variables, as well as exports and
2- Aid and Tax Paul Clist
24
agriculture. The change from significant negative coefficients to significant positive coefficients for grants suggests that the relationship with revenue may have changed dramatically within the period 1970-2005. We now investigate this possibility more thoroughly.
Table 2.2 Determinants of Tax/GDP Ratios (FE), 1970-1990 Variable Current Aid Lagged Aid
Loans 0.23 0.63 -1.48*** -1.16** (0.39) (1.10) (2.73) (2.23) Loans 2 0.051*** 0.040*** 0.12*** 0.11*** (3.19) (2.59) (5.90) (5.79) Grants -1.99*** -1.66*** -1.28*** -0.98*** (6.33) (5.46) (4.06) (3.24) Grants2 0.0035 0.0028 -0.00055 -0.0020 (1.52) (1.29) (0.17) (0.64) Agriculture -1.15*** -0.57*** -1.10*** -0.51** (5.56) (2.71) (5.34) (2.48) Industry 0.54** 0.90*** 0.72*** 1.07*** (2.27) (3.90) (3.09) (4.74) GDP -0.0078*** 0.0033** -0.0074*** 0.0041*** (8.26) (2.12) (7.81) (2.70) GDP2 -0.0000004*** -0.0000004*** (8.82) (9.35) Imports 0.40*** 0.48*** 0.38*** 0.46*** (3.51) (4.35) (3.46) (4.33) Exports -0.20 -0.20 -0.15 -0.16 (1.30) (1.34) (1.01) (1.09) N 981 981 977 977 Countries 75 75 73 73 F-Stat 22.3 29.6 23.5 32.0 Overall R2 0.39 0.44 0.36 0.38 Notes: As for Table 2.1.
25
Table 2.3 Determinants of Tax/GDP Ratios (FE), 1985-2005 Variable Current Aid Lagged Aid
Loans 1.93*** 1.92*** 1.69*** 1.70*** (5.05) (5.06) (3.90) (3.95) Loans 2 -0.0044*** -0.0042*** -0.0031 -0.0031 (2.86) (2.71) (1.40) (1.42) Grants 0.22 0.30 0.80*** 0.88*** (0.77) (1.08) (2.80) (3.08) Grants2 0.00042** 0.00038* 0.00013 0.0001 (2.02) (1.83) (0.52) (0.40) Agriculture -0.41* -0.24 -0.35 -0.19 (1.79) (1.03) (1.52) (0.83) Industry 0.54*** 0.62*** 0.59*** 0.70*** (2.85) (3.27) (3.17) (3.69) GDP -0.0022** 0.0041* -0.0019** 0.0037** (2.42) (1.92) (2.11) (2.02) GDP2 -0.0000006*** -0.0000005*** (3.24) (3.46) Imports 0.53*** 0.51*** 0.46*** 0.42*** (4.20) (4.01) (3.72) (3.38) Exports -0.66*** -0.65*** -0.57*** -0.56*** (5.35) (5.28) (4.60) (4.54) N 885 885 898 898 Countries 77 77 78 78 F-Stat 10.2 10.3 11.0 11.2 Overall R2 0.0063 0.042 0.0027 0.034 Notes: As for Table 2.1.
One possibility is that this apparent relationship change is the product of a more general time effect. To investigate this, we performed three tests (results found in Appendix A, Table A 3). First, we estimated the entire sample with the same specification including annual time dummies for each year; this provided no evidence of a general time effect. Second, we instead included a time trend variable, which was insignificant. Third, we included a 1985-2005 (intercept) dummy, but it was insignificant. In each of the tests the other coefficient estimates were largely unchanged. There is no evidence that the apparent shift in relationship between grants and tax revenue is simply a general time effect.
The next robustness check was to construct a panel of sub-period averages (eight four-year periods, to have balanced panels we start in 1974 and go through to 2005) and estimate (2) using this panel. Such sub-period averages offer certain advantages, notably by smoothing
2- Aid and Tax Paul Clist
26
out year-on-year variations in the data, especially for the aid variables that are quite volatile (Bulír and Hamann, 2008). Period averages also capture something of the dynamic relationship between aid inflows and the tax ratio (it is now previous period rather than previous year aid that can impact on tax effort) and reduces possible autocorrelation. The results in Table 2.3 provide further evidence that grants have not had a negative impact on tax revenues, except in the earliest periods. We report only fixed effects, as the (admittedly weak) Hausman test constantly indicates that it is preferred (as previously, RE results are similar). The validity of FE depends on whether differences in tax rates between countries can be explained by the controls and unobserved country-specific factors. The unexplained (log) difference between countries should not vary too much over time; otherwise using fixed effects is problematic. This seems a reasonable assumption, given the persistent regional heterogeneity in tax rates across the world. On the other hand, the use of sub-period averages is likely to decrease the significance of variables as it reduces the number of observations. This may be why the coefficient on Industry is insignificant in Table 2.3. All other variables have the expected sign and are mostly significant. Grants are insignificant and while negative in the whole sample, are positive in the last twenty four years (6 time periods). This supports the earlier suggestion that grants effect on tax revenue has changed.
27
Table 2.4 Determinants of Tax/GDP Ratios, Period-Averaged Panel (FE)
Variable 1974-2005 1982-2005
Current Aid Lagged Aid Current Aid Lagged Aid
Loans 1.16 1.27 1.99** 2.18*** (1.56) (1.62) (2.51) (2.67) Grants -0.79** -0.60 0.79* 0.68 (1.97) (1.42) (1.71) (1.47) Agriculture -0.83*** -0.84*** -0.64** -0.59** (3.35) (3.32) (2.13) (1.99) Industry 0.52* 0.45 0.34 0.31 (1.86) (1.54) (1.14) (1.01) GDP 0.0038** 0.0034* 0.00089 0.00064 (2.26) (1.92) (0.43) (0.31) GDP2 -0.0000006*** -0.0000005*** -0.0000003** -0.00000021* (6.36) (5.88) (2.05) (1.79) Imports 0.42** 0.39** 0.18 0.19 (2.29) (2.11) (0.90) (0.98) Exports -0.56*** -0.50** -0.29 -0.30 (2.81) (2.46) (1.42) (1.44) N 493 488 373 372 Countries 95 95 92 92 F-Stat 12.5 11.6 4.26 4.36 Overall R2 0.43 0.43 0.11 0.094
Notes: As for Table 2.1; panel comprises averaged data for eight four-year periods. Aid squared terms have been omitted (if included they are all insignificant). Lagged Aid here refers to the period before, i.e. the four year period preceding the current four year period.
T
ESTING FOR THEB
REAKBy augmenting the standard regression with composite terms for the standard variables
W of
the composite variable. A constant effect of a variable over time would result in the new composite variable possessing a coefficient of zero. If this coefficient is not equal to zero, there is evidence that a change in the relationship occurred. It is only when the Wald statistic is calculated on the composite variable that we have a true test of whether the break is statistically significant. The results are shown in Table 2.5.
2- Aid and Tax Paul Clist
28
Table 2.5 Testing for Breaks in 1984
Coefficient Variable Composite Variable Loans (L) 0.035 (0.05) 1.23* (1.45) L2 0.158* (1.71) -0.16** (-1.74) Grants (G) -1.521*** (-3.9) 0.99*** (2.26) G2 0.035* (1.84) -0.035** (-1.83) Agriculture -1.00*** (-7.13) -0.094 (-1.11) Industry 1.085*** (7.04) -0.30*** (-3.3) Income -0.001*** (-13.87) 0.008*** (11.37) Imports 0.41*** (4.18) 0.023 (0.24) Exports -0.326*** (-2.79) -0.16 (-1.49) Obs (N) 1554 F-Stat 25.24 Overall R2 0.37
Notes: As for Table 2.1. Selected Wald statistics are as follows: All Variables 17.09***, Grants 5.12***, G2 5.12***, L and L2 1.61, Industry 10.86***, Income 129.3*** and All Others 1.49.The Wald statistic is a test of added explanatory power with a chi squared distribution. It can be defined as
with the subscripts 1 and 2 denoting the set of variables. ***, ** and * denote significance at the 10%, 5% and 1% level respectively.
There is clear evidence for a break after 1984 for some relationships between dependent and independent variables. Specifically, the relationships of tax/GDP with grants, industry and per capita income change: grants become less negative (remember, in 1985-2005 a variable is subjected to both coefficients), the diminishing/increasing returns disappear, industry becomes less positive and income per capita becomes positive. All other effects are insignificant. Very similar results are found if other years around 1984 are chosen. Two of these results appear particularly relevant: since the mid-80s the coefficient on GDP per capita has been positive (suggesting that tax collection efficiency increases with income)
29
whereas grants have had less or no adverse effect on tax revenue (the results here do not show a positive effect of grants).
M
EDIUMT
ERMA
IDE
FFECTSAid is given to countries specifically because they have a deficiency in some sense (income, welfare). If this contemporaneous negative correlation (in this case, with tax revenue) is not controlled for, the coefficient on aid will be downwardly biased. Lagging aid by one period is unlikely to solve this fully, given the persistence in aid levels and the likelihood that tax/GDP changes very slowly. This is more problematic for grants than loans: current and lagged grants have a correlation of some 90% (for loans it is 72%). Only when the contemporary effect is controlled for will the medium-term effect become apparent.
To try and isolate the medium term effect we augment the standard regression with a -10 years previously. We can test if serial correlation is a problem, given the relatively high correlation of grants over time, following the method of Wooldridge (Drukker, 2003a; Wooldridge, 2002, pp. 274-276). In the presence of serial correlation, estimating using differenced data is recommended although it tends to have low explanatory power, as country specific effects are deleted and the cross-country variation of tax revenue in differenced form is small. This means high standard errors are to be expected, and much of the nuance of panel data is lost.
Table 2.6 presents results using fixed effects estimation and differenced data. The Wooldridge statistic repeatedly shows that there is serial correlation, so the differenced results are also reported, both for the whole sample and 1985-2005. The Wooldridge statistic is essentially a test of whether the time varying error term conforms to the properties one would expect if the data were not serially correlated. The results show the expected pattern for coefficients on imports, exports, industry and agriculture. Loans are
and longer term. The longer term effect is both larger and more significant. Contemporaneous grants are negative but insignificant, but over the medium term grants found to be positive and significant. The Wooldridge test statistic shows (highly significantly) that there is a problem of serial correlation, which implies the differenced equation is needed. Of those results, by far the most significant determinant is per capita income, with a negative sign. This contradicts theoretical assumptions that tax revenue (collection
2- Aid and Tax Paul Clist
30
efficiency) increases as income rises, through both demand for government services and the ability of citizens to pay more tax. Most of the other variables are not significant. Industry is an exception, but only when the whole period is used.
Table 2.6 Medium and Short Term Estimates
1985-2005 FE 1970-2005 Differenced 1985-2005 Differenced C on tem p or a n eo u s Loans 1.89*** (5.02) 1.21*** (3.44) 1.84*** (4.85) Loans2 -0.004*** (2.87) -0.003 (1.61) -0.004** (2.42) Grants -0.03 (0.11) -1.10*** (4.91) 0.05 (0.17) Grants2 0.0003 (1.42) 0.0003 (1.14) 0.0003 (1.5) H is to ric a l Loans 5.18*** (4.25) 0.35 (0.83) 1.84*** (3.61) Loans2 -0.24*** (3.44) Grants 2.15*** (3.08) -0.12 (0.45) 0.48 (1.52) Grants2 -0.07*** (3.08) C on tem p or a n eo u s Agriculture -0.19 (0.82) -1.06*** (7.8) -0.31 (1.36) Industry 0.59*** (3.14) 0.66*** (4.41) 0.69*** (3.66) GDP -0.0007 (0.79) -0.44*** (6.55) -0.15 (1.64) Imports 0.43*** (3.38) 0.49*** (5.38) 0.43*** (3.30) Exports -0.54*** (4.33) -0.49*** (4.92) -0.56*** (4.46) Wooldridge test 16.62 N 873 1468 873 F-stat 93 97.13 92.36 Overall R2 0.16 0.85 0.90
Notes: As for Table 2.1 T W essentially a Wald test of whether is equal to -0.5 in the regression . The null hypothesis is then that there is no first order autocorrelation. The critical value for the 1% significance is 7.01. Historical here is an
I
been omitted: they were insignificant and added no explanatory power (a joint test of their significance gave a chi-squared [2] statistic of 0.1).
The other significant factors are grants and loans, over the medium term. When lagged terms are used with FE for the full sample (the second column), coefficients on loans and grants are positive and significant, suggesting that aid does help countries to increase their tax revenue. It may be that the aid is associated with conditions including measures to
31
increase tax revenue, which could be interpreted as a positive impact of conditionality. The coefficient on loans is quite robust in sign and significance across specifications, but that on grants is not (and is insignificant in most differenced specifications, as these have high standard errors). In general the differenced results are weak, at least for the aid variables. However, the medium-run estimates suggest that aid is positively associated with tax revenue, whether loans or grants.
D
IFFERENCES INC
OUNTRYG
ROUPSA final possibility tested is that the relationship may be different comparing low and middle income countries; Teera and Hudson (2004, p.796) report that low-income countries have a significantly lower tax/GDP ratio and tax effort score than middle income countries, although there are few significant differences between the coefficient estimates for different groups of countries. To examine if there are differences between countries according to their income level we split the sample in low-income (GDP per capita of no more than $450 in 1970) and middle-income countries. The results are reported in Table 2.7.
2- Aid and Tax Paul Clist
32
Table 2.7 Splitting the Sample by Income Level, Lagged Aid (FE)
Variable Middle Income Low Income
1970-2005 1985-2005 1970-2005 1985-2005 Loans 0.31 (0.76) -0.25 (0.49) -0.15 (0.21) 2.69*** (3.05) Loans2 -0.0004 (0.17) 0.002 (0.74) 0.007 (0.86) 0.005 (0.58) Grants -0.95*** (3.45) 1.82*** (4.40) -0.74* (1.83) -0.07 (0.11) Grants2 -0.0004 (1.16) -0.001*** (3.92) 0.0005 (0.61) 0.001 (1.40) Agriculture -1.91*** (10.79) -1.40*** (4.74) -0.44* (1.78) 0.92** (2.02) Industry 0.11 (0.62) 0.07 (0.34) 1.08*** (3.15) 0.54 (1.14) GDP -0.63*** (10.12) -0.23** (2.54) 0.08 (0.07) 0.71 (0.42) Imports 0.34*** (3.32) 0.52*** (3.45) 0. 78*** (4.24) 0.60* (1.75) Exports -0.34*** (3.08) -0.77*** (5.21) -0.51* (1.72) 0.18 (0.46) N 1171 659 387 178 Countries 71 67 22 20 F-Stat 25.81 8.86 10.23 6.20 Overall R2 0.27 0.03 0.33 0.01
Notes: As for Table 2.1.
There do appear to be differences in coefficient estimates for different income sub-groups, especially for the later (1985-2005) period. However, we should acknowledge that the low-income sample is quite small and the model does not have much explanatory power for the later period (for this reason, we did not follow the more detailed analysis of income sub-samples). The difference for the aid variables is pronounced: loans are insignificant but grants are significant (negative over the whole period but positive in the later period) for middle-income countries; in contrast, grants are negative (weakly significant) over the whole period but insignificant for 1985-2005 while loans are significant (and positive) only in the
33
later period for low-income countries. The positive effect of grants in the later period seems to be due to middle-income countries whereas the positive impact of loans appears to be due to low-income countries (but note that the coefficient on grants is insignificant).
The negative coefficient on income seems to be due to middle-income countries as the coefficient is insignificant for low-income countries, although clearly there is not much variation from which to identify any effect. For middle-income countries the share of agriculture is consistently negative whereas industry is insignificant; for low-income countries, the signs are as expected over the whole period, but for 1985-2005 agriculture is positive, suggesting improved ability to tax the sector, and industry insignificant.
2.5
D
ISCUSSION
The poorest countries tend to receive more aid, the aid they receive is more likely to be in the form of grants, and they also tend to have lower tax/GDP ratios. Indeed, it is the poorest countries that face the greatest difficulty in increasing tax revenue (Keen and Simone, 2004; Teera and Hudson, 2004). If, on average over time, donors give more aid in the form of grants to recipients with relatively lower tax ratios (because this is correlated with aid
the tax ratio. This is what we tend to observe. To the extent that tax ratios change slowly over time relative to aid, this negative relationship would also be observed using aid lagged one year (i.e. a one year lag may not adequately account for endogeneity). However, if the composition of aid has a systematic causal (or behavioural) impact on the tax ratio, period lagged aid variables should have a significant effect on the tax ratio. This does appear to be the case, i.e. there is evidence that over the medium term or since the mid-80s, grants and loans both appear to encourage tax effort (the results differ for income groups).
The tax revenue equation (excluding aid variables) is a revenue performance equation and is essentially a contemporaneous relationship: current tax/GDP ratios are explained by current values of the economic structure (tax base) variables. The annual panels are appropriate to estimate this; as it is estimated across countries over time, it captures the relationship that holds on average. The results for the structural variables are mostly consistent in alternative specifications. Countries with a relatively large agricultural sector tend to have lower tax revenue (as that sector relatively low and difficult to tax). Countries with relatively large manufacturing sectors have higher tax revenue, because this may proxy for