PURDUE UNIVERSITY GRADUATE SCHOOL Thesis/Dissertation Acceptance
This is to certify that the thesis/dissertation prepared By
Entitled
For the degree of
Is approved by the final examining committee:
To the best of my knowledge and as understood by the student in the Thesis/Dissertation Agreement, Publication Delay, and Certification Disclaimer (Graduate School Form 32), this thesis/dissertation adheres to the provisions of Purdue University’s “Policy of Integrity in Research” and the use of copyright material.
Approved by Major Professor(s):
Approved by:
Head of the Departmental Graduate Program Date
JOAN GOMES
IMPLEMENTATION OF I-VECTOR ALGORITHM IN SPEECH EMOTION RECOGNITION BY USING TWO DIFFERENT CLASSIFIERS: GAUSSIAN MIXTURE MODEL AND SUPPORT VECTOR MACHINE
Master of Science in Electrical and Computer Engineering
MOHAMED EL-SHARKAWY Chair BRIAN KING PAUL SALAMA MOHAMED EL-SHARKAWY BRIAN KING 4/14/2016
A Thesis
Submitted to the Faculty of
Purdue University by
Joan Gomes
In Partial Fulfillment of the Requirements for the Degree
of
Master of Science in Electrical and Computer Engineering
May 2016 Purdue University Indianapolis, Indiana
Dedicated to
My Husband, My Parents and
ACKNOWLEDGMENTS
I would like to express my heartiest gratitude to my honorable thesis supervisor Prof. Mohamed El-Sharkawy, Department of Electrical and Computer Engineering (ECE), Indiana University-Purdue University Indianapolis (IUPUI), for giving me the opportunity to research under his supervision in the topic of Implementation of i-vector Algorithm in Speech Emotion Recognition by using two different classifiers: Gaussian Mixture Model and Support Vector Machine. He has constantly inspired me toward innovation and guided me with thoughtful advice. It was his enduring support and encouragement that has made this work possible. Through his supervision, I have learnt a lot.
I would like to thank my honorable Head of the Department Prof. Brian King for his intellectual support throughout the course of my studies. I am grateful to Prof. Paul Salama for serving on my dissertation committee. I also express my gratitude to other faculty members of the department. The copious help received from the technical staff of the department for the excellent laboratory support is also acknowledged.
Finally, I am indebted to all whosoever have contributed to provide help to carry out this research work and also to my friends and families for their love and encour-agement.
TABLE OF CONTENTS
Page
LIST OF TABLES . . . vi
LIST OF FIGURES . . . vii
ABSTRACT . . . viii
PUBLICATIONS . . . ix
1 INTRODUCTION . . . 1
2 DIGITAL SIGNAL PROCESSING . . . 2
2.1 What is Digital Signal Processing (DSP) . . . 2
2.2 DSP Applications . . . 3
3 SPEECH SIGNAL PROCESSING. . . 4
3.1 What is Speech Signal Processing . . . 4
3.2 Disciplines Related to Speech Signal Processing . . . 4
3.3 Historically Significant Developments in Speech Signal Processing . 5 3.3.1 Infrastructure . . . 5
3.3.2 Representation of Knowledge . . . 6
3.3.3 Models and Algorithms . . . 6
3.3.4 Searching Technique . . . 6
3.3.5 Metadata . . . 7
3.4 Purpose of Speech Signal Processing . . . 7
3.5 Speech Signal Processing Applications . . . 7
3.5.1 Speech Coding . . . 7
3.5.2 Speech Synthesis . . . 7
3.5.3 Speech Recognition and Understanding . . . 8
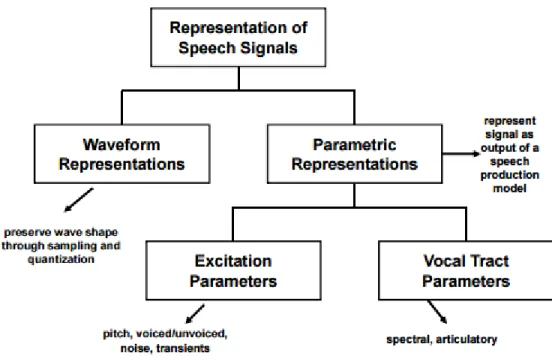
3.6 Hierarchy of Speech Signal Processing. . . 9
4.3 Classification of Emotion . . . 10
4.4 Purpose of Emotion. . . 12
5 EMOTION RECOGNITION FROM SPEECH . . . 14
5.1 Speech Emotion Recognition Process . . . 14
5.1.1 Speech Signal Database . . . 14
5.1.2 Feature Extraction . . . 14
5.1.3 Identifying Emotion (Training, Testing & Classifying) . . . . 15
5.2 Previous Studies in Speech Emotion Recognition. . . 16
6 THEORETICAL CONCEPTS . . . 17
6.1 Gaussian Mixture Model (GMM) . . . 17
6.2 Universal Background Model (UBM) . . . 18
6.3 Maximum A Posteriori (MAP) Parameter Estimation . . . 19
6.4 Support Vector Machine (SVM) . . . 21
6.5 i-vector Algorithm . . . 23
7 EXPERIMENT . . . 25
7.1 Speech Database Selection . . . 25
7.2 Feature Extraction . . . 25
7.2.1 Formant Frequency . . . 26
7.2.2 Mel-Frequency Cepstral Coefficients (MFCC) . . . 29
7.3 GMM UBM Calculation and i-vector Extraction . . . 31
7.4 SVM Classification and i-vector Extraction . . . 32
8 RESULTS . . . 35
9 FUTURE SCOPE. . . 39
10 CONCLUSION . . . 40
LIST OF TABLES
Table Page
5.1 Types of Features Representing Speech . . . 15
7.1 List of Extracted Features . . . 26
8.1 Identification Rate of Emotions . . . 36
LIST OF FIGURES
Figure Page
3.1 Hierarchy of Speech Signal Processing . . . 9
4.1 Examples of Basic Emotions . . . 11
6.1 MAP Adaptation Step 1 . . . 20
6.2 MAP Adaptation Step 2 . . . 21
6.3 SVM Structure . . . 22
6.4 i-vector Algorithm Model . . . 24
7.1 Formant Frequency Calculation . . . 27
7.2 Graphical Representation of Formant Frequencies for Angry Emotion . 27 7.3 Formant Frequency Calculation of Speech Signal for Angry Emotional Speech . . . 29
7.4 Process of Calculating MFCC . . . 30
7.5 Matlab Command Window Snapshot for Neutral Emotion . . . 31
7.6 Classification of Emotion Groups . . . 32
7.7 System Diagram . . . 33
7.8 Classification of Emotion Groups . . . 34
8.1 Neutral Speech Recognition Procedure . . . 35
ABSTRACT
Gomes, Joan. M.S.E.C.E., Purdue University, May 2016. Implementation of I-vector Algorithm in Speech Emotion Recognition by Using Two Different Classifiers: Gaus-sian Mixture Model and Support Vector Machine. Major Professor: Mohamed El-Sharkawy.
Emotions is essential for our existence as it exerts great influence on the mental health of people. Speech is the most powerful mode to communicate. It controls our intentions and emotions. Over the past years many researchers worked hard to recognize emotion from speech samples. Many systems have been proposed to make the Speech Emotion Recognition (SER) process more correct and accurate.
This thesis research discusses the design of speech emotion recognition system implementing a comparatively new method, i-vector model. i-vector model has found much success in the areas of speaker identification, speech recognition and language identification. But it has not been much explored in recognition of emotion. In this research i-vector model was implemented in processing extracted features for speech representation. Two different classification schemes were designed using two different classifiers - Gaussian Mixture Model (GMM) and Support Vector Machine (SVM) along with i-vector algorithm.
Performance of these two systems were evaluated using the same emotional speech database to identify four emotional speech signal. Angry, Happy, Sad and Neutral. Results were analyzed and more than 75% of accuracy was obtained by both systems which proved that our proposed i-vector algorithm can identify speech emotions with less error and more accuracy.
1. INTRODUCTION
Emotions plays a very strong influence on human action and behavior. In psychology, emotion is often defined as a complex state of feeling that results in physical and psychological changes that influence thought and behavior. Speech emotion analysis means applying various methods to analyze vocal behavior to predict the state of the speaker (e.g. emotions, moods, and stress). The basic concept is that a set of objectively measurable voice parameters gets altered depending on different emotional states during speaking. These voice parameters thus reflects the effective state a person is currently experiencing.
With the developments of science, both psychologists and artificial intelligence specialists have started to spend their time in speech emotion analysis. Therefore a good number of research works have been done on emotion in the field of psychology and physiology. Anger, fear, disgust, sadness, surprise, happiness - were six basic types of emotions. Amusement, contempt, contentment, embarrassment, excitement, guilt, pride in achievement, relief, satisfaction, sensory pleasure, shame these emo-tions were included later.
Speech Emotion Recognition (SER) is not much old field but it quickly grew be-cause it has so many applications in different areas of modern life. Therefore SER has already marked it’s space in the diverse area of digital signal processing. Analysis of emotion in speech can be applied in developing communication mechanisms for vocally-impaired persons or for children suffering from autism. Its significant appli-cation is smart human-machine interaction. Other appliappli-cations of Speech Emotion Recognition (SER) include robotics, psychiatric diagnosis, health care, lie detection, intelligent toys, learning environment, children education, educational software, dia-log systems, call centers, security fields, and entertainment.
2. DIGITAL SIGNAL PROCESSING
Signal processing means the analysis, modification and alteration of signals. Signals can be analog or digital. Analog signal varies continuously in time depending on the information, where as digital signal varies according to a series of discrete values based on the information. For analog signals, signal processing includes two important sectors: firstly, amplification and filtering of audio signals for audio equipment and secondly, the modulation and demodulation of signals for telecommunications. For digital signals, signal processing includes the compression, error detection and error correction of digitally sampled signals.
2.1 What is Digital Signal Processing (DSP)
Digital signal processing (DSP) is the analysis and research of signals usually in order to generate or compress and then measuring or filtering continuous analog signals. Digital signal is the representation of signals in discrete time, frequency, or some other discrete domain. Signals are represented as a sequence of numbers or symbols and then digital processing is done on them. DSP applications include wide range of areas.
• Audio and speech signal processing.
• Sonar and radar signal processing.
• Sensor array processing.
• Spectral estimation.
• Statistical signal processing.
• Signal processing for communications.
• Signal processing for control of systems.
• Bio medical signal processing.
• Seismic data processing.
Previously DSP algorithms used to be applied using standard computers, but now researchers used specialized processors called digital signal processors. Digital signal processors are on purpose-built hardware for DSP applications.
2.2 DSP Applications
The main applications of DSP includes the following: audio signal processing, digi-tal image processing, audio and video compression, speech processing and recognition, digital communications, radar and sonar, seismology and biomedicine, financial signal processing. Specific examples are weather forecasting, economic forecasting, speech signal processing in smart phones, room correction of sound, sound reinforcement applications, seismic data processing, medical imaging such as MRI scans, analysis and control of industrial processes, MP3 compression, computer graphics, image edit-ing and manipulation, loudspeaker crossovers and equalization, and audio effects for amplifiers.
3. SPEECH SIGNAL PROCESSING
3.1 What is Speech Signal ProcessingSpeech signal processing covers a wide range of algorithms drawn from diversified disciplines. But all these areas is focus on to different methods and systems. The most common aspect of all speech signal processing systems is the signal processing front end. Signal processing front end involves the process of converting the speech waveform into parametric representation which later is used for further analysis and processing. Audio processing is mainly involved in representing sound to human ears. It covers many diverse fields. Three areas are prominent: (1) Music reproduction, such as in audio compact discs, MP3 (2) Telecommunications or telephone networks, and (3) Synthetic speech human voice generated and recognized by computers. Digital Signal Processing (DSP) has brought tremendous changes in all these areas of audio processing.
3.2 Disciplines Related to Speech Signal Processing
A. Signal Processing - involves extracting data from speech in processed and effi-cient manner.
B. Physics - involves developing the relationship between speech signal and physi-ological mechanism.
C. Pattern Recognition - involves using set of algorithms to create and match pattern according to the degree of likeliness.
D. Computer Science - involves making new algorithms for implementing in the methods of speech recognition system.
E. Linguistics - involves finding the relation between sounds, words, the meaning of those words and the overall meaning of sentences in a language.
3.3 Historically Significant Developments in Speech Signal Processing
Over the past 35 years the technology of Speech Signal Processing observed tremendous development. During this period over this past century it has been wit-nessed that how from its very beginning Speech Signal Processing reached to its age so quickly. Infrastructure, Representation of Knowledge, Models and Algorithms, Searching Technique and Metadata are presented below:
3.3.1 Infrastructure
Moore’s Law states that if one doubles the amount of computation for a given cost in every 2 or 2.5 years along decreasing cost of memory, has been pivotal in enabling the thinking of researchers to deal with very complicated systems in very less time. It has allowed researchers to make significant progress and improvement over the past 30 years. Over the years, these database have been developed, improved, and shared to the researchers all over the world by the National Institute of Science and Technology (NIST), the Linguistic Data Consortium (LDC). The type of the speech samples has changed from limited, constrained speech materials to huge bunch of more realistic and spontaneous speech. the National Institute of Science and Tech-nology and others played very important role in developing increasingly powerful and successful systems by inspiring the development and adoption of detailed evaluations and standard criteria. Many labs and researchers have got help from the availability of various research tools. HTK, Sphinx, CMU LM toolkit, SRILM toolkit etc. are few of them. All these research support along with workshops, task definitions, and system evaluations have been essential to today’s system developments.
Mel-Frequency Cepstral Coefficients (MFCC), Perceptual Linear Prediction (PLP) coefficients, Cepstral Mean Subtraction (CMS), RASTA and Vocal Tract Length Normalization (VTLN). All these are combined with multipass systems by increas-ing constraints. These are applied both in parallel and has proven successful just like feature-based transformations such as linear discriminant analysis, feature-space phone error in minimized form and neural net-based features.
3.3.3 Models and Algorithms
This methodology is still in use even today. A number of models and algorithms have been efficiently utilized within this framework. the HMMs are trained from data. Though N-gram language models are a bit simple, it has been proved as remarkably powerful and resilient. For categorizing sets of features, decision trees have been widely used. For example, using training data in pronunciations. Most common techniques include Maximum A Posteriori (MAP) probability estimation, Maximum Likelihood Linear Regression (MLLR) and Eigen Voices.
3.3.4 Searching Technique
Stack decoding concept is originated from communications and information the-ory. Later it has been applied to speech recognition systems. On the other hand Viterbi search is applied to search alternative hypotheses, is originated from dynamic programming in the 1950’s from Russia and Japan to the U.S. and Europe.
3.3.5 Metadata
The instant recognization has become an important aspect in most of the speech processing systems. From the very begining it allowed high quality automatic topic detection and tracking and applications.
3.4 Purpose of Speech Signal Processing
Speech is one of the most significant signals that humans deal with in their every day life. Purpose of speech signal processing are:
• Uderstanding speech as a means of communication.
• Generating speech for transmission and reproduction.
• Analyzing speech for extraction of information and automatic recognition.
• Discovering some physiological characteristics of the talker.
3.5 Speech Signal Processing Applications
Over the past 75 years speech signal processing has developed an extensive theo-retical and experimental base. Much research has been conducted over that period of time. But There are many more applications that are in widespread use commercially. Most widely used applications are:
3.5.1 Speech Coding
Speech Coding is the method of converting a speech signal into a representation.
3.5.2 Speech Synthesis
Speech Synthesis is the method of producing a speech signal using computational means for effective human machine interactions.
• Telematics feedback in automobiles.
• Talking agents for automated business.
• Automated voice agent in customer care service.
• Voice machines for making announcements that provide information used in stock market, airports, weather reports, etc.
3.5.3 Speech Recognition and Understanding
Speech Recognition and Understanding means the process of collecting useful linguistic information from a speech signal and utilize it in human-machine commu-nication by voice.
Examples:
• Simple commands for spreadsheets, graphical presentations, appliances.
• Voice speaker to generate documents.
• Voice dialogues using natural language with machines to enable Call Centers and assistance service.
• Voice dialing capability for smart phones
3.6 Hierarchy of Speech Signal Processing
4. DIFFERENT ASPECTS OF EMOTION
4.1 What is EmotionIn our everyday life emotion is that conscious experience represented by deep mental activity and a degree of pleasure or displeasure. Emotions are not simple. According to some theories, they are a state of feeling that results in physical and psychological changes that influence our behavior. The structural representation of emotion is connected to excitement of the nervous system. States of arousal can be related to particular emotions. Emotion is also related to behavioral tendency. Emo-tion is often considered as the driving force behind positive or negative motivaEmo-tion. Emotion is not related to cognition. Emotions are not any dependent forces but an entity that causes some components which include motivation, feeling, behavior, and physiological changes.
4.2 Components of Emotion
Emotion consists of five crucial elements. All of these processes are coordinated and synchronized for generating a particular emotional experience. Cognitive Ap-praisal, Bodily Symptoms, Action Tendencies, Expression, Feelings.
4.3 Classification of Emotion
Six emotions are classified as basic. These are: 1) Anger.
2) Disgust. 3) Fear.
4) Happiness. 5) Sadness. 6) Surprise.
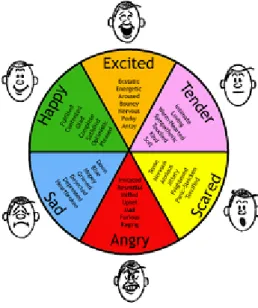
These six emotions form complex emotions through modification and collabora-tion. The complex emotions arise from cultural influences combined with the basic emotions as shown in Figure 4.1.
Fig. 4.1. Examples of Basic Emotions
For example, person to person anger and disgust could get added to form con-tempt. Some kind of link exists between these basic emotions, that brings positive or negative influences.
are a combination of a subjective component, a physiological component and an expressive component. All are influences of our emotional state. Our emotions can be very quick, such as a sudden annoyance at a colleague, or long-timed, such as going through sadness over some kind of failure. Study mentioned some important purpose of emotions as follows:
• Emotions can motivate us to take action - When sitting for a hard or difficult exam, one might feel a lot of worries about whether he or she will do well and how his or her final grade will come out. Because of these emotional feelings, one might get more motivated to study. Getting influenced by a particular emotion, one had the motivation to do something to improve his or her chances of doing good in exam.
• Emotions help us survive, thrive, and avoid danger - Emotions are the reasons that is behind both humans and animals to survive and reproduce. When we are angry, we want to deal with the source of our anger. When we experience fear, we try to get an escape from that threatening thing.
• Emotions can help us make decisions- The decisions we make are mostly based on our emotions. Researchers have also found a very strong connection between emotions and decision makings. People having defects in experiencing emotions also fails making wise decisions. Even in circumstances where we are sure that our decisions are made being influenced purely by logic and rationality, emotions keep playing its significant role.
• Emotions allow other people to understand us - When we communicate with other people, it is very essential to help them understand how we are feeling. The means to do that involves emotional expression through body language, such as various facial expressions. Facial expressions depends on what we are feeling. In other situations, it might involve speaking it directly how we feel.
• Emotions allow us to understand others - Social interaction is a part of our everyday life and social life. Being able to understand and react to the emotions of others has always been very crucial. It allows us to respond correctly and develop strong and more meaningful relationships. It also helps us to communicate perfectly everywhere, from dealing with an annoying co-worker to managing a short-tempered friend.
5. EMOTION RECOGNITION FROM SPEECH
5.1 Speech Emotion Recognition ProcessThe primary goal of Speech Emotion Recognition (SER) process is to automat-ically identify the emotional state of a human being from his or her voice. It is an in-depth analysis of the generation mechanism of speech signal, based on extracting some features which contain emotional information from the speakers voice, and then using appropriate pattern recognition methods to identify emotional states. So the complete process of synthesizing speech and then decoding and identifying emotions is a complex task. Usually this can be executed in three steps.
5.1.1 Speech Signal Database
The primary requirement when analyzing speech emotions is to choose a valid database, which is going to be the basis of the subsequent research work. Throughout the world English, German, Spanish, and Chinese single language emotion speech databases have been built. A few speech libraries also contain a variety of languages. Some examples of emotion speech database are: EMO-DB, AIBO, CSLO, and BUAA.
5.1.2 Feature Extraction
Choosing suitable speech features to be extracted for developing an emotion recog-nition system is also crucial. Mainly three types of features are extracted from speech as shown in Table 5.1.
Table 5.1
Types of Features Representing Speech
Frequency Time-related Voice Quality
Characteristics Features Parameters and
Energy Descriptors
Accent Shape, Speech Rate, Breathiness, Loudness, Average Pitch, Stress Pause discontinuity Contour Slope, Frequency , Pitch discontinuity,
Final Lowering, Brilliance
Pitch Range
5.1.3 Identifying Emotion (Training, Testing & Classifying)
Different statistics based mathematical models and stochastic processes are ap-plied to train, test and classify the speech samples. Accuracy rate of speech emotion recognition are different for different models. Some commonly used statistical models are:
• Linear Discriminant Classifiers (LDC).
• K Nearest Neighbors (k-NN).
• Gaussian Mixture Model (GMM).
• Support Vector Machine (SVM).
• Artificial Neural Networks (ANN).
5.2 Previous Studies in Speech Emotion Recognition
A few relevant works in the field of speech emotion recognition are briefly dis-cussed here. A research on the averaged tongue tip movement velocity was conducted for each of four peripheral vowels sounds (/IY/, /AE/, /AA/, /UW/) in American English as a function of four emotions. It was found in result that angry speech are characterized by greater ranges of movements and also with higher velocity. It was opposite in sad speech. In a recent SER research in Mexican Spanish, HMMs were used for the acoustic modeling of both consonants and vowels. The spectrum differences in vowels was used to detect The emotional status. But there were confu-sions between anger and happiness. A hierarchical classification technique known as Data-Driven Dimensional Emotion Classification (3DEC) was also used in a work. It used binary support vector machines (SVMs) for multiclass classification of emotions. The analysis had been done using 6552 features per speech sample extracted from three databases of acted emotional speech (DES, Berlin and Serbian) and a German database of spontaneous speech (FAU AIBO Emotion Corpus). Speech recognition based on the Mel Frequency Cepstral Coefficients (MFCCs) produced superior results than other features as reported by different researchers.
6. THEORETICAL CONCEPTS
6.1 Gaussian Mixture Model (GMM)
A Gaussian Mixture Model (GMM) is a weighted sum of M component Gaussian densities as given by the equation 6.1,
p(x|λ) = M X i=1 wig(x|µi, X i ) (6.1)
Where x is a D-dimensional continuous-valued data vector (i.e. measurement of features), wi, i = 1, .., M, are the mixture weights, and g(x|µi,
P
i), i = 1, .., M, are the component Gaussian densities. Each component density is a D-variate Gaussian function of the form,
g(x|µi, X i ) = 1 2πD2|P i| 1 2 exp{−1 2(x−µi) 0X i −1 (x−µi)} (6.2) With mean vector µi and covariance matrix
P
i. The mixture weights satisfy the constraint thatPM
i=1wi = 1. The complete Gaussian mixture model is parameterized
by the mean vectors, covariance matrices and mixture weights from all component densities. These parameters are collectively represented by the notation,
λ={wi, µi,
X
i
} i= 1, ..., M (6.3)
GMMs are capable of representing a large class of simple distributions. GMM has the ability to form smooth approximations to arbitrarily shaped densities. It is one of the powerful attributes of GMM.
Therefore, GMMs are widely used in speech emotion recognition systems. Vocal-tract related spectral features are modeled using GMM in speech processing system.
6.2 Universal Background Model (UBM)
A large GMM trained to represent the distribution of features extracted from different speech samples is known as the Universal Background Model (UBM). In the GMM-UBM system a single, independent background model is used to represent p(x|λ) derived from equation 6.1. This hypothesized background model is derived by adapting the parameters of the UBM using the speech sample data and a form of Bayesian Adaptation. Speech samples representing the expected modified features during emotion recognition are chosen. There is no fixed rule to determine the right number of speakers or amount of speech to use in training a UBM. Once data to train a UBM is collected, there are many approaches that can be used to design the final model. The most used approach is to pool all the data to train the com-plete UBM. But the important thing is that the pooled data should be balanced over the subpopulations within the data. For example, in using speech samples for emo-tion recogniemo-tion one should be sure that there is a balance of all different emoemo-tion categories. Otherwise, the final model can be biased toward the dominant emotion category. Gaussian mixture models with universal backgrounds (UBMs) is the most common standard method for speech signal analysis. Typically, a speaker model is constructed by Maximum A Posteriori (MAP) adaptation of the means of the UBM. A GMM super vector is constructed by stacking the means of the adapted mixture components.
6.3 Maximum A Posteriori (MAP) Parameter Estimation
The technique used to estimate the GMM parameters is Maximum A Posteriori (MAP) estimation. The MAP estimation is a two-step estimation process. In first step estimates of the sufficient statistics of the training data are computed for each mixture in the prior model. In second step these new sufficient statistic estimates are then combined with the old sufficient statistics from the prior mixture parameters using a data-dependent mixing coefficient. The design process of data-dependent mixing coefficient is based on the assumption that mixtures with high counts of new data rely more on the new sufficient statistics for final parameter estimation and mixtures with low counts of new data rely more on the old sufficient statistics for final parameter estimation.
Given a prior model and training vectors from the desired class,X ={x1, x2, , xT}, first the probabilistic alignment of the training vectors into the prior mixture com-ponents are determined. That is, the sufficient statistics for the weight, mean and variance parameters are computed.
ni = T X t=1 P r(i|xt, λprior) (W eight) (6.4) Ei(x) = 1 ni T X t=1 P r(i|xt, λprior)xt (M ean) (6.5) Ei(x2) = 1 ni T X t=1 P r(i|xt, λprior)x2t (V ariance) (6.6) The adaptation coefficients controlling the balance between old and new estimates are {αiw, αim, αiv}for the weights, means and variances, respectively. This is defined as,
αρi = ni ni+rρ
ˆ wi = [ αiwni T + (1−αi w)w i]γ (6.8) ˆ µi =αimEi(x) + (1−αim)µi (6.9) ˆ σi2 =αivEi(x2) + (1−αiv)(σi2+µi2) ˆµi2 (6.10) Where the scale factor, γ, is computed over all adapted mixture weights to ensure they sum to unity.
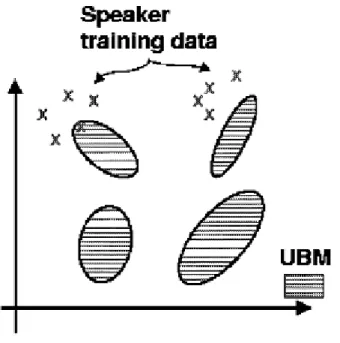
MAP estimation is used in speaker recognition applications to derive speaker model by adapting from a universal background model (UBM). For example, Figure 6.1 and Figure 6.2 show two steps in adapting a hypothesized speaker model.
In Figure 6.1 the training vectors are probabilistically mapped into the UBM (prior) mixtures.
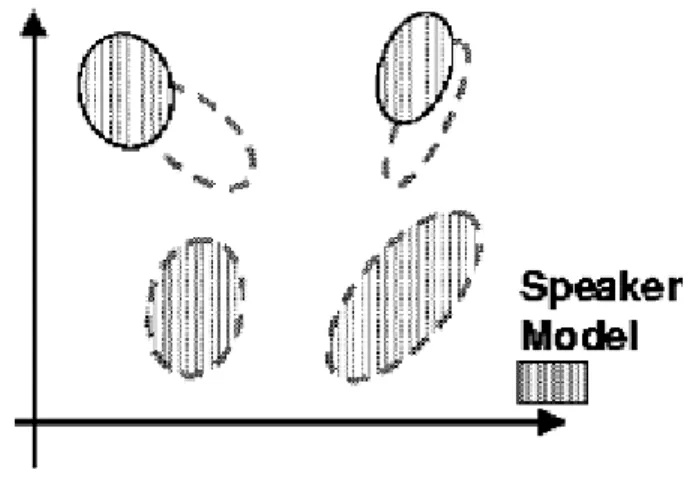
Fig. 6.2. MAP Adaptation Step 2
In Figure 6.2 the adapted mixture parameters are derived using the statistics of new data and the UBM (prior) mixture parameters.
MAP is also used in other pattern recognition tasks where limited labeled training data is used to adapt a prior, general model.
6.4 Support Vector Machine (SVM)
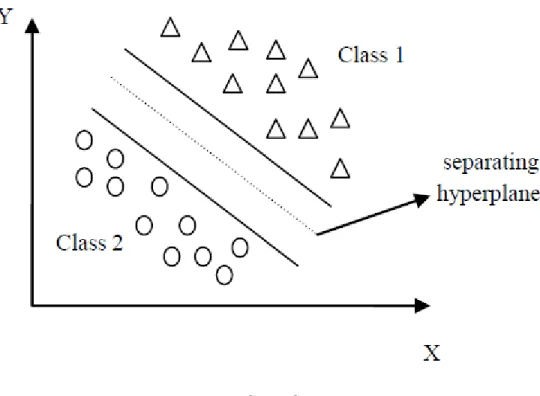
Support Vector Machine (SVM) is a much known effective approach for pattern recognition. Here, the basic concepts of the SVM will be presented briefly. In SVM approach, the main aim of an SVM classifier is obtaining a function f(x), which determines the decision boundary or hyperplane. This hyperplane optimally separates two classes of input data points. This hyperplane is shown in Figure 6.3.
Fig. 6.3. SVM Structure
SVM is based on the idea to transform the original input set to a high dimensional feature space by using a kernel function. In this kernel function input space consisting of input samples is converted into high dimensional feature space and therefore the input samples become linearly separable. It is clearly explained by using an optimal separation hyperplane in Figure 6.3.
The main advantage of SVM is that it has limited training data and hence has very good classification performance. For linearly separable data points, classification is done by using the following formula,
< w·x >+b0 ≥1,∀y = 1 (6.11)
< w·x >+b0 ≥ −1,∀y =−1 (6.12) Where (x, y) is the pair of training set. Here, x∈R and y∈ {−1,+1}. < w·x > represents the inner product of w and x whereas refers to the bias condition. SVM
that employs both the linear kernel function and the Radial Basis Kernel (RBF) function is used here. The linear kernel function is given by the formula below,
Kernel(x, y) = (x·y) (6.13) The radial basis kernel function is given by the following formula,
Kernel(x, y) = e −||x−y||2
2σ2 (6.14)
The SVM classifier places the decision boundary by using maximal margin among all possible hyper planes.
The Support Vector Machine (SVM) is widely used as a classifier for emotion recognition for classification and regression purpose. It performs classification by constructing an N-dimensional hyperplane that optimally separates data into cate-gories. The classification is achieved by a linear or nonlinear separating surface in the input feature space of the dataset.
6.5 i-vector Algorithm
The conventional i-vector extraction is a probabilistic compression process which reduces the dimensionality of the GMM vectors. It models the GMM super vector M(s,h)as the sum of the independent mean super vector m and total variability vector.
M(s,h) =m+T w(s,h) (6.15)
Where m is the UBM mean super vector, T and w(s,h) represents the total
vari-ability matrix and i-vector respectively. Extraction of i-vector will minimize the variability and will normalize the co-variance of GMM vectors.
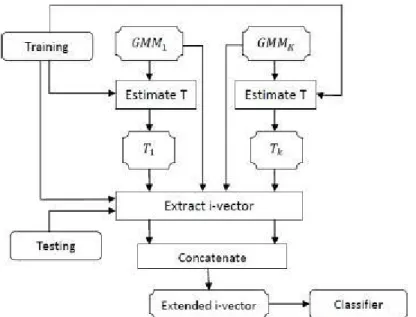
Fig. 6.4. i-vector Algorithm Model
Figure 6.4 shows i-vector algorithm model. First GMM Universal Background Model is trained using neutral based corpus (GM Mg in Figure 6.4 ) and emotion specific GMMs are trained by MAP adaption (GM M1 in Figure 6.4 ). After that
i-vector features are generated for different emotional specific GMMs which are then concatenated to form extended i-vector features.
7. EXPERIMENT
7.1 Speech Database SelectionFor our study the Interactive Emotional Dyadic Motion Capture (IEMOCAP) database collected at Signal Analysis and Interpretation Laboratory (SAIL) at Uni-versity of Southern California (USC) was used. IEMOCAP database is an acted, multimodal and multi speaker database. A total of 11.5GB of data contains 12 hours of both improvised and scripted sessions of 10 actors (male & female). The database contains 4 types of emotion speech samples- angry (25%), happy (15%), sad (20%) and neutral (40%). The interconnection of typical features of the emotions is getting analyzed by means of speech-re-synthesis in order to get the controlled variation of some distinguished features.
7.2 Feature Extraction
The parameters which generally bring significant changes in speech produced un-der influence of different emotional state. For this research a total of 51 features were extracted from each speech sample using OpenSMILE toolkit. OpenSMILE toolkit is a modular and flexible feature extractor for signal processing specifically for audio-signal features. It is written purely in C++ and capable of data input, signal processing, general data processing, low-level audio features, functional, classifiers and other components, data output, and other capabilities.
List of Extracted Features
Pitch Contour Minimum, Maximum, Mean 1-3 Formant Frequency Minimum, Maximum, Mean 4-6 Log Energy (LE) - Minimum, Maximum, Mean 7-9 Average Magnitude Difference (AMD) -Minimum, Maximum, Mean 10-12
Mel-Frequency Cepstral Coefficients (MFCC) 13-25
MFCC (1st Derivative) 26-38
MFCC (2nd Derivative) 39-51
7.2.1 Formant Frequency
Resonant frequencies of the vocal tract are known as Formant Frequencies. The location of vocal tract resonances in the frequency domain depends upon the shape and the physical dimensions of the vocal tract. Therefore speech scientists defined formants as a representation of quantitative characteristics of the vocal tract. It has been found that speakers during trauma or under frustration do not produce voiced sounds with the same effects as in the normal emotional state. There exists a strong dependency of spectral characteristics on phonemes and also on the phonetic content of a speech sample. Vowels are recognized primarily by the location of the first three formant frequencies. This approach adopted in this work takes advantage of all these facts, but by using only formants for SER.
Steps to calculate formant frequency from a speech sample is shown using a block diagram in Figure 7.1.
Fig. 7.1. Formant Frequency Calculation
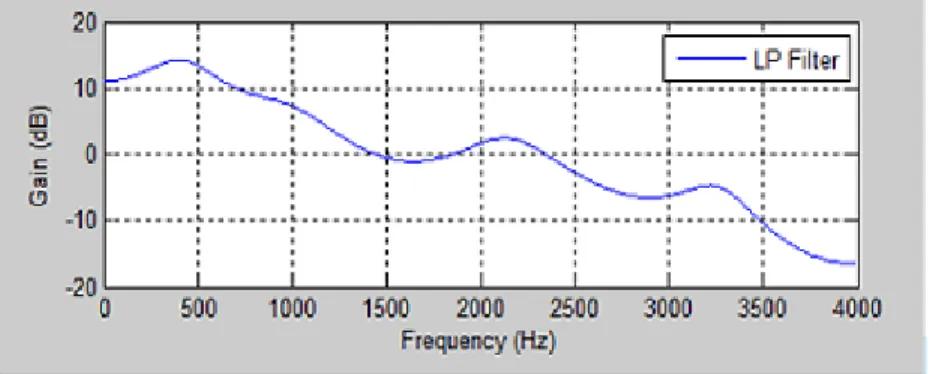
In acoustics, formants are defined as a peak in the sound envelope and/or to a res-onance in sound sources or that of sound chambers. LPC Based Formants Estimation Technique is used for Extraction of Formant Frequencies. The vocal tract is modeled as a linear filter with resonances. Graphically, the peaks of the vocal tract response of speech signal usually correspond to its formant frequencies. If the vocal tract is modeled as a time-invariant, all-pole linear system, then each of the conjugate pair of poles that corresponds to a formant frequency or resonance frequency. Graphical rep-resentation of Formant frequencies estimation for a speech signal in angry emotional state is shown in Figure 7.2.
Fig. 7.2. Graphical Representation of Formant Frequencies for Angry Emotion
The process mechanism of computing a linear prediction model and the application in formant frequencies estimation is explained below.
i=1
Where,NLP is the number of coefficients in the model,aLP is the linear prediction coefficients ande(n) is the error in the model. LPC analysis of speech signal generates predictor polynomial of degree at least 10. Due to stability requirement, it has all its roots within unit circle. Equation 7.1 is written in Z-transform notation as a linear filtering operation below,
E(z) =HLP(z).S(z) (7.2) E(z) is the Z-transform of the error signal and S(z) is the speech signal. HLP(z) is a linear prediction inverse filter.
HLP(z) = NLP
X
i=0
aLP(i).z−i (7.3) From the LP smoothed spectrum formant frequencies can be approximated. Next using spectrum, local maxima are found. Maximas with small bandwidths are related to formants. Based on the relationship between formant and poles of the vocal tract filter formant frequencies are estimated. The denominator of the transfer function may be factored, 1 + NLP X i=0 aLP(i).z−i = NLP Y k=0 (1−ck.z−1) (7.4) Where, Ck are a set of complex numbers. Each complex conjugate pair of poles is a representation of a resonance at frequency:
Fk = (Fs/2π) tan−1[Im(ck)/Re(ck)] (7.5) And bandwidth:
Also if the pole lies close to the unit circle then the root represents a formant frequency.
rk= (Im(ck)2+Re(ck)2)
1/2
≥0.7 (7.7)
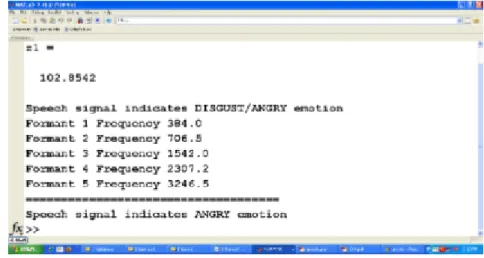
Formant frequency calculation procedure for angry emotion is shown in Figure 7.3.
Fig. 7.3. Formant Frequency Calculation of Speech Signal for Angry Emotional Speech
7.2.2 Mel-Frequency Cepstral Coefficients (MFCC)
The coefficients representing the vocal tract are known as Mel-Frequency Cepstral Coefficients (MFCC). MFCC are widely used in audio analysis & recognition. The 1st & 2nd derivatives of MFCCs demonstrate change over time. MFCCs & derivatives are really useful to easily compare patterns. In the low frequency region MFCC has a very good frequency resolution. It can also stay robust in presence of noise. But the accuracy in the high frequency region is comparatively low.
Fig. 7.4. Process of Calculating MFCC
Discrete Cosine Transform (DCT) is used to calculate MFCC from the audio clip. MFCC process is carried out by multiple phases as shown in Figure 7.4. In the framing section, the speech waveform is divided into separate frames of approximately 60 milliseconds. Windowing minimizes the discontinuities of the signal by padding the beginning and end of each frame with zero. The FFT converts each frame from the time domain to the frequency domain. During the Mel frequency wrapping operation, to implement human hearing the signal is plotted against the Melspectrum. Speech science defines that human hearing does not follow the linear scale. It follows the
Mel-spectrum scale which is a linear spacing below 1000 Hz and logarithmic scaling above 1000 Hz. Finally, the Mel-spectrum plot is transformed to the time domain by using the following equation given below,
M el(f1) = 2595∗log10(1 +f1/700) (7.8) Figure 7.5 shows matlab command window showing mean of MFCC values for neutral emotion.
Fig. 7.5. Matlab Command Window Snapshot for Neutral Emotion
7.3 GMM UBM Calculation and i-vector Extraction
Software used in this step was Matlab. Extracted features by using OpenSMILE toolkit were used to train and classify every emotion. The GMM model algorithm condenses the 12 features and the 39 MFCCs. Then GMM UBM mixture compo-nents were computed for each speech sample using MAP adaptation algorithm. The multi-dimension i-vector of each sample is extracted. The total variability matrix T is trained by all the training speech samples. For conventional i-vector, Linear
Discrim-emotion groups according to the average frequency values and the variance of MFCCs for different samples.
Fig. 7.6. Classification of Emotion Groups
7.4 SVM Classification and i-vector Extraction
All of the calculated features were put into an Nx51 matrix where N is equal to the total number of samples in the input signals. This matrix was given as input to the SVM classifier. The complete system design is shown in Figure 7.7.
Fig. 7.7. System Diagram
The libsvm tool in Matlab was used to do the cross validation of models and analyzing of results. For each emotion, speech utterances were divided into two subsets: training subset and testing subset. The number of speech utterances for emotion as the training subset is 90% and 10% as the test subset. First the classifier was trained with speech samples from training subset. After training the classifier, it was used to recognize the new given input speech sample from testing subset. The dimensionality and the variability of output of the classifier was reduced by using i-vector extraction method.
8. RESULTS
After designing the proposed system using mathematical algorithm that is utilized with the different features derived after extraction techniques classification of speech signal for emotion is done. New input signals were classified based on those emotion groups. Each new input signals features were compared with each emotion group feature frequency values and were categorized accordingly. Speech signal samples used to train the classifier and to test the classifier were kept different.
Neutral speech signal recognition result is given in Figure 8.1.
Table 8.1
Identification Rate of Emotions
Category Only GMM-UBM With i-vector
Algorithm (%) Algorithm (%) Angry 49.63 63.87 Happy 81.35 90.36 Sad 63.77 78.26 Neutral 54.91 69.68 Average 62.42 75.54
It can be seen from Table 8.1 that proposed i-vector algorithm can enhance the performance of emotion recognition in each four emotional states. The average iden-tification rates increases by 21.02% compared with that of conventional GMM-UBM algorithm. Also overall this novel emotion identification system was almost 76% accurate.
The identification rates of the system using only SVM algorithm and using i-vector algorithm with SVM algorithm are shown in Table 8.2.
Table 8.2
Identification Rate of Emotions
Category Only SVM With i-vector
Algorithm (%) Algorithm (%) Angry 48.15 62.25 Happy 81.35 91.33 Sad 61.97 79.13 Neutral 54.91 74.66 Average 61.60 77.59
It can be seen from Table 8.2 that proposed algorithm can identify different types of emotions with good number of accuracy. For happy emotion the identification rate is as high as 92%. When i-vector algorithm was introduced it enhanced the performance of emotion recognition significantly. The average identification rates increases by 25.96% compared with that of conventional SVM algorithm. Also overall this proposed emotion identification system was almost 78% accurate.
9. FUTURE SCOPE
The proposed speech emotion recognition system could be an important addition in the field of emotion recognition. This system may be really useful to lie detection as it almost correctly recognized all the emotions. Emotion can be a very effective way of identifying lies, and thus this application has potential application in that. I look forward to pursuing this system for lie detection in the near future. Lie detection is very crucial security organizations. It is also used in a household surroundings. Currently most lie detectors or polygraphs don’t utilize emotion to determine the validity of the speaker’s saying. Our proposed model may allow for more accurate lie detection.
This emotion recognition method can also be useful to differentiate between autis-tic speakers and normal speakers. Moreover it can also be used to determine the severity of autism based on acoustic features. As autistic children have difficulty un-derstanding emotion, so this research can be applied to create an emotion signaling device. This wristwatch-type device will detect emotions - happy, sad, angry, etc.
Transmission of emotion is essential to communication. Therefore we have so many applications of emotion recognition in all areas of modern life. It may contribute in automation and artificial intelligence. This will improve and enhance the lifestyle of many people all over the world, and will also increase the scope in the field of digital signal processing.
10. CONCLUSION
From experimentation and result it has been proved that a new classification system to identify emotions from speech signals of different emotions was successfully devel-oped, trained, and tested. Hopefully that day will come very soon when a real-time system capable of determining any emotions at a human-comparable accuracy will be developed. This proposed i-vector algorithm has achieved accuracy of 78% while implemented with two different statistical algorithms which is really good if compared to the other available systems. More work is needed to improve the system so that it can be better used in real-time speech emotion recognition.
Emotion recognition has already been proven very useful for security, user-computer interactions, gaming, and lie detectors. Also real-time emotion recognition can be of great help to the autistic children to recognize emotions. But currently used emotion recognition systems are often not so accurate in realistic settings. By our research we successfully established a method for emotion recognition from speech signals which improved the accuracy of speech emotion recognition process statically and dynami-cally.
LIST OF REFERENCES
[1] P. N. Juslin, K. R. Scherer, “Speech emotion analysis”, Scholarpedia, 3(10): 4240, 2008
[2] J. Gomes, M. El-Sharkawy, “i-vector algorithm with Gaussian Mixture Model for efficient speech emotion recognition”, The 2015 International Conference on Computational Science and Computational Intelligence (CSCI), Las Vegas, Page(s) 476-480, NV, USA, December 2015
[3] The Psychology of Emotion, Internet Source: psychology.about.com/od/ psy-chologytopics.html, Last Date Accessed: 03/28/2016
[4] A. A. Khulage, B. V. Pathak, “Analysis of speech under stress using linear techniques and non-linear techniques for emotion recognition system”, Cummins College of Engineering, Pune, July 2012
[5] Y. Pan, P. Shen, L. Shen, “Speech emotion recognition using Support Vector Machine”, International Journal of Smart Home, vol. 6, no. 2, April 2012
[6] Speech Processing, Internet Source: en.wikipedia.org/wiki/Speech pro cessing.html, Last Date Accessed: 03/28/2016
[7] U. Shrawankar, A. Mahajan, “Speech: a challenge to digital signal processing technology for human-to-computer interaction”, Conference Proceedings Na-tional Conference on Recent Trends in Electronics & Information Technology (RTEIT), pp 206-212, 2006
[8] Digital Signal Processing, Internet Source: en.wikipedia.org/wiki/Digital signal processing.html, Last Date Accessed: 03/28/2016
[9] K. Cherry, “The purpose of emotions; how our feelings help us survive and thrive”, The everything psychology book, second edition, April 2014
[10] A. Krishnan, M. Fernandez, “The recognition of emotion in human speech, static and dynamic analysis”, Siemens Competition 2010, September 2010 [11] J. Gomes, M. El-Sharkawy, “Speech emotion recognition system by using
sup-port vector machine and i-vector algorithm”, Interspeech 2016, San Francisco, September 2016
[12] D. Reynolds, “Gaussian mixture models”, MIT Lincoln Laboratory, 244 Wood St., Lexington, MA 02140, Encyclopedia of Biometrics, 827-832, USA, 2015 [13] D. A. Reynolds, T. F. Quatieri, R. B. Dunn, “Speaker verification using adapted
Gaussian mixture models”, Digital Signal Processing 10, 19-41, USA, 2000 [14] W. M. Campbell, D. E. Sturim, D. A. Reynolds, A. Solomonoff, “SVM based
speaker verification using a GMM super vector kernel and NAP variability com-pensation”, 2006 IEEE International Conference on Acoustics, Speech and Sig-nal Processing, Toulouse, France, May 2006
[15] B. Panda, D. Padhi, K. Dash, S. Mohanty, “Use of SVM classifier & MFCC in speech emotion recognition system”, International Journal of Advanced Re-search in Computer Science and Software Engineering, vol. 2, issue. 3, March 2012
[16] S.V.N. Vishwanathan, M. N. Murty, “SSVM: A simple SVM algorithm”, Pro-ceedings of the 2002 International Joint Conference on Neural Networks (IJCNN), Honolulu, HI, 2002
[17] J. Watson, “Support Vector Machine tutorial”, NEC Labs America, Princeton, USA, 2012
[18] V. K. Ingle, J. G. Proakis, “Digital Signal Processing Using Matlab V.4 (Bk & Disked.)”, Boston, MA: PWS Publishing Company, 1996
[19] A. Milton, S. S. Roy, S. T. Selvi, “SVM scheme for speech emotion recognition using MFCC feature”, International Journal of Computer Applications (0975 8887), vol. 69, no. 9, May 2013
[20] Y. Chavhan, M.L. Dhore, P. Yesaware, “Speech Emotion Recognition using Support Vector Machine”, 2010 International Journal of Computer Applications (0975-8887), vol. 1, no. 20, 2010
[21] L. Chen, Y. Yang, “Emotional speaker recognition based on i-vector through atom aligned sparse representation”, 2013 IEEE International Conference on Acoustics Speech and Signal Processing (ICASSP), May 2013
[22] R. Xia, Y. Liu, “Using i-vector space model for emotion recognition”, Thirteenth Annual Conference of the International Speech Communication Association, Portland, Oregon, USA, December 2012
[23] C. Busso, M. Bulut, C.C. Lee, A. Kazemzadeh, E. Mower, S. Kim, J. N. Chang, S. Lee, and S.S. Narayanan, “IEMOCAP: Interactive emotional dyadic motion capture database”, Journal of Language Resources and Evaluation, vol. 42, no. 4, pp. 335-359, December 2008
[25] Intelligent Audio Engineering, Internet Source: audeering.com/research/open smile.html, Last Date Accessed: 03/28/2016
[26] V. K. Ingle, J. G. Proakis, “Digital Signal Processing Using Matlab V.4 (Bk & Disked.)”, Boston, MA: PWS Publishing Company, 1996
[27] H. Yu, J. Yang, “A direct LDA algorithm for high-dimensional data with ap-plication to face recognition”, Pattern Recognition, 34(2001) pg. 2067-2070, 2001
[28] Speech Emotion Recognition, Internet Source: advancedsourcecode.com/speech emotion.asp.html, Last Date Accessed: 03/28/2016
[29] J. M. Baker, L. Deng, S. Khudanpur, C. Lee, J. Glass, N. Morgan, “Historical development and future directions in speech recognition and understanding”, Report of the speech understanding working group, 2006-2007, October 2007