University of Iowa
University of Iowa
Iowa Research Online
Iowa Research Online
Proceedings of the Ophthalmic Medical Image Analysis International Workshop
Oct 9th, 2015
Automatic Grading of Diabetic Retinopathy on a Public Database
Automatic Grading of Diabetic Retinopathy on a Public Database
Lama Seoud
Diagnos Inc.Jihed Chelbi
Diagnos Inc.Farida Cheriet
Polytechnique MontrealFollow this and additional works at: https://ir.uiowa.edu/omia
Part of the Ophthalmology Commons
Recommended Citation
Recommended Citation
Seoud, Lama; Chelbi, Jihed; and Cheriet, Farida. Automatic Grading of Diabetic Retinopathy on a Public Database. In: Chen X, Garvin MK, Liu JJ, Trusso E, Xu Y editors. Proceedings of the Ophthalmic Medical Image Analysis Second International Workshop, OMIA 2015, Held in Conjunction with MICCAI 2015, Munich, Germany, October 9, 2015. 97–104. https://doi.org/10.17077/omia.1032
Rights
Copyright © 2015 Lama Seoud, Jihed Chelbi and Farida Cheriet
Lama Seoud1, Jihed Chelbi1and Farida Cheriet2
1 Diagnos Inc., Brossard, QC, Canada ([email protected]) 2 Polytechnique Montreal, QC, Canada
Abstract. With the growing diabetes epidemic, retina specialists have to examine a tremendous amount of fundus images for the detection and grading of diabetic retinopathy. In this study, we propose a first automatic grading system for diabetic retinopathy. First, a red lesion detection is performed to generate a lesion probability map. The latter is then represented by 35 features combining location, size and probabil-ity information, which are finally used for classification. A leave-one-out cross-validation using a random forest is conducted on a public database of 1200 images, to classify the images into 4 grades. The proposed system achieved a classification accuracy of 74.1% and a weighted kappa value of 0.731 indicating a significant agreement with the reference. These pre-liminary results prove that automatic DR grading is feasible, with a performance comparable to that of human experts.
1
Introduction
In 2025, it is expected that 333 million diabetic patients worldwide will require annual retinal examination for the screening and monitoring of diabetic retinopa-thy (DR) [1]. This leaves retina specialists with a tremendous number of fundus images to examine and out of which only about 10% will reveal signs of DR [2]. Moreover, human examination of these images is subjective and affected by inter-reader variability.
Our research goal is to develop an automatic triage system that can identify images with suspected signs of DR and sort it according to its severity level based on clinical classification as in [3]. Images deemed suspect are then sent, together with the computed severity level, to the retina specialist for examination.
Many studies have been conducted for computer-aided detection of DR using a lesion detection step [2, 4–6]. However, to our knowledge, these methods have only been tested for screening, to distinguish images with and without DR.
Recently, our group proposed a new method for the simultaneous detection of microaneurysms (MA) and hemorrhages (HE) in color fundus images [7], based on novel dynamic shape features. The proposed method achieves competitive performances in detecting lesions as well as in detecting images with at least one sign of DR as opposed to images without DR.
The objective of this study is to go one step further by proposing an auto-matic grading system for DR capable of classifying the images according to DR’s severity levels.
X. Chen, M. K. Garvin, J. Liu, E. Trucco, Y. Xu (Eds.): OMIA 2015, Held in Conjunction with MICCAI 2015, Munich, Germany, Iowa Research Online, pp. 97–104, 2015. Available from: http://ir.uiowa.edu/omia/2015_Proceedings/2015/
2
Method
The proposed method starts by computing a red lesion probability map using the output of the lesion detection proposed in [7]. Then, the optic disc (OD) and fovea positions are detected as well as OD’s radius. Using all this information, image features are extracted and used to classify the image according to DR’s severity level. The different steps are presented in the following subsections.
2.1 Red lesion probability map
Starting from an input image, the red lesions detection is performed according to the method described in [7]. Briefly, all local minima darker than the background are identified in the green channel of the image and considered as candidates. Then, color and dynamic shape features are extracted for each candidate and used for its classification. The latter is performed using a random forest trained on images for which a manual segmentation of the lesions is provided. Finally, the classifier returns, for each candidate, a probability of being a lesion.
Because the public dataset used in the present study does not provide a per-lesion segmentation as required for the training of the classifier, we used a private set of 143 images annotated by 2 retina experts. This dataset contains JPEG compressed 45ofundus images aquired through a telemedecine platform,
thus using a variety of retinographs, mostly models of Zeiss, Topcon, Canon and DRS cameras. The resolution, reported in terms of number of pixels on the radius of the retinal region of interest (notedR) varies between 700 and 1620 pixels. Among the 143 images, we count 1071 annotated MAs and 313 HEs.
At this point, a candidate is a group of pixels corresponding to a local mini-mum. The edges of such a candidate do not delineate a contextual object. Since classifications of DR’s severity level distinguish MA from HE, information on the size of the candidates is required. Thus, a candidate segmentation is performed using the watershed algorithm and the gradient of the image’s green channel.
Once a candidate is properly delineated, the candidate probability is at-tributed to each of its pixels. This results in a red lesion probability map.
2.2 Optic disc and fovea detection
The spatial distribution of the lesions is an important feature in clinical classi-fications of DR’s severity level. Thus, to evaluate the position of the lesions in the probability map, an image-specific anatomical frame is built using the OD and fovea’s positions as well as OD’s radius.
To detect the OD, we estimate of OD’s center position using the method based on vessels directional entropy map [8]. To refine the position and estimate OD’s radius, a convolution with a multiscale ring shaped matched filter is per-formed in a limited area around the estimated position. The filter’s position and radius that maximize the response are finally selected to model the OD.
Using the resulting OD’s information, a fovea search area is constructed using anatomical priors [9]. In this limited area, a mean filter is applied to smooth the
image. Finally, the fovea’s center position is defined as the centroid of the regional minimum in this search area.
2.3 Image features
According to clinical DR’s severity scales, such as the American Academy of Ophtalmology’s [3], the severity level is based on the number of lesions, with distinction between MA and HE, and their spatial distribution in the retina. At this step, we need to represent the lesion probability map by a fixed size vector of features derived from a variable number of lesion candidates, some of which not corresponding to real lesions. We thus propose to combine the lesions likelihood using the following features computed across all candidates:
– the distance between the fovea and the per-candidate center of mass (PCCM):
P CCM = PM j=1pjXj PM j=1pj , PM j=1pjYj PM j=1pj ! (1) withXj andYjthe coordinates of the centroids of theM non-zero candidate
regions in the probability map, divided by OD’s radius,
– the mean probability over theM candidate regions,
– the highest probability in the map,
– the 10-bins probability histogram of the candidate regions whose size is less than 0.0001×R2,
– the 10-bins probability histogram of the candidate regions whose size is greater than 0.0001×R2.
Because there is no clear criteria to differentiate MA from dot HE in fundus images, we considered an empirical threshold of 0.0001xR2on the lesions size to
distinguish MAs from HEs. However, to take even more into account the lesions size, the following additional features are computed across all candidate pixels:
– the distance between the fovea and the per-pixel center of mass (PPCM):
P P CM = PN i=1piXi PN i=1pi , PN i=1piYi PN i=1pi ! (2) with Xi and Yi the coordinates of the N non-zero pixels in the probability
map, divided by OD’s radius,
– the mean probability over theN pixels,
– the 10-bins probability histogram normalized toR2.
In total, the probability map is summarized in a vector of 35 features.
2.4 Image classification
Based on the described features, images are classified using a random forest. We empirically set the number of trees to 500, and the number of features to be selected at each node to the squared root of the number of features.
3
Material and experimental setup
This preliminary study is conducted on a public dataset, the Messidor dataset [10]. It is composed of 1200 color fundus images acquired using a variety of retinographs. The image resolution is comprised between 870 pixels and 1400 pixels on the ROI diameter. We used this database because it is the only public one that provides a DR grading of the images. In fact, two labels are provided for each image in the dataset: the retinopathy grade and the risk of macular oedema. In this study, we only use the retinopathy grade as a reference, a description of which is provided in Table 1 together with the number of images for each grade.
Table 1: Retinopathy grade in Messidor database
Grade Description Nb Images
R0 (NM A= 0) AND (NHE= 0) 546
R1 (0< NM A≤5) AND (NHE= 0) 153
R2 (5< NM A<15) AND (0< NHE<5) AND (NN V = 0) 247
R3 (NM A≥15) OR (NHE≥5) OR (NN V >0) 254
NM A, NHE, NN V: number of MAs, HEs and neovessels (NV), respectively
To evaluate the proposed methodology, a leave-one-out cross-validation is performed. At each iteration, 1199 images are used to train a RF model and the single remaining image is used for testing. This step is repeated until all the 1200 images have been used for testing.
The confusion matrix is computed between predicted and reference retinopa-thy grades. Moreover, classification accuracy and agreement between the pre-dictions and the reference using the weighted kappa value [11] are calculated to quantify the performance of the proposed automatic grading system.
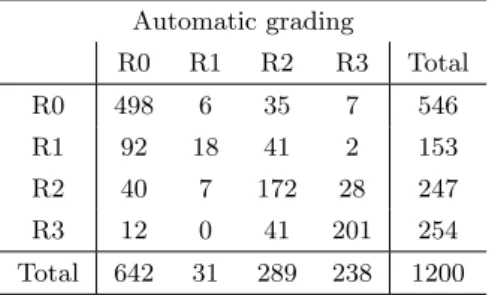
Table 2: Confusion matrix for retinopathy grade between the reference standard and the automatic grading system
Automatic grading R0 R1 R2 R3 Total R0 498 6 35 7 546 R1 92 18 41 2 153 R2 40 7 172 28 247 R3 12 0 41 201 254 Total 642 31 289 238 1200
4
Results
The confusion matrix is provided in Table 2. Overall, 91% of R0 images, 12% of R1 images, 70% of R2 images and 79% of R3 images are correctly graded. The classification accuracy is of 0.741 and the weighted kappa value is 0.731 indicating a good and statistically significant (95%) agreement between the predictions and the reference.
In Table 3, the classification accuracy and the weighted kappa value are reported in comparison with the performance of two retina experts (A and B) taken from the evaluation of Sanchez et al. [5] on the same set of images.
Table 3: Classification accuracy and agreement between Messidor reference, human experts [5] and the automatic grading system (AGS)
Accuracy Weightedκ[95% CI]
Reference Expert B Reference Expert B
Expert A 0.730* 0.711* 0.755* 0.694* [0.733-0.780]* [0.664-0.725]* Expert B 0.681* - 0.637* -[0.604-0.670]* AGS 0.741 - 0.731 -[0.689-0.772] (*) values taken from [5]
Figure 1 illustrates 3 misclassified images together with their probability maps. Among R0 images graded by the system as R2 and R3, several images show an important reflection of the nerve fiber layer. In fact, in such cases, the vascular network around the macula is interspersed with reflections, leading to several false positive lesion detections. Also, in R0 images where the choroidal vasculature is highly visible, segments of these vessels are falsly detected as lesions leading to false positive images. Among R2 and R3 images graded by the system as R0, several images show no visible MAs nor isolated HEs but blood leaking from large vessels. These HEs are directly linked to large vessels and the dynamic shape features are not discriminant enough to classify it as lesions.
5
Discussion
The results of this preliminary study demonstrate the feasibility of an automatic grading system for DR. With a classification accuracy of 0.741, most of the R0, R2 and R3 images are correctly graded. R1 images seem to be the most difficult to grade, even for human experts. In fact, the expert B in [5] graded only 3 R1 images correctly. Both human expert B and the proposed automatic system
identify R1 images mostly as images without DR (146 and 92 R1 images are graded as R0 respectively by expert B and our system). Nevertheless, these false negatives correspond to observable DR and according to clinical classification schemes [3], these cases do not need to be referred to a specialist.
In the literature, very few attempts to automatically grade DR’s severity levels have been conducted so far. Unfortunately, the method in [12] was evalu-ated on a private dataset so no direct comparison can be made with our results. Acharya et al. reported a classification accuracy of 85.2% [13], however their method is validated only on a subset of 180 images of the Messidor database.
The image features used in this study are inspired from the criteria of clinical classifications of DR’s severity level, such as the one in [3], which differ from the grading scheme of the Messidor database. Indeed, in Table 1, the spatial distri-bution of the lesions is not taken into account, whereas in [3], this information is crucial for the classification of images with severe non proliferative DR. Thus, the two distance features proposed in this study might be introducing misleading information for the Messidor classification. Moreover, the American Academy of Ophtalmology (AAO) proposes a classification into 5 severity levels, instead of 4 in Messidor. These differences could partly explain the misclassified images. In future work, we aim at building a fundus image database with DR grading pro-vided by human experts according to the clinical classification of the AAO. This dataset could then be used to train and validate an automatic grading system such as the one proposed in this study.
The proposed image grading system is based on a previously validated au-tomatic detection of MAs and HEs. Nevertheless, several lesions are still missed from the detection, particularly large HEs leaking from larger vessels. Moreover, in the proposed method, the neovessels which are signs of proliferative DR are not detected yet. This explains partly why not all R3 images are classified cor-rectly. To reduce the number of missed R2 and R3 images, future work will focus on the detection of these specific lesions.
Even though the proposed system does not achieve very high accuracy, its performance is highly comparable to that of human experts. The agreement between the automatic grading and the reference of the Messidor database is exactly in the range of the agreement between independant human experts and the same reference [5]. In fact, as mentioned in [5], human grading of DR is sub-jective and depends on the reader’s experience. This finding emphasizes the need for an automatic grading system that could reduce the inter-reader variability.
6
Conclusion
The goal of this study was to propose an automatic grading system for diabetic retinopathy, using the output of a validated red lesion detection method. Evalu-ated on a public database of 1200 images by leave-one-out cross-validation, the proposed system achieved an accuracy of 74.1%. Its performance is in the range of inter-experts variability, proving the feasibility of an automatic DR grading
Fig. 1: Exemple of 3 misclassified images (on the left) with their color-coded lesion probability map (on the right). The 2 upper images are graded as R3 and R2 respec-tively while the reference is R0. The bottom image is graded as R0 while the reference is R3 because of the large HE delimited in white on the original image.
system. Future work will focus on the detection of neovessels and large HEs to improve the classification performances.
References
1. Gan, D., ed.: Diabetes Atlas - Second Edition. Internatio edn. (2003)
2. Niemeijer, M., van Ginneken, B., Staal, J., Suttorp-Schulten, M.S.A., Abr`amoff, M.D.: Automatic detection of red lesions in digital color fundus photographs. IEEE transactions on medical imaging24(5) (2005) 584–92
3. Wilkinson, C.P., Ferris, F.L., Klein, R.E., Lee, P.P., Agardh, C.D., Davis, M., Dills, D., Kampik, A., Pararajasegaram, R., Verdaguer, J.T.: Proposed international clinical diabetic retinopathy and diabetic macular edema disease severity scales. Ophthalmology110(9) (2003) 1677–82
4. Niemeijer, M., van Ginneken, B., Cree, M.J., Mizutani, A., Quellec, G.G., Sanchez, C.I., Zhang, B., Hornero, R., Lamard, M., Muramatsu, C., Wu, X., Cazuguel, G., You, J., Mayo, A.A., Li, Q., Hatanaka, Y., Cochener, B.B., Roux, C., Karray, F., Garcia, M.M., Fujita, H., Abramoff, M.D.: Retinopathy online challenge: au-tomatic detection of microaneurysms in digital color fundus photographs. IEEE transactions on medical imaging29(1) (2010) 185–95
5. Sanchez, C.I., Niemeijer, M., Dumitrescu, A.V., Suttorp-Schulten, M.S.A., Abr`amoff, M.D., van Ginneken: Evaluation of a computer-aided diagnosis system for diabetic retinopathy screening on public data. Investigative ophthalmology & visual science52(7) (2011) 4866–71
6. Fleming, A.D., Goatman, K.A., Philip, S., Prescott, G.J., Sharp, P.F., Olson, J.A.: Automated grading for diabetic retinopathy: a large-scale audit using arbitration by clinical experts. British Journal of Ophthalmology94(12) (2010) 1606–1610 7. Seoud, L., Faucon, T., Hurtut, T., Chelbi, J., Cheriet, F., Langlois, J.M.P.:
Au-tomatic detection of microaneurysms and haemorrhages in fundus images using dynamic shape features. In: IEEE 11th International Symposium on Biomedical Imaging, Beijing (2014) 101–104
8. Mendon¸ca, A.M., Sousa, A., Mendon¸ca, L., Campilho, A.: Automatic localization of the optic disc by combining vascular and intensity information. Computerized medical imaging and graphics37(5-6) (2013) 409–17
9. Fleming, A.D., Goatman, K.A., Philip, S., Olson, J.a., Sharp, P.F.: Automatic detection of retinal anatomy to assist diabetic retinopathy screening. Physics in medicine and biology52(2) (2007) 331–45
10. Decenci`ere, E., Zhang, X., Cazuguel, G., Lay, B., Cochener, B., Trone, C., Gain, P., Ordonez, R., Massin, P., Erginay, A., Charton, B., Klein, J.C.: Feedback on a publicly distributed image database: the Messidor database. Image Analysis & Stereology33(2014) 231–234
11. Cohen, J.: Weighed kappa: Nominal scale agreement with provision for scaled disagreement or partial credit. Psychological Bulletin70(4) (1968) 213–220 12. Mookiah, M., Acharya, U.R., Martis, R.J., Chua, C.K., Lim, C., Ng, E., Laude,
A.: Evolutionary algorithm based classifier parameter tuning for automatic dia-betic retinopathy grading: A hybrid feature extraction approach. Knowledge-Based Systems39(2013) 9–22
13. Acharya, U.R., Ng, E.Y.K., Tan, J.H., Sree, S.V., Ng, K.H.: An integrated index for the identification of diabetic retinopathy stages using texture parameters. Journal of Medical Systems36(3) (2012) 2011–2020
![Table 3: Classification accuracy and agreement between Messidor reference, human experts [5] and the automatic grading system (AGS)](https://thumb-us.123doks.com/thumbv2/123dok_us/1285629.2672578/6.892.240.656.478.646/classification-accuracy-agreement-messidor-reference-experts-automatic-grading.webp)
