Pepperdine University
Pepperdine Digital Commons
Pepperdine Market Pulse Report
10-1-2013
2013 Q3 Market Pulse Report
Craig R. Everett
Pepperdine University
Follow this and additional works at:
http://digitalcommons.pepperdine.edu/gsbm_pcm_pmp
Part of the
Corporate Finance Commons
,
Entrepreneurial and Small Business Operations
Commons
, and the
Finance and Financial Management Commons
This Article is brought to you for free and open access by Pepperdine Digital Commons. It has been accepted for inclusion in Pepperdine Market Pulse Report by an authorized administrator of Pepperdine Digital Commons. For more information, please [email protected].
Recommended Citation
Everett, Craig R.,"2013 Q3 Market Pulse Report" (2013). Pepperdine University Private Capital Markets Project. http://digitalcommons.pepperdine.edu/gsbm_pcm_pmp/10
INTERNATIONAL BUSINESS BROKERS ASSOCIATION | M&A SOURCE | PEPPERDINE PRIVATE CAPITAL MARKETS PROJECT
MARKET
PULSE
Q U A R T E R LY S U R V E Y R E P O R T
T H I R D Q U A R T E R 2 0 1 3
PRIVATE CAPITAL
MARKETS PROJECT
P E P P E R D I N ET
he International Business Broker Association (IBBA)and M&A Source present the Market Pulse
Quarterly Survey Report with the support of the
Pepperdine Private Capital Markets Project and the Graziadio School of Business and Management at
Pepperdine University. The quarterly IBBA and M&A Source
Market Pulse survey was created to gain an accurate
understanding of the market conditions for businesses being sold in the Main Street market (values $0 to $2 million) and lower middle market (values $2 million to $50 million). The national survey was conducted with the intent of providing a valuable resource to business owners and their advisors.
MARKET SEGMENTS STUDIED Figure 1
MAIN STREET LOWERMIDDLE MARKET
< 500K $2MM-$5MM
$500K-$1MM $5MM-$50MM
MARKETPULSE | THIRD QUARTER 2013 | 2
KEY FINDINGS
The Market Pulse Third Quarter 2013 survey was completed by 192 respondents from 38 states. The majority of respondents (57%) had at least 10 years of experience as a business broker and/or M&A advisor.
BUYER AND SELLER MARKETS
When it comes to leverage, the market is polarizing. In the third quarter, 72 percent of Main Street brokers represent-ing deals of $500,000 or less said they were operatrepresent-ing in a buyer’s market. Meanwhile 79 percent of brokers
representing deals of $5 million-$50 million categorized the current climate as a seller’s market. This is the strongest seller’s market sentiment we’ve seen in the lower middle market since the survey started.
Figure 2: Buyer verses Seller Markets
Q3 2013
Q2 2013
MAIN STREET
Buyer Seller Buyer SellerLess than 500K 72% 28% 68% 32%
$500K - $1MM 64% 36% 52% 48%
$1MM - $2MM 57% 43% 50% 50%
LOWER MIDDLE MARKET
$2MM - $5MM 40% 60% 47% 53%
$5MM-$50MM 21% 79% 32% 68%
RETIREMENT DRIVING SALES
In every segment, retirement was the number one reason sellers put their business on the market. This would indicate that baby boomers are continuing to move into the market in larger numbers.
This finding is consistent with predictions that more business owners will look to sell their companies in the coming year. In every market segment, 50 percent or more of advisors predict deal volume will grow in the next three months, slightly higher than those predicting deal volume will stay the same. Less than 7 percent of advisors expect deals to decrease.
BUYING: A BETTER INVESTMENT
Buyers believe business acquisition is a good way to put their money to use. In the lower middle market, “better ROI than other investments” ranked first or tied for first as the reason buyers are active in the M&A market.
“Buyers in the lower middle market continue to gain confidence in the economy and in their ability to grow a
business,” says Dr. Craig Everett, an assistant professor of finance at the Graziadio School of Business and Management and director of the Pepperdine Private Capital Markets Project. “They believe that buying a business is the best way to put their money to work, versus starting an operation from the ground-up or other investment opportunities.” For Main Street buyers, the number one motivating factor was to buy a job and control their own destiny.
“When we look at the factors driving buyers and sellers into market, we can begin to understand why the market is polarizing,” said IBBA director Scott Bushkie, president of Cornerstone Business Services. “An increase in Boomer retirement should be creating more of a buyer’s market scenario in which supply outpaces demand.”
“But lower middle market buyers believe business acquisition provides the greatest opportunity for investment returns. So despite the higher rate of retirement across every sector, demand remains high and sellers still have the advantage for higher value deals.”
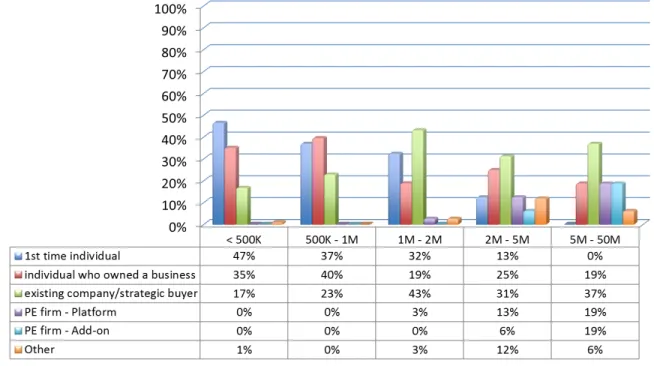
BUYER TYPES
Private equity firms jumped up this quarter to tie existing companies as the number one buyer for businesses over $5 million in value. Private equity acquisitions were divided equally as 50 percent platform deals and 50 percent add-ons. As in second quarter 2013, individual buyers dominated Main Street.
“We didn’t see substantial private equity activity until deals exceeded $5 million in value. One possible explanation is that PE groups have a lot of money they need to put to work and they’re targeting larger deals for efficiency’s sake,” says M&A Source chair Dora Lanza, Principal, Plethora Businesses. “That’s opening opportunities for smaller companies in the $2 million to $5 million sector—companies that might not be as competitive bidding against a PE firm.”
Figure 3: Top Buyer Types
VALUATION MULTIPLES
Multiples are markedly stronger in the lower middle market, correlating to a strong seller’s market sentiment and the presence of private equity firms in the buyer pool, as well existing companies poised for growth through acquisition.
Figure 4: Average Multiples by Deal Size
SDE
EBITDA
SDE = Seller’s Discretionary Earnings
EBITDA = Earnings Before Interest, Taxes, Depreciation And Amortization
Transactions in the Main Street market are typically based on multiples of SDE, while those in the lower middle market are most commonly based on EBITDA.
MAIN STREET
Less than 500K 2.0 $500K - $1MM 2.75
$1MM - $2MM 3.0
LOWER MIDDLE MARKET
$2MM - $5MM 4.3
MARKETPULSE | THIRD QUARTER 2013 | 4 Most advisors think valuations will stay the same or grow in the next three months. In the lower middle market, less than two percent of advisors believe valuations are going to decline. The majority believe they will stay the same, with 20 to 25 percent expecting they will continue to grow from current peak. As the deals get larger there is greater confidence that values will continue to increase.
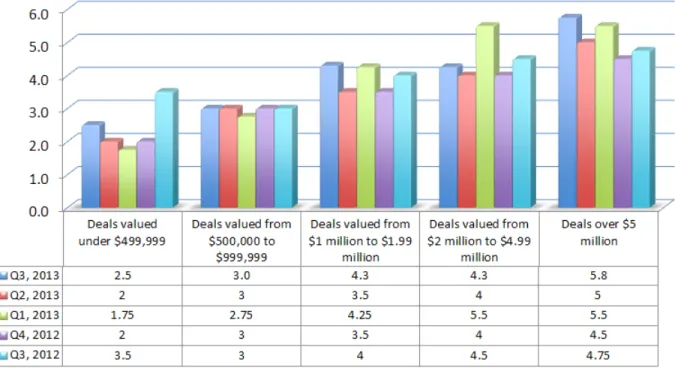
Figure 5: Average Multiples by Deal Size By Quarter
Multiples were up (or tied) in every market sector over second quarter 2013. In three out of five sectors, median multiples were at a high, or tied for high, over the previous year.
“The M&A market continues to move in the right direction,” says Tom Whipple, Principal, Falcon Advisors. “Even though our study shows more sellers are coming into the market, values are maintaining. Three out of five market sectors have continued to peak. One can assume there are still far more buyers chasing deals than the number of opportunities on the marketplace.”
TIME TO CLOSE
The third quarter 2013 study continues to confirm earlier findings that larger businesses take longer to close. In the smallest Main Street sector (businesses valued at $500,000 or less), the median time to close was four months. In the lower middle market, for businesses valued over $5 million, the median time to close was 10 months.
Figure 6: Median Time To Close
MAIN STREET
Less than 500K 4 months $500K - $1MM 5 months
$1MM - $2MM 7 months
LOWER MIDDLE MARKET
$2MM - $5MM 7 months $5MM - $50MM 10 months
BUYER LOCATION
In the same way that larger deals take more time to close, they are also more likely to draw buyers from farther away. In third quarter 2013, 75 percent of the buyers for deals valued over $5 million came from outside a 100 mile radius of the seller’s location. For Main Street deals, 40 percent or more of buyers came from within a 20 mile radius.
Figure 7: Buyer Location
Within Designated Radius
MAIN STREET
Less than 500K 20 miles—55% $500K - $1MM 20 miles—40%
$1MM - $2MM 20 miles—46%
LOWER MIDDLE MARKET
$2MM - $5MM 50 miles—38% $5MM-$50MM >100 miles—75%
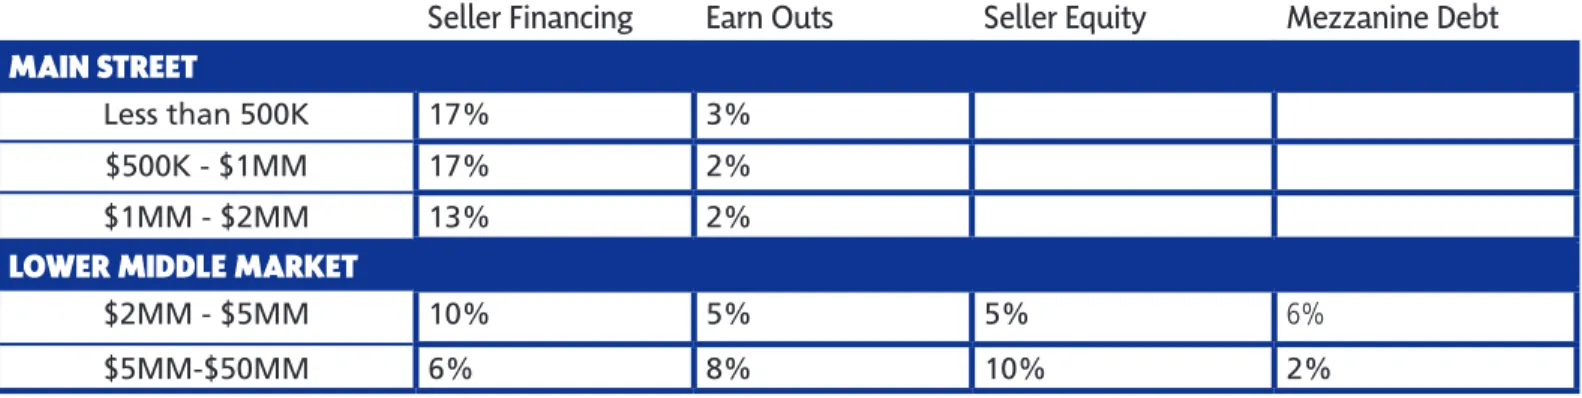
DEAL STRUCTURE
As the deals get larger, seller financing declines but earn outs increase. Once deal size reaches $2 million and higher, seller retained equity and mezzanine debt comes into debt.
Figure 8: Creative Deal Structures
Seller Financing
Earn Outs
Seller Equity
Mezzanine Debt
MAIN STREET
Less than 500K 17% 3%
$500K - $1MM 17% 2%
$1MM - $2MM 13% 2%
LOWER MIDDLE MARKET
$2MM - $5MM 10% 5% 5% 6%
$5MM-$50MM 6% 8% 10% 2%
MISTAKES AND TERMINATIONS
According to the study, the primary reason for deal termination remains unrealistic expectations, across every market sector. This includes unrealistic valuations or unreasonable non-price demands.
“Unrealistic expectations, non-price, trended higher than past surveys,” said IBBA chair, Steve Wain, Principal, Calder Associates. “With valuations peaking in most categories, one could assume that the gap between buyer and seller price points would be shrinking, but we could be seeing seller expecting all cash at close or abbreviated transition time frames.”
Advisors representing Main Street business owners also reported significant issues with seller misrepresentation and poor seller preparation, ranking second and third for the most common reason deals failed to close. “Which really does highlight the need and value to work with an advisor and truly prepare one’s business for sale, “said Marcie Woolworth, Principal, MRW & Associates.
Lack of buyer preparation, personality conflicts, and minimal corporate structure all rank lower as reasons deals were terminated in the last three months.
MARKETPULSE | THIRD QUARTER 2013 | 6
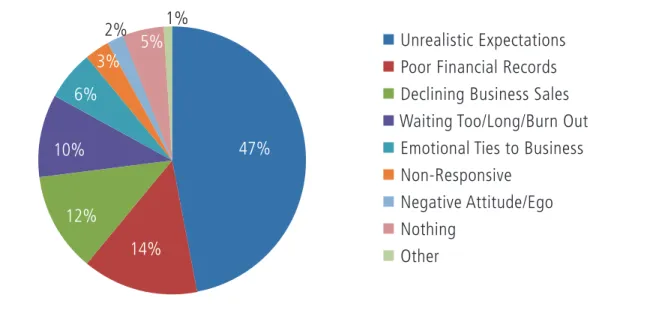
A similar question asked advisors to rank the biggest mistakes seller’s make when selling their business. Results are relatively consistent with the reasons for deal termination.
Figure 9: Biggest Seller Mistakes
HOT INDUSTRIES
Personal services, restaurants , business services, and consumer goods/retail ranked among the most active industries for the Main Street market. The construction/engineering and healthcare industries were also active. These figures are fairly consistent over second quarter 2103, although restaurant sales saw more activity this quarter.
In the lower middle market, for businesses valued between $2 million to $5 million, healthcare-related businesses led at 25 percent of completed deals over the last three months, followed by manufacturing and wholesale/distribution at 19 percent each. Manufacturing led the $5 million—$50 million sector at 31 percent, followed by wholesale/ distribution at 13 percent.
47+14+12+10+
6
+
3
+
2
+
5+
1
n
Unrealistic Expectations
n
Poor Financial Records
n
Declining Business Sales
n
Waiting Too/Long/Burn Out
n
Emotional Ties to Business
n
Non-Responsive
n
Negative Attitude/Ego
n
Nothing
n
Other
47%
14%
12%
10%
6%
3%
5%
2%
1%
A full copy of the IBBA and M&A Source Market Pulse Survey is available to IBBA and M&A Source members who participate in each quarterly survey. This is a 70-plus page report of up-to-date relevant information on the state of the marketplace and compiled by the Pepperdine Private Capital Markets Project under Dr. Craig Everett, an assistant professor of finance at Pepperdine University’s Graziadio School of Business and Management.
To become a member, please contact the IBBA and M&A Source headquarters at [email protected] or (888) 686-4222.
INTERNATIONAL BUSINESS BROKERS ASSOCIATION
3525 Piedmont Road Building 5, Suite 300 Atlanta, GA 30305 USA
www.ibba.org
Scott Bushkie, CBI, M&AMI
Director
George Lanza, CBI, M&AMI, CSBA, MEA
Chairman
M&A SOURCE
3525 Piedmont Road Building Five, Suite 300 Atlanta, GA 30305 USA
www.masource.org
Karl Kirsch
Executive Director
Kevin Dempsey, CBI, CMC, CMEA
Chairman
PEPPERDINE PRIVATE CAPITAL MARKETS PROJECT
Graziadio School of Business and Management Pepperdine University 6100 Center Drive Los Angeles, CA 90045 http://bschool.pepperdine.edu/privatecapital Craig R. Everett, Ph.D. Director Irina Shaykhutdinova Research Associate Linda A. Livingstone, Ph.D. Dean
MARKETPULSE | THIRD QUARTER 2013 | 8
PRIVATE CAPITAL
MARKETS PROJECT
bschool.pepperdine.edu/privatecapital P E P P E R D I N E ®© 2012 -2013. All Rights Reserved
MARKETPULSE