Regular Article
Assessment of genetic diversity among India Ginseng,
Withania somnifera
(L) Dunal using RAPD and ISSR markers
Shahana Khan*and Rehana Anjum Shah
Department of Botany, The Institute of Science, 15, Madame Cama Road Mumbai- 4000 32. Corresponding author email: shahrehanaa@yahoo.com
Withania somnifera is commonly known as Indian Ginseng or Ashwagandha which is listed highly medicinal plant in Ayurveda for its wide range of medicinal use. Genetic diversity among 16 genotypes of Withania somnifera collected from four different regions viz. Lucknow, Nimuch, Karnataka and Mumbai was studied using RAPD and ISSR techniques. The ISSR and RAPD together produced 89 bands across 16 genotypes of W. somnifera of which 39 were polymorphic showing 47.89% polymorphism. Over 99% of the RAPD and ISSR fragments were reproducible in the present experiment. There was 90% uniformity within the population. The neighbor joining tree also confirmed a clear grouping and differentiation based on populations of origin i.e. samples were grouped on the basis of their regions of origin. The dendrogram reveals that outgroup of W. somnifera Karnataka origin are evolutionarily related to W. somnifera Nimuch group varieties and W. somnifera Lucknow and Mumbai group varieties are evolutionarily closely related. Within population analysis of Lucknow and Nimuch location showed two sub groups of two lines each showing slight diversity. Plants from Karnataka and Mumbai region show less diversity within population.
Key Words Withania somnifera, genetic diversity, RAPD, ISSR, polymorphism Introduction
Genetic diversity studies can identify alleles that might affect the ability of the organism to survive in its existing habitat, or might enable it to survive in more diverse habitats. This knowledge is valuable for germplasm conservation, individual, population, variety or breed identification (Duran et al., 2009). Various types of markers such as morphological, chromosomal, biochemical and molecular markers are used for this purpose (Anurag
et al., 2008).
Indian Ginseng or Ashwagandha (Withania somnifera (L) Dunal) is a highly valued medicinal plant in Ayurveda, used either singly or in combination with other herbs. Plants growing under different agro-climatic condition often show qualitative and quantitative variations in their
phytoconstituents. There are five primary chemotypes in W. somnifera which originate from different areas and are categorized as Form I to Form V. Form I is cultivated in Madhya Pradesh and is the primary source of commercial material in India. Form II originates from sandy deserts of Rajasthan, Form III grows in Chandigarh and other mountainous area of Punjab, Form IV grows near Delhi and Form V grows near Delhi and Ahmedabad. Various agro climatic conditions also influence the phytoconstituents. In India, it grows wild in Madhya Pradesh, Uttar Pradesh Andhra Pradesh, Gujarat, Maharashtra, Rajasthan and Punjab extending to the mountainous regions of Himachal Pradesh and Jammu up to an elevation of 1500m (Singh and Kumar, 1998). The primary constituents of interest in W. somnifera are alkaloids and
2
steroidal lactones the latter of which are known as withanolides. Some of the major constituents include Withanolide A, Withanone and Withaferin A. W. somnifera
displays a appreciable spectrum of morphological and phytochemical variability (Kumar et al., 2007). Several withanolides are identified in W. somnifera
including withanolides A-Y (Tripathi et al.,
1996). There are as many as 40 similar structures synonymously identified in the literature as Withaferin-A (Kapoor, 1990).
In view of the great demand in phyto- pharmaceutical industries, commercial cultivation of W. somnifera is carried out in the country over an area of about 4000 ha, mainly in Manasa, Madhya Pradesh and in some parts of Rajasthan and Andhra Pradesh. Despite its commercial value, there is a paucity of improved varieties of Withania somnifera and crop improvement studies need to be taken up vigorously (Atal and Schwarting, 1962). For genetic amelioration and effective conservation of the allelic and genotypic variability in a given species, it is imperative to evaluate and catalogue the existing variability. Genetic variability forms the basis for crop improvement and variety development. Precise cataloguing and characterization of wild genetic resources of this species by molecular DNA markers is therefore urgently required (Negi et al., 2006). In spite of being one of the major medicinal plants in the world, it has received very little attention from geneticists, cytogeneticists and molecular biologists. Systematic morphochemical and molecular characterization of W. somnifera
germplasm is required for future programmes of quality improvement.
Characterization of plants with the use of molecular markers is an ideal approach for conservation of plant genetic resources and genetic improvement (Rout and Moha- patra, 2006). Molecular markers not only provide a useful method for characterization of cultivars but they also depict genetic relatedness, authentication of quality plant material, detection of
adulteration and protection of intellectual property right issues (Joshi et al., 2004). Inter simple sequence repeats (ISSRs) and random amplified polymorphic DNA (RAPD) are ideal markers for population studies because of their abundance and high degree of polymorphism between individuals within a population of closely related genotypes (Agrawal et al., 2008).
In the present study, analysis of genetic diversity of Withania somnifera seed collected from different climatic regions of India has been carried out using ISSR and RAPD technique.
Materials and methods
Plant material and Genomic DNA Isolation
Seeds of Withania somnifera plants growing in Lucknow, Nimuch, Karnataka and Mumbai were collected from CIMAP, Ramchandra Ramkuwar Ashwagandha Ayurvedic Crude Drugs and species suppliers, Kalasapur village and KET’s SRC green house respectively. Seeds were allowed to germinate in respective soil collected from the source material in earthen pot at KET’s Scientific Research Centre green house. Tissue for DNA extraction was collected from around fifteen days young seedlings, freezed to -20oC immediately after collection. Total 16 samples showing good quality and quantity of DNA were used for further analysis (Table 1).Total genomic DNA was isolated from young and fresh whole plant growing in green house using CTAB method (Doyle and Doyle, 1990).
Quantification of DNA
Quantity and quality of extracted DNA was checked and Estimated on 0.8% agarose gel stained using Ethidium bromide. The concentration of DNA was determined with a UV-visible light spectrophotometer (UVS 2700, Labomed, USA), and the DNA samples were diluted to 5 µg/µl and used as templates for PCR amplification.
3
Table 1. List of samples used for diversity analysis.
Table 2. List of primers used for genetic diversity analysis of W. somnifera.
Marker
Type Primers used Primer sequence (5’→3’) bands Total Polymorphic bands P(%) PIC Diversity Gene RAPD OPA15OPB10 TTCCGAACCCCTGCTGGCAC 108 5 3 62.5 30 0.6051 0.5547 0.66 0.63
OPK16 GAGCGTCGAA 12 8 66.66 0.5547 0.63
ISSR
UBC 807 AGAGAGAGAGAGAGAGT 6 2 33.33 0.5547 0.63 UBC 808 AGAGAGAGAGAGAGAGC 11 6 54.54 0.7456 0.78 UBC 835 AGAGAGAGAGAGAGAGYC 12 5 41.66 0.7031 0.75 UBC 859 TGTGTGTGTGTGTGTGRC 10 5 50 0.5547 0.63 UBC 888 BDBCACACACACACACA 9 4 44.44 0.5547 0.63
Mean 9.75 4.75 47.8912 0.6034 0.67
RAPD marker amplification
Five arbitrary decamer primers used in this study were synthesized by Eurofins based on sequences from Operon Technologies, Alameda, CA, USA (Table 2). PCR amplifications were performed in 15 μl volumes, using a VERITI 96 well thermal cycler (Applied Biosystems, USA). The reaction mixtures contained 10mM Tris-HCl, pH 8.3, 50mM KCl, 10-20 ng genomic DNA, 10 pmol primer, 1.5 mM MgCl2, 150 μM of each dNTP (Invitrogen by Life technologies, USA), and 1U Taq DNA polymerase (Bangalore Genie). The temperature profile consisted of an initial denaturation step at 94°C for 4 min, followed by 40 cycles: 94°C for 1 min, 38°C for 1 min, and 72°C for 2 min. After the final cycle, samples were incubated at 72°C for 8 min to ensure complete extension and then stored at 4°C. The PCR products were separated on 1.5% agarose gel in 1X TBE buffer (Tris-borate-ethylene di-amine tetra acetic acid). The size of amplified DNA fragments was estimated with 100bp ladders (In vitrogen, USA). The gels were visualized under UV using
ALPHAIMAGER EC gel documentation system (Alpha Inotech Corporation, India). ISSR marker amplification
Primers for ISSR analysis were synthesized by Eurofins based on sequences from the Biotechnology Laboratory, University of British Columbia (UBC) (Table 2). Fifteen ISSR primers were used for the initial testing of variability and reproducibility test. Five primers were selected based on polymorphism level within and among the population and reproducibility were screened three times and band scored for diversity analysis. The reaction mixtures contained 10 mM Tris-HCl, pH 8.3, 50 mM KCl, 20 ng genomic DNA, 10 mol primer, 1.5mM MgCl2, 100 μM of each dNTP, and 1 U Taq DNA polymerase (Bangalore Genie). The temperature profile consisted of an initial denaturation step at 94°C for 4 min, followed by 40 cycles: 94°C for 1 min, 50°C for 1 min, and 72°C for 2 min. After the final cycle, samples were incubated at 72°C for 8 min to ensure complete extension and then stored at 4°C. The amplified DNA 1. Lucknow 1: L1 2. Lucknow 2: L2 3. Lucknow 3: L3 4. Lucknow 4: L4 5. Nimuch 1: N1 6. Nimuch 2: N2 7. Nimuch 3: N3 8. Nimuch 4: N4 9. Karnataka 1: K1 10. Karnataka 2: K2 11. Karnataka 3: K3 12. Karnataka 4: K4 13. Mumbai 1: M1 14. Mumbai 2: M2 15. Mumbai 3: M3 16. Mumbai 4: M4
4
fragments were separated by electrophoresis on 1.5% agarose gel in 1X TBE buffer (Tris- borate-ethylene di-amine tetra acetic acid). The molecular weight of amplified DNA fragments was estimated with 100bp ladders (In vitrogen, USA). The gels were visualized under UV using gel documentation system ALPHAIMAGER EC gel documentation system (Alpha Inotech corporation, India).
Data analysis
DNA fingerprints of informative ISSR and RAPD markers which were reproducible in two independent amplifications were scored for the presence (1) or absence (0) of bands of various molecular weight sizes in the form of a binary matrix. Pair-wise similarity matrices were generated by Jaccard’s coefficient of similarity (Jaccard, 1908) using Free Tree program version 0.9.1.50. Jaccard’s similarity coefficient is calculated with the formula: Sij = a/ a + b +c using software programs. Where ‘a’ is the total number of bands shared between individuals i and j, ‘b’ is the total number of bands presents in individual i but not in individual j and ‘c’ is the total number of bands present in individual j but not in individual i.
Unweighted pair group method with arithmetic average (UPGMA) cluster analysis of the Jaccard’s similarity co-efficient generated a dendrogram (Table 3, Fig. 4) which illustrated the overall genetic relationship among the genotypes surveyed. The pair wise comparison of banding patterns was evaluated by Nei’s (1978) genetic distance using the Free-Tree-Free ware programme (Pavlicek et al., 1999). The Phylogenetic tree was constructed with help of tree view software. Statistical stability of the branches in the dendrogram was established by bootstrap analysis with 100 replicates using Free Tree program version 0.9.1.50. Tree View (Page, 1996) software was used for visualization of the dendrogram.
The binary data was also used to calculate Basic statistics using the genetic
analysis package Power Marker, ver. 3.23 (Liu and Muse, 2005) for diversity measurements at each microsatellite locus, including the total number of alleles (NA), allele frequency, major allele (allele with the highest frequency), accession-specific alleles, gene diversity (GD), and polymorphism information content (PIC) (Table 2). Marker index was calculated to know the capacity of each primer to detect polymorphic loci among the genotypes. It is the sum total of the polymorphism information content (PIC) values of all the markers produced by a particular primer. PIC value was calculated using the formula PIC = 1-Σpi2,where pi is the frequency of the i allele (Smith et al., 1997).
Results and Discussion
Quality and quantity of DNA isolated using CTAB method was checked and estimated on 0.8% agarose gel stained using Ethidium bromide (Fig. 1). The DNA samples were diluted to 5 ng/μl and used as templates for PCR amplification.
Fig.1. Estimation of DNA Quality and quantity on 0.8% Agarose gel. RAPD band pattern
PCR amplification of DNA, using five primers for RAPD analysis, produced 41 DNA fragments that could be scored in all genotypes. The number of amplified fragment varied from three (OPC03) to
5
twelve (OPK 16), which varied in size from 300 to 3000 bp. Of the 41 amplified bands, 15 were polymorphic, with an average of 3 polymorphic bands per primer. Percent polymorphism ranged from 0 (OPC03 and OPK01) to 66 (OPK16), with an average percentage polymorphism of 29.33. The PIC
values varied from 0.55 (OPB 10 and OPK 16) to 0.60 (OPA15), with an average of 0.56, while average expected gene diversity ranged from 0.62 (OPB 10 and OPK 16) to 0.65 (OPA15) across all the genotypes of W. somnifera (Fig. 2a and 2b).
Fig. 2a. The RAPD profile of 16 Withania somnifera genotypes produced with primer OPK16 (lane M is a 100 bp ladder) and lanes 1 to 16 represent different Withania somnifera genotypes.
Fig. 2b. The RAPD profile of 16 Withania somnifera genotypes produced with primer OPA15 (lane M is a 100 bp ladder) and lanes 1 to 16 represent different Withania somnifera genotypes. ISSR band pattern
Fifteen ISSR oligonucleotides (Table 2) were used for amplification of all the 16 genotypes. Out of 15 primers used for initial screening 8 primers showed polymorphic profile. Out of these eight primers, five primers showing clear differentiable and reproducible banding pattern were used for final scoring. UBC 859 primer revealed polymorphism among
the genotypes (Fig. 3). ISSR primers produced different numbers of DNA fragments, depending on their simple sequence repeat motifs. These five primers produced 48 bands across 16 genotypes, of which 24 were polymorphic, giving 50% polymorphism. The number of bands in informative primers ranged from 6 (UBC 807) to 12 (UBC 835) and varied in size from 250 to 15,000 bp. Average number of
6
bands and polymorphic bands per primer were 9.66 and 4.8 respectively. Percentage polymorphism ranged from 0 (UBC 814, UBC 818, UBC 840, UBC 841, UBC 844, UBC 845, UBC848) to 72 (UBC 808), with an average of 50% polymorphism. The PIC values varied from 0.55 (UBC 806, UBC 859,
UBC 8888, OPB 10 and OPK 16) to 0.74 (UBC 808). With an average of 0.64, while average expected gene diversity ranged from 0.62 (UBC 807, UBC 859, UBC 888, OPB 10 and OPK 16) to 0.78 (UBC 808) across all the genotypes of Withania somnifera.
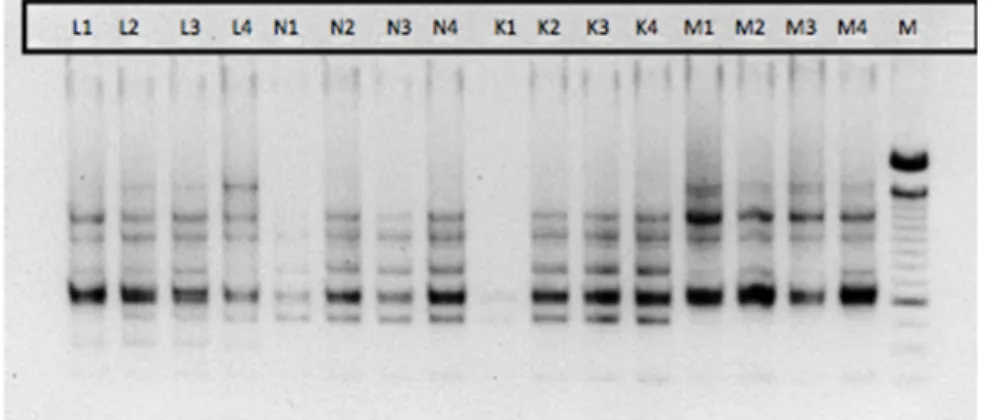
Fig. 3. The ISSR profile of 16 Withania somnifera genotypes produced with primer UBC 859 (lane M is a 100 bp ladder and lanes 1 to 16 represent different Withania somnifera genotypes.). Where L - Lucknow, N - Nimuch, K – Karnataka and M – Mumbai.
7
Table 3. Jaccard’s similarity coefficient Matrix of 16 genotypes of W. somnifera.
Lucknow1 Lucknow2 Lucknow3 Lucknow4 Nimuch1 Nimuch2 Nimuch3 Nimuch4 Karnataka1 Karnataka2 Karnataka3 Karnataka4 Mumbai1 Mumbai2 Mumbai3 Mumbai4 Lucknow1 0.00813 0.00813 0.00813 0.21951 0.20968 0.20968 0.21951 0.19685 0.19685 0.19685 0.19685 0.15 0.15 0.15 0.15 Lucknow2 0.00813 0 0.01639 0.21311 0.20325 0.20325 0.21311 0.19048 0.19048 0.19048 0.19048 0.15966 0.15966 0.15966 0.15966 Lucknow3 0.00813 0 0.01639 0.21311 0.20325 0.20325 0.21311 0.19048 0.19048 0.19048 0.19048 0.15966 0.15966 0.15966 0.15966 Lucknow4 0.00813 0.01639 0.01639 0.22951 0.21951 0.21951 0.22951 0.20635 0.20635 0.20635 0.20635 0.14286 0.14286 0.14286 0.14286 Nimuch 1 0.21951 0.21311 0.21311 0.22951 0.00813 0.00813 0 0.03175 0.03175 0.03175 0.03175 0.27731 0.27731 0.27731 0.27731 Nimuch 2 0.20968 0.20325 0.20325 0.21951 0.00813 0 0.00813 0.02362 0.02362 0.02362 0.02362 0.26667 0.26667 0.26667 0.26667 Nimuch 3 0.20968 0.20325 0.20325 0.21951 0.00813 0 0.00813 0.02362 0.02362 0.02362 0.02362 0.26667 0.26667 0.26667 0.26667 Nimuch 4 0.21951 0.21311 0.21311 0.22951 0 0.00813 0.00813 0.03175 0.03175 0.03175 0.03175 0.27731 0.27731 0.27731 0.27731 Karnataka1 0.19685 0.19048 0.19048 0.20635 0.03175 0.02362 0.02362 0.03175 0 0 0 0.25203 0.25203 0.25203 0.25203 Karnataka2 0.19685 0.19048 0.19048 0.20635 0.03175 0.02362 0.02362 0.03175 0 0 0 0.25203 0.25203 0.25203 0.25203 Karnataka3 0.19685 0.19048 0.19048 0.20635 0.03175 0.02362 0.02362 0.03175 0 0 0 0.25203 0.25203 0.25203 0.25203 Karnataka4 0.19685 0.19048 0.19048 0.20635 0.03175 0.02362 0.02362 0.03175 0 0 0 0.25203 0.25203 0.25203 0.25203 Mumbai 1 0.15 0.15966 0.15966 0.14286 0.27731 0.26667 0.26667 0.27731 0.25203 0.25203 0.25203 0.25203 0 0 0 Mumbai 2 0.15 0.15966 0.15966 0.14286 0.27731 0.26667 0.26667 0.27731 0.25203 0.25203 0.25203 0.25203 0 0 0 Mumbai 3 0.15 0.15966 0.15966 0.14286 0.27731 0.26667 0.26667 0.27731 0.25203 0.25203 0.25203 0.25203 0 0 0 Mumbai 4 0.15 0.15966 0.15966 0.14286 0.27731 0.26667 0.26667 0.27731 0.25203 0.25203 0.25203 0.25203 0 0 0
8
Data analysis
The ISSR and RAPD together produced 89 bands across 16 genotypes of
W. somnifera of which 39 were polymorphic showing 47.89% polymorphism. Over 99% of the RAPD and ISSR fragments were reproducible in the present experiment. The high reproducibility of ISSR markers may be due to the use of selective primers reported to be informative in one or more plant species in previous reports. To study the distribution of genetic variation in the populations, Nei’s (1973) gene diversity statistics was used. The results indicate that most of the variation is found among populations. There was 90% uniformity within the population. The neighbor joining tree also confirm a clear grouping and differentiation based on populations of origin i.e. samples were grouped on the basis of their regions of origin. From tree (Fig. 4), it is concluded that out group of W. somnifera Karnataka origin are evolutionarily related to W. somnifera
Nimuch group varieties while W. somnifera
Lucknow and Mumbai group varieties are evolutionarily closely related. Within population analysis of Lucknow and Nimuch location showed two sub groups of two lines each showing slight diversity within population. Plants from Karnataka and Mumbai region show less diversity within population.
Discussion
Plants collected from Nimuch and Karnataka in the sub show more than 99% similarity even though they are collected from places far apart. Similarly Genotypes collected from Mumbai were more similar to Lucknow genotype. High similarity values indicate genotypic similarity. Even earlier, genetic similarity of genotypes collected from disjunct geographical regions has been reported (Jain et al., 1994). In the present studies, all the cultivated genotypes collected from different geographical regions of the country showed close resemblance and were grouped into a single subpopulation. Same has been
reported by Mir et al., (2011). The probable reason could be the self-pollinating nature of the species. In spite of close resemblance in the tested line in above analysis, we could easily identify region specific polymorphic bands (Presence of UBC 835680 for Karnataka; UBC8591500 for Mumbai; UBC859400 for Lucknow; and absence of UBC 835390 and UBC 808720 in Plants from Nimuch) which could be of great help for the taxonomist to identify and mark the origin of line. There had been no reports of mechanical or manual mixing of genotypes so far indicating conserved population in all four regions. We have shown above that the use of ISSR and RAPD based fingerprinting is an appropriate method to determine the genetic diversity and relationship between the different accessions.
In fact, better understanding of the distribution of genetic variation at the intraspecific level is important for the identification of superior genotype(s) for cultivar improvement and to devise strategies for in situ and ex situ conservation (Bhutta et al., 2006; Basha and Sujatha, 2007). ISSR markers provide higher relative information as compared to RAPD (Nagaoka and Ogihara, 1997). Likewise, during the present investigation ISSR markers proved to be the better choice for evaluation of diversity level and assessing the genetic relationships among Withania somnifera germplasm with utmost accuracy. Never the less, the two marker systems provided almost comparable descriptions of diversity independent of geographical origin. In addition, low and significant correlation detected between genetic matrices allowed the efficacy and the utility of these two marker systems.
These studies also suggest that there is an extreme degree of variability with respect to growth habit and morphological characteristics among W. somnifera
accessions found in different parts of India (Atal and Schwarting, 1962; Anonymous, 1976). This variability has been endorsed by the higher PIC values (ISSR 0.421 and
9
RAPD 0.383), percent polymorphism (ISSR 81% and RAPD 69%) and clustering. In conformity, Dharmar and De Britto, (2011) also found higher percentage (83.78%) of polymorphism among W. somnifera
accessions collected from different geographical areas. ISSR markers proved to be marginally more informative than RAPD in the assessment of genetic diversity of W. somnifera.
Conclusion
This study provides evidence that RAPD and ISSR polymorphisms could be used as efficient tools for the detection of similarities and phylogenetic relationships in W. somnifera. The RAPD and ISSR techniques can also be useful for authentication of specific accessions/ genotypes of W. somnifera. The information obtained here could be valuable for devising strategies for conservation and management of this species.
Acknowledgments Authors are
thankful to University Grant Commission (UGC), Government of India, New Delhi, for awarding Maulana Azad National Fellowship and we also thank Dr. Neeta Madan and Dr. Moinuddin Vakil, KET’s Scientific Research Centre, Mumbai for their support and help.
References
Agarwal M, Shrivastava N, Padh H. 2008. Advances in molecular marker techniques and their applications in plant science. Plant Cell Rep. 27: 617-631. Anonymous. 1976. The Wealth of India, Raw Materials (Vol X), Sp W. Publications and Information Directorate, CSIR, New Delhi. 581-585. Anurag B, Sangwan ML, Sudhir K, Sonika
A. 2008. Genetic diversity between Murrah and Bhadawari Breeds of Indian buffalo using RAPD- PCR. Ind. J. Biotech. 7:491-495.
Atal CK, Schwarting AE. 1962. Intraspecific variability in Withania somnifera- A prelim survey. Llyodia (Cincinnatti). 25:
78-87.
Basha SD, Sujatha EM. 2007. Inter and intra-population variability of Jatropha curcas (L.) characterized by RAPD and ISSR markers and development of population specific SCAR markers. Euphytica. 156: 375-386.
Bhutta WM, Aktar J, Ibrahim M, Shahjad A. 2006. Genetic variation between Pakistani Wheat (Triticum aestivam) genotypes as revealed by RAPD markers. S.Afr. J. Bot. 72: 280-283. Dharmar K, John de Britto A. 2011. RAPD
analysis of genetic variability in wild populations of Withania somnifera (L.) Dunal. Int. J. Biolog Tech. 2: 21-25. Doyle JJ, Doyle JL. 1990. Isolation of plant
DNA from fresh tissues. Focus. 12: 13-15. Duran CN, Appleby T, Clark D, Wood M, Batley IJ, Edwards D. 2009. AutoSNPdb: an annotated single nucleotide polymorphism database for crop plants. Nucl. Acids Res. 37: D951–953.
Jaccard P. 1908. Nouvelles rescherches Sur la distribution florale. Bull. Soc. Vaud. Sci. Nat. 44: 223-270.
Jain AK, Kheshgi HS, Wuebbles DJ. 1994. Integrated Science Model for Assessment of Climate Change Model. presented at and published in the proceedings of Air and Waste Management Association’s 87th Annual Meeting, Cincinnati, Ohio, June 19-24. Joshi K, Chavan P, Warude D, Patwardhan
B. 2004. Molecular markers in herbal drug technology. Curr. Sci. 87: 159-165. Kapoor LD. 1990. CRC Handbook of Ayur
Med Plants, Boca Raton, FL CRC Press, Inc: 337-338.
Kumar A, Kaul M, Bhan M, Punit K, Suri K. 2007. Morphological and chemical variation in 25 collections of the Indian medicinal plant, Withania somnifera (L.) Dunal (Solanaceae). Gen. Res. Crop Evo. 54: 655-660.
Liu K, Muse SV. 2005. Power Marker: an integrated analysis environment for genetic marker analysis. Bioinfo. 21(9): 2128-2129.
10
Soodan AS, Raina SN. 2011. Assessment and characterization of genetic diversity in Withania somnifera (L.) Dunal using RAPD and AFLP markers. Afr. J. Biotech. 10: 14746-14756.
Nagaoka T, Ogihara Y. 1997. Applicability of inter-simple sequence repeat polymorphisms in wheat for use as DNA markers in comparison to RFLP and RAPD markers. Theor. App. Genets. 94(5):597-602.
Negi MS, Sabharwal V, Wilson N, Lakshmi Kumaran MS. 2006. Comparative analysis of the efficiency of SAMPL and AFLP in assessing genetic relationships among Withania somnifera genotypes. Curr. Sci. 91(4): 464-471.
Nei. 1978. Estimation of average heterozygosity and genetic distance from a small number of individuals. Genetics. 89:583.
Nei M. 1973. Analysis of gene diversity in subdivided populations. Proc. Nat. Acad. Sci. USA. 70: 33219-3323.
Page RDM. 1996. TREEVIEW: An application to display phylogenetic trees on personal computers. Comp. App. Biosci. 12: 357-358.
Pavlicek A., Hrda S, Flegr J. 1999. Free Tree - Freeware program for construction of phylogenetic trees on the basis of distance data and bootstrap/jackknife analysis of the tree robustness. Application in the RAPD analysis of the genus Frenkelia. Folia Biologica (Praha). 45: 97-99.
Rout GR, Mohapatra A. 2006. Use of molecular markers in ornamental plants: A critical reappraisal. Eur. J. Horti. Sci. 71: 53-68.
Singh S, Kumar S. 1998. Withania somnifera
The Indian Ginseng- Ashwagandha. CIMAP, Lucknow, India.
Smith JSC, Chin ECL, Shu H, Smith OS, Wall SJ, Senior ML, Mitchell SE, Kresovich S, Zeigle J. 1997. An evaluation of the utility of SSR loci as molecular markers in maize (Zea mays
L.): Comparison with data from RFLPs and pedigree. Theor. App Genet. 95: 163-173.
Tripathi AK, Shukla YN, Kumar S. 1996. Ashwagandha (Withania somnifera): a status report J. Med. Arom Plant Sci. 18:46-56.