FEDERAL RESERVE BANK OF SAN FRANCISCO WORKING PAPER SERIES
Working Paper 2010-11
http://www.frbsf.org/publications/economics/papers/2010/wp10-11bk.pdf
The views in this paper are solely the responsibility of the authors and should not be interpreted as reflecting the views of the Federal Reserve Bank of San Francisco or the Board of Governors of the Federal Reserve System.
Financial Crisis and Bank Lending
Simon H. Kwan
Federal Reserve Bank of San Francisco
May 2010
Financial Crisis and Bank Lending
Simon H. Kwan
Economic Research Department Federal Reserve Bank of San Francisco 101 Market Street, San Francisco, CA 94105
Telephone (415) 974-3485 Fax (415) 974-2168
E-mail address: simon.kwan@sf.frb.org Preliminary Draft
May 2010
This paper estimates the amount of tightening in bank commercial and industrial (C&I) loan rates during the financial crisis. After controlling for loan characteristics and bank fixed effects, as of 2010:Q1, the average C&I loan spread was 66 basis points or 23 percent above normal. From about 2005 to 2008, the loan spread averaged 23 basis points below normal. Thus, from the unusually loose lending conditions in 2007 to the much tighter conditions in 2010:Q1, the average loan spread increased by about 1 percentage point. I find that large and medium-sized banks tightened their loan rates more than small banks; while small banks tended to tighten less, they always charged more.
Using loan size to proxy for bank-dependent borrowers, while small loans tend to have a higher spread than large loans, I find that small loans actually tightened less than large loans in both absolute and percentage terms. Hence, the results do not indicate that bank-dependent borrowers suffered more from bank tightening than large borrowers.
The channels through which banks tightened loan rates include reducing the discounts on large loans and raising the risk premium on more risky loans. There also is evidence that
noncommitment loans were priced significantly higher than commitment loans at the height of the liquidity shortfall in late 2007 and early 2008, but this premium dropped to zero following the introduction of emergency liquidity facilities by the Federal Reserve.
In a cross section of banks, certain bank characteristics are found to have significant effects on loan prices, including loan portfolio quality, capital ratios, and the amount of unused loan commitments. These findings provide evidence on the supply-side effect of loan pricing. I am very grateful for excellent research assistance by Kevin Cook, and editorial suggestions by Anita Todd. Helpful comments from participants at the San Francisco Fed brown bag seminar are acknowledged. All remaining errors are mine. The views expressed in this paper represent the author’s view only and do not necessarily represent the views of the Federal Reserve Bank of San Francisco or the Federal Reserve System.
Financial crisis and bank lending I. Introduction
The recent financial crisis has severely weakened the U.S. banking industry. The number of bank failures has skyrocketed, and it continues to climb. Bank stocks plummeted. In response to both the great economic recession and the dire conditions of the banking industry, banks
tightened their lending terms and standards to unprecedented levels, according to the Federal Reserve’s Senior Loan Officers Opinion Survey (SLOOS). The tightening in bank lending could undermine or even derail the economic recovery. In November 2008, in an attempt to encourage lending by financial institutions, the Federal Reserve, the Federal Deposit Insurance Corporation, the Office of the Comptroller of Currency, and the Office of Thrift Supervision issued the
“Interagency Statement on Meeting the Needs of Creditworthy Borrowers.” Nevertheless, the SLOOS suggested commercial banks continued to tighten both lending standards and loan terms throughout 2009.
While the SLOOS data provide qualitative evidence on the changes in bank loan supply, there are relatively few studies quantifying the extent of bank tightening in loan rate or explaining how and why banks tighten credit.1 In this paper, I use the transaction data for over one million commercial and industrial (C&I) loans extended by a panel of about 350 banks from 1997 to 2010 to study how the C&I loan rate behaved during the financial crisis, providing more direct evidence of credit tightening.
To delve into the channels of credit tightening and the supply-side effects of bank credit, I study the cross-sectional effects of loan characteristics and bank characteristics on loan pricing over the last 52 calendar quarters. While the finance literature emphasizes the demand-side factors in corporate borrowing, including the information problem of the borrowers [e.g. Norden and Wagner (2008) and Daniels and Ramirez (2008)], relationship lending [e.g. Calomiris and
1 Jiangli, Unal and Yom (2008) studied whether relationships benefit firms by making
credit more available during periods of financial stress during the Asian financial crisis. They found relationships had positive effects on credit availability for Korean and Thai firms, but not for Indonesian and Philippine firms.
Pornrojnangkool (2009), Hellman, Lindsey and Puri (2008), and Uchida, Udell and Yamori (2008)], and the borrower’s choice of debt and lenders [e.g. Kwan and Carleton (2009)], there are relatively few studies on the effects of the lender’s financial condition on loan pricing.2 Finding how a bank’s own financial condition affects its lending terms is akin to a pure supply-side effect in credit provisions.3
The papers most closely related to this study include Rajan (1994), Berger and Udell (2004), Murfin (2009), and Chava and Purnanandam (2009). Rajan (1994) studied how bank credit policy fluctuates. Berger and Udell (2004) used the same kind of data as in this paper to link portfolio performance to the tightening of bank credit standards and lending volumes, referring to their findings as the institutional memory hypothesis. Murfin (2009) studied the supply-side effects on loan covenants and found evidence that banks wrote tighter loan contracts than their peers after suffering defaults to their own portfolios, even when defaulting borrowers were in different industries and geographic regions than current borrowers. Chava and Purnanandam (2009) found that banks with exposure to the 1998 Russian default subsequently cut back on lending. More broadly, Bernanke and Gertler (1995), Peek and Rosengren (1997), Kang and Stulz (2000), and Paravisini (2008) studied various shocks to lenders on credit availability in the economy.
This paper focuses on the extent and the mechanism of credit tightening during the recent
financial crisis. The main findings of this study are the following. As of 2010:Q1, the C&I loan
2 Repullo and Suarez (2004) examined how two different Basel rules on capital
requirements, the advanced internal rating based approach versus the standardized rule, could affect loan pricing.
3 While providing evidence on the supply-side effects of bank lending, this paper does not address the bank lending channel in monetary policy transmission (see, for example, Kashyap, Stein, and Wilcox (1993), Oliner and Rudebusch (1996), and Kashyap and Stein (2000)). This is because the link between monetary policy and banking conditions is not modeled here and is beyond the scope of this paper.
rate spread over the federal funds rate was about 66 basis points higher than its long-term average. Because lending terms were unusually loose just prior to the eruption of the crisis, the increase in the loan rate spread from the trough in 2007:Q2 to 2010:Q1 was almost one
percentage point. Moreover, I do not find evidence that smaller bank-dependent borrowers, proxied by loan size, suffered more from bank tightening than large borrowers. The channels through which banks tightened loan prices include reducing the discounts on large loans and raising the price of risk for riskier loans. I also find evidence that noncommitment loans were priced significantly higher than commitment loans at the height of the liquidity shortfall in late 2007 and early 2008, but this premium dropped to zero following the introduction of emergency liquidity facilities by the Federal Reserve. Regarding the supply-side effects of loan pricing, in a cross section of banks, I find that loan portfolio quality, capital ratios, and the amount of unused loan commitments are found to have significant effects on loan prices.
The rest of this paper is organized as follows. Section II describes the data and provides summary statistics. Section III estimates how much banks tightened loan rates during the financial crisis. Section IV examines how and why banks tighten credit. The robustness of the findings is discussed in Section V. Section VI concludes.
II. Data
The loan transaction data are obtained from the Federal Reserve’s Survey of Terms of Business Lending (STBL), which collects data on all C&I loans made by a panel of about 350 domestic banks during the report period. The report period covers the first business week of February, May, August, and November of each year. The panel is drawn from across the United States and includes both large and small banks that actively engage in business lending. While participating banks tend to stay in the panel from year to year, the panel changes over time due to mergers and exits from banking.
The STBL covers all C&I loans to U.S. addresses when funds are disbursed to borrowers during the report period. The loans must be denominated in U.S. dollars and greater than $7,500. The data exclude loans secured by real estate, even if the proceeds are for commercial and industrial
purposes. Since the STBL started in 1977, the level of details reported by the participating banks has increased over time. In 1997:Q2, the STBL started collecting loan level credit risk ratings, with each risk rating category clearly defined by the Federal Reserve (rather than by the
reporting bank).
Specifically, the STBL defines five credit risk ratings. Rate1 is minimal risk; loans in this category have virtually no chance of resulting in a loss. Rate2 is low risk; loans in this category are very unlikely to result in a loss. Rate3 is moderate risk; loans in this category have little chance of resulting in a loss. This category should include the average loan, under average economic conditions, at the typical lender. Rate4 is acceptable risk; loans in this category have a limited chance of resulting in a loss. Rate5 is special mention or classified asset; loans in this category would generally fall into the examination categories of “special mention,”
“substandard,” “doubtful,” or “loss.” Rate5 would primarily be work-out loans, as it is highly unlikely that new loans would fall into this category. The complete definitions of the rating categories are provided in Appendix 1.
Since it is important to control for the credit risk of the borrowing firm, this study uses STBL data from 1997:Q2 to 2010:Q1. In addition to credit risk ratings, the loan level data include the loan rate, the loan size, whether the loan rate is based on the prime rate, commitment status, and whether the loan is secured by collateral. Term loans or loans with repricing intervals greater than one year are excluded. In order for the loans from a reporting bank in a particular quarter to be included in the analysis, the bank must have extended at least ten loans during the quarter. The financial data of the reporting banks are collected from the quarterly Report of Conditions and Income, known as the Call Report. The end-of-quarter Call Report data are merged with the quarterly STBL data immediately following the Call date, so that the STBL data always lead the Call Report data by one calendar month.4 The final data include 1,467,657 C&I loans made by 419 banks from 1997:Q2 to 2010:Q1.
4 For example, the December 2008 Call Report data are merged with the February 2009 STBL data.
For robustness, banks also are grouped into three size categories based on their total assets: large banks with total assets over $10 billion, medium banks with total assets between $1 billion and $10 billion, and small banks with total assets less than $1 billion. In addition, some analysis uses subsamples of large loans (at least $1 million) and small loans (no greater than $50,000).
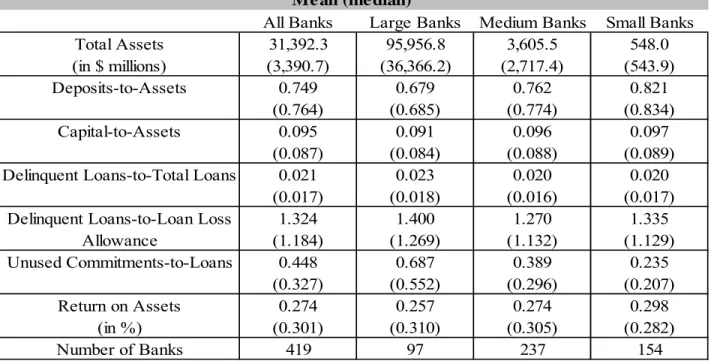
Table 1 provides descriptive statistics of the sample banks from 1997 to 2010 for both the full sample and by size class. Table 2 provides descriptive statistics of the sample C&I loans from 1997 to 2010, also for the full sample and by size class. Although there are more medium-sized banks in the sample, over 70 percent of the loans were made by large banks, reflecting the concentration in the banking industry. Both the mean and the median loan size increase with bank size. Credit risk ratings are concentrated in Rate3 (moderate risk) and Rate4 (acceptable risk) categories. Rate5 (special mention) loans account for less than 10 percent of the sample, and dropping these loans from the analysis provides very similar results.5 About 90 percent of the C&I loans in the full sample were made under commitment. About 80 percent of the sample C&I loans were secured with collaterals.
III. How much did banks tighten credit?
To examine how the loan rate charged by banks changes over time, I fit the following pooled time-series cross-sectional model by regressing the loan rate on loan characteristics, bank fixed effects and time effects.
,
where Yijtis the interest rate on loan i made by bank j at time t, Xijt is a vector of loan i
characteristics, Time is the time effect dummy, Bank is the bank fixed effect dummy, and git is
the residual. The loan characteristics include the following:
5 Dropping the very large loans (over $25 million) from the analysis also provides very similar results.
LOANSIZE = Log (loan size);
RATE2, ... RATE5 = Dummy variables equal 1 if the credit risk rating equals 2 to 5, respectively, zero otherwise;
PRIME = Dummy variable equals 1 if the base rate is the prime rate, zero otherwise;
NONCOMMIT = Dummy variable equals 1 if the loan is not made under a loan commitment, zero otherwise;
SECURE = Dummy variable equals 1 if the loan is secured by firm assets, zero otherwise.
The coefficient of LOANSIZE is expected to be negative due to scale economies in loan
production. In the model, RATE1 is excluded for identification, so the coefficients of RATE2 to RATE5 measure the incremental spread over RATE1 loans. RATE2 to RATE5 are expected to be positive and increasing, reflecting that loans have higher credit risk are charged a higher rate. The variable PRIME captures the bargaining power of the borrower and is expected to have a positive coefficient. Loans to smaller borrowers are usually priced using the prime rate as the base lending rate; loans to larger firms are usually based on the London interbank offered rate (Libor). The coefficient of NONCOMMIT is expected to be positive; ceteris paribus, banks have more flexibility and bargaining power in setting the loan rate of a NONCOMMIT loan than in the case of a loan drawdown from a line of credit. The coefficient of SECURE is expected to be negative since a collateralized loan improves the loan’s expected recovery rate in the event of a default than an uncollateralized loan.6
In equation (1), the vector of coefficients, α is restricted to be constant over time so that the first term measures the average effects of loan characteristics on loan rates. The bank fixed effect controls for bank-specific factors including its production function and local market competition.
6 Ono and Uesugi (2009) showed that the use of collateral is effective in raising the bank's seniority and enhances its screening and monitoring. Brick and Palia (2007) also found significant effects of collateral on loan rates. However, Berger and Udell (1990), Booth (1992), and Kwan and Carleton (2009) found that secured loans are associated with higher loan rates in large loans.
The coefficients of the time effect dummies capture the time-specific factors, mostly the level of interest rates in the economy.
Results of the estimated coefficients of loan characteristics in equation (1) using the full sample and the subsamples of large and small loans are provided in Table 3. While the coefficients of the bank fixed effects are not reported, many are significant. The adjusted R-squared is about 80 percent. Using the robust standard errors that correct for the clustering of observations per bank per quarter, the coefficients of the loan characteristics are significant and have the expected signs in general. The coefficient of LOANSIZE is significantly negative, indicating that large loans tend to be cheaper than small loans. The coefficients of the credit risk ratings are significant and they increase with risk. The coefficient of NONCOMMIT is significantly positive, except for large loans. On average, interest rates on noncommitment loans are 36 basis points higher than loans that were made under commitment. The coefficient of PRIME is significantly positive, indicating that prime-based loans on average are 75 basis points higher than non-prime-based loans. PRIME has a bigger effect on loan rates for large loans than for small loans. In Panel A, SECURE is significantly negative for loans made by small banks, but insignificant in the full sample and the large and medium bank subsamples. Panel B shows that for large loans, SECURE is significantly positive, and the result is robust with respect to bank size. This is consistent with the literature that states that for larger loans, collateral is actually associated with higher risk, consistent with self-selection of providing collateral. For small loans, in Panel C, SECURE is significantly negative, and the result is robust with respect to bank size. The findings suggest that for small loans, collateral improves recovery risk and has a negative effect on loan rates.
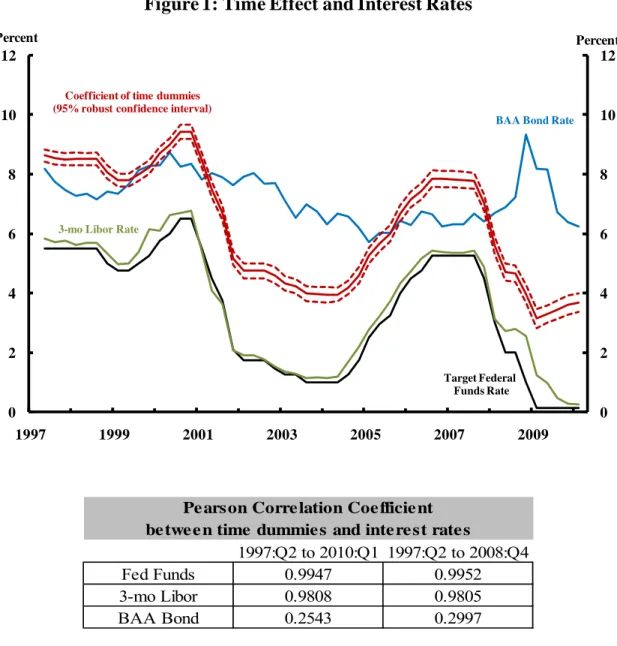
Figure 1 charts the estimates of the time effect dummies with the 95 percent robust confidence interval. The time effect coefficient tracks the target federal funds rate very well, and the Pearson correlation coefficient is 0.99. It also tracks the three-month Libor rate well, with the correlation at 0.98. It tracks the corporate bond rate less well, with the correlation at 0.25, most likely due to the differences in pricing conventions (floating rates versus fixed rates) and maturity between bank loans and corporate bonds.
The high correlation between the time effect and the federal funds rate suggests that monetary policy is fully transmitted to bank loan rates most of the time, implying that the spread of the time effect coefficient over the federal funds rate can be used to detect the unusual movements in bank loan rates.
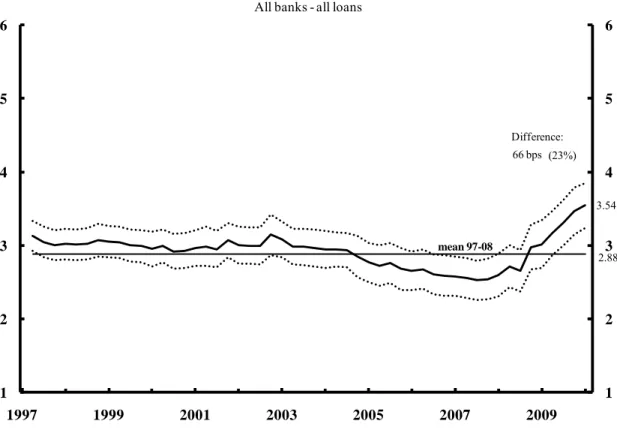
Figure 2 charts the spread of the time effect coefficient over the federal funds rate. From 1997:Q2 to 2008:Q4, this spread averaged 2.88 percent. However, as of 2010:Q1, this spread rose to 3.54 percent, which was significantly above the 1997-2008 average. The 66 basis points difference, or 23 percent above average, measures the tightness in the bank loan rate, which seems to be economically significant. Note that the spread was below average from 2004:Q4 to 2008:Q3 (averaging 23 basis points), indicating that the bank loan rate was unusually loose before the financial crisis. From the trough in 2007:Q2 to 2010:Q1, the tightening in this spread totaled about 1 percentage point.
Figures 3, 4, and 5 chart the results for large, medium, and small banks, respectively. The average spread decreases with bank size. While medium-sized banks exhibit the largest tightening in absolute terms, the percentage tightening for large banks and medium banks are similar. In Figure 5, the amount of tightening by small banks is 52 basis points or 8 percent above normal as of 2010:Q1. Small banks tend to charge a higher spread on average, and the recent tightening by small banks is similar to the last tightening cycle in 2003.
To shed light on the hypothesis that banks tighten the loan terms more on bank-dependent borrowers, I analyze subsamples of large loans (at least $1 million) and small loans (no greater than $50,000). Small loans are proxies for small borrowers who are less likely to have access to the capital market and who are more likely to be dependent on a relationship with a single bank.7 Large loans are assumed to be taken by large borrowers who likely have access to the capital market, including the commercial paper market, and also are likely to have relationships with more than one bank.
Figure 6 charts the spread of the time effect coefficient over the federal funds rate for the regression using only large loans. While the average spread on large loans is lower than in the full sample, the amount of tightening of large loans is estimated to be 91 basis points, or 46 percent above normal. Figures 7 and 8 show the large loan results by bank size.8 Large banks are found to tighten more on their large loans in percentage terms than medium-sized banks. Medium banks are found to tighten more on their large loans in absolute terms.
Figure 10 shows that while the average spread on small loans is higher, the amount of tightening in small loans is relatively smaller, at 52 basis points or 17 percent above normal. Medium-sized banks are found to tighten more on their small loans (Figure 12) than large banks (Figure 11). Small banks always charge a higher spread on their small loans, and the amount of recent tightening is similar to the 2003 tightening.
To summarize, the results by loan size show that while small loans tend to have larger spreads than large loans at all times, the amount of tightening in large loans is actually greater than in small loans. Thus, the findings do not support the hypothesis that banks tighten the terms more on loans to bank-dependent borrowers.
IV. How and why banks tighten credit
In equation (1), the coefficients of loan characteristics, α, are restricted to be constant over time so that they measure the average effect of loan characteristics on loan rates. Similarly, the bank fixed effect in (1) controls for the average effect of bank characteristics on loan rates. With those restrictions, the time effect coefficient captures the element of the loan rate that is unique to time period t after controlling for the average effects of loan characteristics and bank characteristics. In this section, I discuss how the effects of loan characteristics and bank characteristics on loan rates change over time, particularly over the recent quarters when banks were under severe stress. To do this, I relax the restrictions in equation (1) by fitting the following cross section regression at each quarter t:
8 Due to the relatively small number of observations of large loans made by small banks, the results in figure 9 have wide confidence interval and are ignored.
,
where θt is the intercept term, Zjt is a vector of bank j’s characteristics at time t, and νit is the
residual, to produce a time series of αtand βt. The evolution of αt captures how the effects of loan
characteristics on loan rates change over time, which addresses the question of how banks tighten credit. The evolution of βt captures how the effects of bank characteristics on loan rates
change over time, which addresses the question of why banks tighten credit.
Using data from the Call Report, the following variables are included in the Z vector: BADLOAN = Ratio of past-due and nonaccrual loans to allowance for loan loss; CAPITAL = Ratio of book value capital to total assets;
ROA = Return on assets;
UNCOMMIT = Log (Unused line of credit to total loans).
BADLOAN measures a bank’s loan portfolio quality relative to its reserves for loan loss.9 To the extent that a bank with a higher ratio of bad loans to loan-loss reserves is more likely to restrain itself in making new loans, that is, to reduce its loan supply, the coefficient of
BADLOAN would be positive. The channels through which BADLOAN could constrain bank lending include supervisory pressure to reduce lending, capital constraints due to higher
provisioning for loan loss in the future, and the bank’s own reassessment of the economic outlook, local economic conditions, and underwriting standards in light of the bad portfolio outcomes. While it is beyond the scope of this paper to distinguish among these channels, finding a positive coefficient of BADLOAN provides evidence of the supply-side effect of loan pricing.
CAPITAL is included to examine the effect of the book value capital ratio on loan prices. While CAPITAL may capture a bank’s capital constraint more directly, a bank’s book value capital could lag its economic capital in a significant way, such that BADLOAN may still be a better
measure of a bank’s lending constraint.1011 A negative coefficient of CAPITAL would suggest that a low book value capital ratio constrains bank lending. On the other hand, it is well known in the banking literature that a bank’s capital position reflects its risk aversion. If a more risk-averse bank tends to tighten its loan supply more at times of economic uncertainty, this could lead to a positive effect of CAPITAL on loan rates.
ROA measures a bank’s profitability. Higher ROA could result in higher retained earnings and hence additional capital both to support and to fund bank lending. Higher ROA could also lead to complacency or higher risk tolerance by bank management, and hence a lower loan rate. These effects would lead to a negative coefficient of ROA.
UNCOMMIT measures a bank’s unused loan commitment outstanding. If a bank (fully or partially) prefunds its loan commitments, a bank with a high level of unused loan commitments may want to utilize its unused lending capacity by increasing its loan supply, so that the
coefficient of UNCOMMIT would be negative. On the other hand, if a bank funds the
drawdowns from loan commitments mostly as or after the drawdowns have taken place, when this bank faces a high level of unused loan commitment outstanding, it could be vulnerable to unexpected drawdowns and therefore reduce its loan supply by raising loan rates.12 In a cross section of banks, whether the coefficient of UNCOMMIT is positive or negative is an empirical question. This coefficient also would likely be time varying, depending on the liquidity in the banking sector.
10 Washington Mutual was considered well capitalized just before it failed. Wachovia also was well capitalized before it was acquired by Wells Fargo.
11 Many banks in the STBL panel do not have publicly traded stocks for computing market value capital ratio. Bank stock prices also likely capture the bad loan effects already included in the model.
12 Gatev, Schuermann and Strahan (2009) argued that deposits can be used to hedge loan commitments. Ivashina and Scharfstein (2009) found banks that cosyndicated more of their credit lines with Lehman Brothers reduced their syndicated lending more following the Lehman collapse.
These four bank-specific variables test the supply-side effects of loan pricing. In the cross-sectional regression, βt captures the pure cross-sectional effects of BADLOAN, CAPITAL,
ROA, and UNCOMMIT on the loan rate at a given point in time. This should be distinguished from a time-series cross-sectional model where a positive effect of BADLOAN on loan price could be because rising loan delinquency signals worsening economic developments that prompts banks to tighten loan rates. In a pure cross-sectional regression, all banks are at the same point in time facing the same economy. If, for example, banks with more bad loans indeed are found to charge a higher loan rate than banks with fewer bad loans, the results would be more supportive of the supply-side story than the economic outlook story.
Table 4 reports the results of fitting equation (2) by quarter, from 1997:Q2 to 2010:Q1. The intercept term tracks the federal funds rate, but not as well as in Figure 1. Since the effects of loan characteristics and bank characteristics on loan rates are allowed to be time varying, the tightening in loan rates is reflected in both the intercept term and the changes in coefficients. The coefficient of PRIME is mostly positive and significant. PRIME is insignificant in the fourth quarter of 2008. At the height of the financial crisis (following the collapse of Lehman), it appears that banks made little distinction between prime-based and non-prime-based C&I
lending, suggesting a one-time tightening in loan prices on non-prime-based loans. The coefficient of PRIME bounces back to being significantly positive in 2009:Q1.
The coefficient of LOANSIZE increases over time but remains significantly negative. The negative coefficient suggests that the loan rate declines with loan size. From 2008:Q1 to 2010:Q1, the coefficient of LOANSIZE increases from -0.19 to -0.10, which can be interpreted as one channel of tightening in loan terms, although this coefficient also exhibits a slight upward trend prior to 2008. Counting the increase in the coefficient from -0.19 to -0.10 as tightening, the discount on a $2 million loan over an otherwise similar $1 million loan shrinks from 13 basis points in 2008:Q1 to 7 basis points in 2010:Q1.
The coefficients of risk rating have the expected positive sign, and they increase with the risk rating. Since 2009, the coefficients of risk rating have been trending up, especially the
coefficients of RATE3, RATE4, and RATE5, but they rebounded from relatively low levels. A higher coefficient of risk rating indicates that banks raise the price of risk. For example, the average moderate risk (RATE3) loan is about 40 basis points more expensive in 2010 compared to mid-2009, while the average workout loan (RATE5) costs about 70 basis points more. However, the tightening seems a normalization from unusually low risk premiums before the crisis.
The coefficient of NONCOMMIT is positive but insignificant until 2006. It is significantly positive in late 2007 and early 2008, when the liquidity in the banking sector was unusually scarce. As liquidity returned to the banking sector following the introduction of emergency liquidity facilities by the Federal Reserve, the coefficient of NONCOMMIT becomes
insignificant.13 The findings suggest that banks charge a premium for noncommitment loans when they face liquidity constraints.
The coefficient of SECURE is negative, but largely insignificant. SECURE is significantly negative briefly in 2008.
Turning to the effects of bank characteristics on loan rates, before 2008, the coefficient of
BADLOAN is insignificantly different from zero (significantly negative in 2000:Q1), suggesting that cross sectionally, loan portfolio quality does not seem to have effects on loan price. Since 2008, there are a number of quarters when the coefficient of BADLOAN is significantly positive. A positive coefficient suggests that in a cross section of banks, banks with poorer portfolio
quality charge a higher loan rate. The findings are consistent with the supply-side effect of loan pricing. In terms of economic significance, the mean or median BADLOAN ratio is about 2.2 as of 2010:Q1. Using the point estimate of 0.2 for the coefficient of BADLOAN, the average tightening due to the portfolio effect is about 44 basis points.
The coefficient of CAPITAL is significantly positive during the tightening cycle from 2003 to 2004, indicating that banks with more capital charge a higher loan rate. During the current
13 See Kwan (2009) for a discussion of liquidity in the banking sector during the financial crisis.
episode, CAPITAL is significantly positive in 2008:Q4. These results are robust when the regression is estimated separately by bank size.14 The positive effect of CAPITAL on loan rates is consistent with a capital position reflecting risk aversion, where more risk-averse banks choose to hold more capital. Thus, the findings suggest that during periods of high economic
uncertainty, a more risk-averse bank tightens its loan supply more by charging a higher loan rate. The coefficient of ROA is mostly insignificant, indicating that profitability does not seem to affect loan pricing.
The coefficient of UNCOMMIT is significantly negative from mid-2004 to mid-2006, as well as from 2007 to 2008. The negative coefficient indicates that banks with more unused loan
commitments charge lower loan rates, thereby raising their loan supply to borrowers. This seems to suggest that unused loan commitments are associated with excess lending capacity, consistent with the notion that banks (at least partially) fund their loan commitments ahead of drawdowns.
V. Robustness
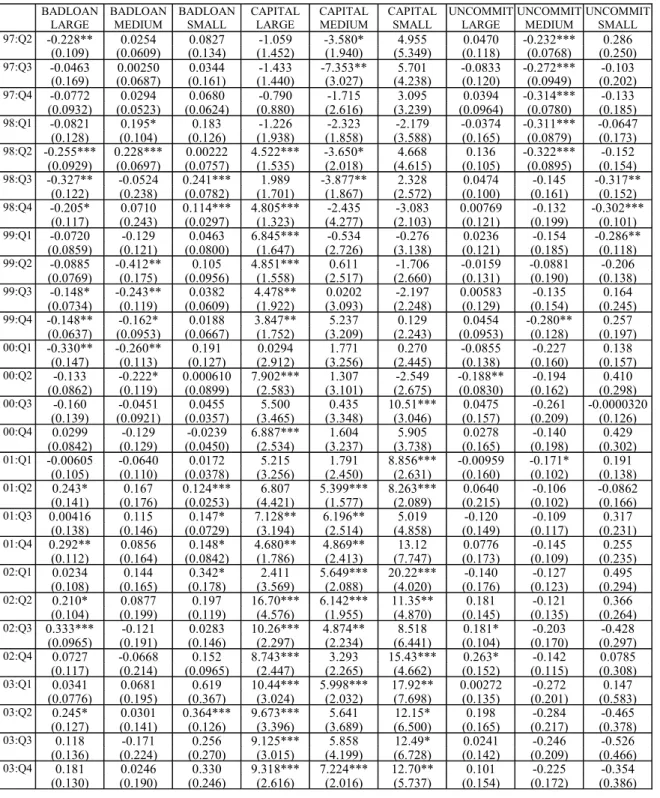
For robustness, equation (2) is fit separately for each size class of banks by quarter. Table 5 reports the results of the three key bank characteristics that are found to have significant effects
on loan rate in Table 4, namely BADLOAN, CAPITAL, and UNCOMMIT.15 Since 2007:Q4,
BADLOAN has a significantly positive effect on loan rates for large banks in 8 out of 10 quarters, and the magnitude of the BADLOAN effect was increasing. For medium-sized banks, the coefficient of BADLOAN is mostly insignificant except for a few quarters. In the small bank regressions, BADLOAN is significantly positive in 2009:Q2 to 2009:Q4 and the magnitude is large.
14 Using regulatory capital ratio, such as risk-based capital ratio or tier-1 capital ratio, provides similar results.
15 To save space, the results of the other variables in equation (2) in the size-based regressions are not reported.
Regarding CAPITAL, the positive effect of CAPITAL on loan rates holds up reasonably well before 2005. Since then, CAPITAL is found to have a positive effect on loan rates among large banks and medium banks in a number of quarters, whereas CAPITAL is found to have
a significantly negative effect on loan prices among small banks in many quarters. The negative effect of CAPITAL on loan rates by small banks is consistent with the capital constraint story. While large banks tend to have better access to the capital market, and they also received capital injection from the government during the financial crisis, small banks may be more sensitive than large banks to capital shortfalls.
On the effect of UNCOMMIT on loan prices, the results are quite robust with respect to bank size. Banks with more unused loan commitments tend to lower their loan rates.
In equation (2), BADLOAN consists of three categories, loans that are past due 30 through 89 days and still accruing, loans that are past due 90 days or more and still accruing, and
nonaccruing past-due loans. In Table 6, results of estimating equation (2) using each component of BADLOAN are reported. From 2007 to mid-2008, the component of BADLOAN that has significant effect on the cross-sectional differences in loan rates is the over 90-days past due loans. As the financial crisis deepened, nonaccruing loans are found to have significant effect on loan rates. This seems to reflect the aging of bad loans over time. Note that on balance, the 30-89 days past-due loans do not have a significant effect on loan pricing, suggesting that banks do not seem to react to the first sign of loan portfolio deterioriation.
In Table 4, the effect of CAPITAL on loan rates is found to be positive in a number of quarters, which is interpreted as reflecting the cross sectional effect of banks’ risk aversion on loan
pricing. One concern is that the accounting measure of book value capital may not be up-to-date in measuring a bank’s true capital constraint. To address this potential concern, equation (2) is reestimated by including four lags of CAPITAL. Table 6 reports the results of the coefficients of CAPITAL and its lags, as well as the sum of the coefficients. Focusing on the sum of the effects of CAPITAL and lagged CAPITAL on loan rates in the last column of Table 6, the effect of CAPITAL on loan rates holds up quite well. Hence, the finding that risk-averse banks that hold more capital tend to charge a higher loan rate appears to be robust.
VI. Conclusions
This paper estimates the amount of tightening in bank C&I loan rates during the recent financial crisis. After controlling for loan characteristics and bank fixed effects, as of 2010:Q1, the average C&I loan spread was 66 basis points or 23 percent above normal. From about 2005 to 2008, the loan spread averaged 23 basis points below normal. Thus, from the unusually loose conditions in 2007 to the much tighter conditions in 2010:Q1, the average loan spread increased by about 1 percentage point. Large and medium-sized banks were found to tighten their loan rates more than small banks; and while small banks tended to tighten less, they always charged more.
Using loan size to proxy for bank-dependent borrowers, while small loans tended to have a larger spread than large loans, the amount of tightening in small loans was actually less than in large loans, in both absolute and percentage terms. Hence, the results do not indicate that bank- dependent borrowers suffered more from bank tightening than large borrowers.
The channels through which banks tightened loan rates include reducing the discount on large loans and raising the risk premium on more risky loans. There also is evidence that
noncommitment loans were priced significantly higher than commitment loans at the height of the liquidity shortfall from late 2007 to early 2008, but this premium dropped to zero following the introduction of emergency liquidity facilities by the Federal Reserve.
In a cross section of banks, certain bank characteristics are found to have significant effects on loan prices, including loan portfolio quality, capital ratios, and the amount of unused loan commitments. These findings provide evidence in support of the supply-side effect of loan pricing.
References
Berger, A. and G. Udell, 1990, Collateral, loan quality, and bank risk, Journal of Monetary Economics 25, 21-42.
Berger, A. and G. Udell (2004), The institutional memory hypothesis and the procyclicality of bank lending behavior, Journal of Financial Intermediation, 13 (4), 458-495.
Bernanke, B. and M. Gertler (1995), Inside the black box: The credit channel of monetary policy transmission, The Journal of Economic Perspectives, 9(4), 27-48.
Booth, J., 1992, Contract costs, bank loans, and the cross-monitoring hypothesis, Journal of Financial Economics 31, 25-41.
Brick, I. and D. Palia (2007), Evidence of jointness in the terms of relationship lending, Journal of Financial Intermediation, July 2007, Vol. 16, No. 3, pp. 452-76.
Calomiris, C. W. and T. Pornrojnangkool (2009), Relationship banking and the pricing of financial services, Journal of Financial Services Research, June 2009, Vol. 35, No, 3, pp. 189-224.
Chava, S. and A.K. Purnanandam (2009), The effect of banking crisis on bank-dependent borrowers, Working paper.
Daniels, K. and G. Ramirez (2008), Information, credit risk, lender specialization and loan pricing: Evidence from the DIP financing market, Journal of Financial Services Research, August 2008, Vol. 34, No. 1, pp. 35-59.
Federal Reserve System, FDIC, OCC, and OTS (2008), Interagency statement on meeting the needs of creditworthy borrowers, November 12, 2008.
Gatev, E., T. Schuermann and P. Strahan (2009), Managing bank liquidity risk: How deposit-loan synergies vary with market conditions, Review of Financial Studies, March 2009, v. 22, iss. 3, pp. 995-1020.
Hellmann, T., L. Lindsey and M. Puri (2008), Building relationships early: Banks in venture capital, Review of Financial Studies, Vol. 21, No. 2, pp. 512-41.
Ivashina, V. and D. Scharfstein (2009), Bank lending during the financial crisis of 2008, Harvard Business School Working Paper.
Jiangli, W., H. Unal and C. Yom (2008), Relationship lending, accounting disclosure, and credit availability during the Asian financial crisis, Journal of Money, Credit, and Banking, February 2008, Vol. 40, No. 1, pp. 25-55.
Kang, J. and R. M. Stulz (2000), Do banking shocks affect borrowing firm performance? An analysis of the Japanese experience, Journal of Business, 73 (1), 1-23.
Kashyap, A. and J. Stein (2000), What do a million observations on banks say about the transmission of monetary policy? American Economic Review, June, pp. 407-28.
Kashyap, A., J. Stein, and D. Wilcox (1993), Monetary policy and credit conditions: Evidence from the composition of external finance, American Economic Review, Vol. 83, No. 1, pp. 78-98.
Kwan, S. (2009), Behavior of Libor in the current financial crisis, Federal Reserve Bank of San Francisco Economic Letter.
Kwan, S. and W. Carleton (2009), Financial contracting and the choice between private placement and publicly offered bonds, Journal of Money, Credit, and Banking, forthcoming. Murfin, J (2009), The supply side determinants of loan contract strictness, Duke University Working Paper.
Norden, L. and W. Wagner (2008), Credit derivatives and loan pricing, Journal of Banking and Finance, December 2008, Vol. 32, No. 12, pp. 2560-69.
Oliner, S. and G. Rudebusch (1996), Monetary policy and credit conditions: Evidence from the composition of external finance: comment, American Economic Review, Vol. 86, No. 1, pp. 300-09.
Ono, A. and I. Uesugi (2009), Role of collateral and personal guarantees in relationship lending: Evidence from Japan’s SME loan market, Journal of Money, Credit, and Banking, August 2009, Vol. 41, No. 5, pp. 935-60.
Paravisini, D. (2008), Local Bank Financial Constraints and Firm Access to External Finance, Journal of Finance, 63 (5):2161-2193.
Peek, J. and E. Rosengren (1997), The international transmission of financial shock, American Economic Review, 87 (4), 495-505.
Rajan, R. G. (1994), Why bank credit policies fluctuate: A theory and some evidence, Quarterly Journal of Economics 109, pp 399-442.
Repullo, R. and J. Suarez (2004), Loan pricing under Basel capital requirements, Journal of Financial Intermediation, Special Issue October 2004, Vol. 13, No. 4, pp. 496-521.
Uchida, H., G. Udell and N. Yamori (2008), Loan officers and relationship lending to SMEs, Federal Reserve Bank of San Francisco, Working Paper Series: 2008-17
Appendix 1: STBL instructions on credit risk rating
Risk rating. If your institution assigns internal risk ratings to business loans, enter the
numerical designation from the list provided below that most closely matches the definition of the internal rating assigned to this loan. Do not enter your institution’s own internal risk rating. If your institution rates loans, but a particular loan is unrated, or not yet rated, enter ‘‘0” for that loan. If your institution does not assign internal risk ratings to business loans, either (a) leave this column blank or (b) use the categories presented below to make the assignment. The definitions provided here take account of both the characteristics of the borrower and the protections
provided in the loan contract. Note that the definitions are intended to characterize ranges of risk; hence the definition of your institution’s internal rating for a loan probably will not exactly match any of the provided definitions. Enter the numerical designation that corresponds most
closely to the internal rating of your institution. The risk rating categories provided here are not
intended to establish a supervisory standard for the maintenance or reporting of internal risk rating systems.
Minimal risk (enter ‘‘1”). Loans in this category have virtually no chance of resulting in a loss. They would have a level of risk similar to a loan with the following characteristics:
• The customer has been with your institution for many years and has an excellent credit history. • The customer’s cash flow is steady and well in excess of required debt repayments plus other fixed charges.
• The customer has an AA or higher public debt rating.
• The customer has excellent access to alternative sources of finance at favorable terms. • The management is of uniformly high quality and has unquestioned character.
• The collateral, if required, is cash or cash equivalent and is equal to or exceeds the value of the loan.
• The guarantor, if required, would achieve approximately this rating if borrowing from your institution.
Low risk (enter ‘‘2”). Loans in this category are very unlikely to result in a loss. They would have a level of risk similar to a loan with the following characteristics:
• The customer has an excellent credit history.
• The customer’s cash flow is steady and comfortably exceeds required debt repayments plus other fixed charges.
• The customer has a BBB or higher public debt rating.
• The customer has good access to alternative sources of finance at favorable terms. • The management is of high quality and has unquestioned character.
• The collateral, if required, is sufficiently liquid and has a large enough margin to make very likely the recovery of the full amount of the loan in the event of default.
• The guarantor, if required, would achieve approximately this rating if borrowing from your institution.
Moderate risk (enter ‘‘3”). Loans in this category have little chance of resulting in a loss. This category should include the average loan, under average economic conditions, at the typical
lender. Loans in this category would have a level of risk similar to a loan with the following characteristics:
• The customer has a good credit history.
• The customer’s cash flow may be subject to cyclical conditions, but is adequate to meet required debt repayments plus other fixed charges even after a limited period of losses or in the event of a somewhat lower trend in earnings.
• The customer has limited access to the capital markets.
• The customer has some access to alternative sources of finance at reasonable terms. • The firm has good management in important positions.
• Collateral, which would usually be required, is sufficiently liquid and has a large enough margin to make likely the recovery of the value of the loan in the event of default.
• The guarantor, if required, would achieve approximately this rating if borrowing from your institution.
Acceptable risk (enter ‘‘4”). Loans in this category have a limited chance of resulting in a loss. They would have a level of risk similar to a loan with the following characteristics:
• The customer has only a fair credit rating but no recent credit problems.
• The customer’s cash flow is currently adequate to meet required debt repayments, but it may not be sufficient in the event of significant adverse developments.
• The customer does not have access to the capital markets.
• The customer has some limited access to alternative sources of finance possibly at unfavorable terms.
• Some management weakness exists.
• Collateral, which would generally be required, is sufficient to make likely the recovery of the value of the loan in the event of default, but liquidating the collateral may be difficult or expensive.
• The guarantor, if required, would achieve this rating or lower if borrowing from your institution.
Special mention or classified asset (enter ‘‘5”). Loans in this category would generally fall into the examination categories: “special mention,” “substandard,” “doubtful,” or “loss.” They would primarily be work-out loans, as it is highly unlikely that new loans would fall into this
All Banks Large Banks Medium Banks Small Banks
Total Assets 31,392.3 95,956.8 3,605.5 548.0 (in $ millions) (3,390.7) (36,366.2) (2,717.4) (543.9) Deposits-to-Assets 0.749 0.679 0.762 0.821 (0.764) (0.685) (0.774) (0.834) Capital-to-Assets 0.095 0.091 0.096 0.097 (0.087) (0.084) (0.088) (0.089)
Delinquent Loans-to-Total Loans 0.021 0.023 0.020 0.020
(0.017) (0.018) (0.016) (0.017) 1.324 1.400 1.270 1.335 (1.184) (1.269) (1.132) (1.129) Unused Commitments-to-Loans 0.448 0.687 0.389 0.235 (0.327) (0.552) (0.296) (0.207) Return on Assets 0.274 0.257 0.274 0.298 (in %) (0.301) (0.310) (0.305) (0.282) Number of Banks 419 97 237 154
Table 1: De scriptive Statistics for Sample Banks, 1997:Q2-2010:Q1 Me an (me dian)
Delinquent Loans-to-Loan Loss Allowance
Note: The sum of the total number of banks by size class exceeds the “ALL” column because some banks belonged to more than one size class during the sampling period.
All Banks Large Banks Medium Banks Small Banks
Loan Rate 6.873 6.672 7.436 8.044 (in percent) (7.000) (6.750) (7.750) (8.500) Loan Amount 337.4 392.5 175.9 78.0 (in $ thousands) (40.4) (47.0) (30.0) (20.0) Minimal Risk 0.019 0.017 0.024 0.033 Low Risk 0.085 0.087 0.066 0.149 Moderate Risk 0.460 0.451 0.491 0.469 Acceptable Risk 0.358 0.366 0.338 0.293 Special Mention 0.079 0.079 0.082 0.057
Not under Commitment 0.106 0.102 0.117 0.133
Secured 0.796 0.780 0.850 0.803
Number of Loans 1,467,657 1,111,828 317,044 38,785
Table 2: De scriptive Statistics for C&I Loans, 1997:Q2-2010:Q1 Me an (me dian) or fraction
All loans
All Banks Large Banks Medium Banks Small Banks
Loan Rate 5.907 5.810 6.699 6.503 (in percent) (6.000) (5.962) (6.810) (6.250) Loan Amount 4.067 4.165 3.318 2.291 (in $ millions) (2.243) (2.300) (2.000) (1.712) Minimal Risk 0.035 0.033 0.044 0.206 Low Risk 0.178 0.180 0.162 0.131 Moderate Risk 0.494 0.500 0.449 0.430 Acceptable Risk 0.226 0.226 0.231 0.182 Special Mention 0.066 0.060 0.114 0.051
Not under Commitment 0.092 0.083 0.160 0.313
Secured 0.538 0.515 0.726 0.734
Number of Loans 87,227 77,581 9,218 428
Large loans (at le ast $1,000,000) Me an (me dian) or fraction
All Banks Large Banks Medium Banks Small Banks
Loan Rate 7.156 6.955 7.594 8.220 (in percent) (7.250) (7.000) (8.000) (8.500) Loan Amount 17.5 17.9 16.8 15.3 (in $ thousands) (15.0) (15.0) (13.6) (11.3) Minimal Risk 0.017 0.014 0.023 0.032 Low Risk 0.069 0.072 0.051 0.140 Moderate Risk 0.456 0.444 0.491 0.475 Acceptable Risk 0.384 0.399 0.353 0.294 Special Mention 0.073 0.071 0.082 0.059
Not under Commitment 0.125 0.126 0.119 0.129
Secured 0.817 0.808 0.849 0.799
Number of Loans 785,930 566,335 191,508 28,087
Small loans (le ss than $50,000) Me an (me dian) or fraction
Table 3: Results of pooled time-series cross-section regression, 1997:Q2-2010:Q1 (Fixed-effect and time-effect coefficients not reported, robust standard errors in parentheses) Panel A: All loans
ALL LARGE MEDIUM SMALL
PRIME 0.758*** 0.838*** 0.450*** -0.253 (0.124) (0.150) (0.074) (0.154) LOANSIZE -0.209*** -0.210*** -0.197*** -0.203*** (0.019) (0.023) (0.018) (0.016) RATE2 0.227** 0.133 0.473*** 0.950*** (0.109) (0.137) (0.136) (0.139) RATE3 0.647*** 0.562*** 0.861*** 1.362*** (0.152) (0.203) (0.148) (0.137) RATE4 0.810*** 0.692*** 1.145*** 1.741*** (0.092) (0.116) (0.149) (0.164) RATE5 1.252*** 1.190*** 1.407*** 1.893*** (0.099) (0.129) (0.148) (0.226) NONCOMMIT 0.363*** 0.333** 0.418*** 0.299*** (0.106) (0.140) (0.079) (0.107) SECURE -0.089 -0.080 -0.148 -0.122** (0.075) (0.088) (0.108) (0.050) Adjusted R2 0.807 0.804 0.808 0.779 N 1,467,657 1,111,828 317,044 38,785
Panel B: Large loans (at least $1,000,000)
ALL LARGE MEDIUM SMALL
PRIME 1.285*** 1.324*** 0.935*** 0.997*** (0.077) (0.084) (0.089) (0.291) LOANSIZE -0.114*** -0.108*** -0.146*** 0.108 (0.012) (0.013) (0.025) (0.115) RATE2 0.111 0.080 0.450*** 0.351 (0.087) (0.092) (0.143) (0.419) RATE3 0.498*** 0.478*** 0.707*** 0.713** (0.077) (0.083) (0.128) (0.270) RATE4 1.003*** 0.997*** 1.091*** 0.631*** (0.060) (0.064) (0.156) (0.234) RATE5 1.445*** 1.469*** 1.412*** 1.846*** (0.100) (0.119) (0.143) (0.371) NONCOMMIT -0.080 -0.112* 0.206* -0.005 (0.057) (0.062) (0.123) (0.215) SECURE 0.387*** 0.387*** 0.291*** 0.317*** (0.045) (0.050) (0.046) (0.089) Adjusted R2 0.823 0.822 0.813 0.814 N 87,227 77,581 9,218 428
Panel C: Small loans (less than $50,000)
ALL LARGE MEDIUM SMALL
PRIME 0.518*** 0.601** 0.261** -0.403** (0.194) (0.240) (0.102) (0.169) LOANSIZE -0.234*** -0.240*** -0.209*** -0.220*** (0.023) (0.030) (0.022) (0.027) RATE2 0.414*** 0.268 0.619*** 1.073*** (0.159) (0.210) (0.181) (0.171) RATE3 0.763*** 0.617* 0.997*** 1.537*** (0.220) (0.317) (0.192) (0.150) RATE4 0.861*** 0.661*** 1.249*** 1.927*** (0.143) (0.199) (0.183) (0.181) RATE5 1.187*** 1.031*** 1.479*** 2.014*** (0.154) (0.216) (0.183) (0.240) NONCOMMIT 0.504*** 0.509*** 0.421*** 0.300** (0.143) (0.192) (0.077) (0.131) SECURE -0.312*** -0.326*** -0.286** -0.182*** (0.088) (0.107) (0.120) (0.063) Adjusted R2 0.793 0.790 0.799 0.762 N 785,930 566,335 191,508 28,087
Table 4: Cross section regressions of loan rate on loan characteristics and bank characteristics
(robust standard errors are in parentheses)
Intercept PRIME LOAN-SIZE
RATE2 RATE3 RATE4 RATE5 NON-COMMIT
SECURE BAD-LOAN
CAPITAL ROA UN-COMMIT Adj-R2 N 97:Q2 7.944*** 1.168*** -0.232*** 0.207 0.500*** 0.606*** 1.137*** 0.226** 0.0311 0.0126 0.241 77.76** -0.241*** 0.430 22300 (0.267) (0.0972) (0.0202) (0.142) (0.130) (0.122) (0.140) (0.112) (0.0666) (0.0489) (1.383) (34.16) (0.0530) 97:Q3 7.888*** 1.202*** -0.221*** 0.249** 0.614*** 0.767*** 1.256*** 0.207 0.138** 0.0114 -1.335 20.10 -0.263*** 0.472 25677 (0.218) (0.0871) (0.0173) (0.110) (0.0875) (0.0839) (0.0948) (0.128) (0.0606) (0.0646) (1.322) (30.60) (0.0548) 97:Q4 7.870*** 1.189*** -0.221*** 0.239** 0.650*** 0.843*** 1.277*** 0.170 0.0762 0.0658 -0.232 -10.84 -0.291*** 0.474 26404 (0.194) (0.0855) (0.0164) (0.106) (0.0936) (0.0972) (0.108) (0.121) (0.0610) (0.0574) (1.189) (32.17) (0.0617) 98:Q1 8.516*** 1.205*** -0.266*** -0.0391 0.456*** 0.590*** 1.067*** 0.207* -0.0930 0.0634 -0.377 -16.61 -0.232*** 0.440 31509 (0.356) (0.0768) (0.0297) (0.166) (0.170) (0.184) (0.170) (0.120) (0.143) (0.100) (1.600) (34.74) (0.0855) 98:Q2 8.247*** 1.045*** -0.280*** 0.241 0.765*** 0.824*** 1.259*** 0.133 0.0218 -0.0189 3.439* -48.34*** -0.133 0.453 31309 (0.359) (0.122) (0.0289) (0.152) (0.164) (0.147) (0.149) (0.120) (0.130) (0.0701) (1.994) (8.320) (0.116) 98:Q3 8.651*** 1.163*** -0.289*** 0.0277 0.584*** 0.772*** 1.123*** 0.349 -0.165 -0.186* 0.376 49.71*** -0.0732 0.428 32287 (0.383) (0.0973) (0.0320) (0.172) (0.177) (0.173) (0.164) (0.234) (0.163) (0.103) (1.830) (14.95) (0.0974) 98:Q4 8.500*** 1.037*** -0.292*** -0.212 0.412* 0.485** 1.354*** 0.382 -0.210 -0.0118 3.010 -79.17*** -0.0956 0.412 31379 (0.376) (0.0962) (0.0343) (0.217) (0.237) (0.222) (0.455) (0.246) (0.163) (0.0920) (1.956) (23.41) (0.105) 99:Q1 7.486*** 0.848*** -0.283*** 0.327*** 0.945*** 0.995*** 1.341*** 0.510** -0.118 -0.0894 4.650** -13.33 -0.109 0.388 34577 (0.307) (0.131) (0.0277) (0.123) (0.172) (0.122) (0.133) (0.253) (0.139) (0.0658) (1.808) (11.58) (0.110) 99:Q2 7.669*** 0.840*** -0.259*** 0.118 0.758*** 0.899*** 1.183*** 0.423 -0.125 -0.154* 3.497* 12.86 -0.102 0.303 33204 (0.403) (0.163) (0.0288) (0.170) (0.182) (0.186) (0.163) (0.277) (0.184) (0.0877) (2.047) (13.39) (0.110) 99:Q3 7.861*** 1.008*** -0.249*** 0.107 0.676*** 0.741*** 1.087*** 0.134 -0.192 -0.106 4.159** -8.885 -0.0521 0.367 33558 (0.405) (0.117) (0.0284) (0.179) (0.190) (0.174) (0.171) (0.233) (0.165) (0.0782) (1.861) (9.005) (0.105) 99:Q4 7.684*** 1.073*** -0.241*** 0.312* 0.826*** 0.947*** 1.394*** -0.106 -0.214 -0.104 5.004*** 18.40 -0.0677 0.394 30170 (0.394) (0.110) (0.0275) (0.182) (0.194) (0.174) (0.170) (0.129) (0.165) (0.0678) (1.619) (18.63) (0.0818) 00:Q1 8.928*** 1.054*** -0.241*** 0.217 0.805*** 0.886*** 1.354*** -0.105 -0.269 -0.288*** 1.824 -40.75** -0.112 0.388 30338 (0.473) (0.100) (0.0306) (0.192) (0.196) (0.180) (0.189) (0.126) (0.182) (0.0805) (1.938) (17.65) (0.103) 00:Q2 7.821*** 0.926*** -0.200*** 0.492*** 0.946*** 1.032*** 1.593*** -0.0680 -0.000849 -0.0963 6.510*** 9.042 -0.223*** 0.351 30236 (0.366) (0.0867) (0.0200) (0.176) (0.201) (0.184) (0.168) (0.138) (0.134) (0.0965) (2.371) (26.36) (0.0676) 00:Q3 8.391*** 1.147*** -0.210*** 0.278 0.909*** 0.927*** 1.464*** -0.0796 -0.131 -0.0124 5.746** 32.27* -0.0498 0.383 25830 (0.399) (0.116) (0.0294) (0.175) (0.195) (0.168) (0.153) (0.116) (0.158) (0.0725) (2.297) (16.64) (0.123) 00:Q4 8.383*** 1.111*** -0.214*** 0.482*** 0.783*** 0.877*** 1.376*** -0.0267 -0.128 0.0220 6.349*** 13.83 -0.0556 0.368 29342 (0.343) (0.107) (0.0320) (0.170) (0.169) (0.131) (0.136) (0.151) (0.150) (0.0646) (2.019) (27.17) (0.130) 01:Q1 7.594*** 0.910*** -0.238*** 0.610*** 0.850*** 1.020*** 1.438*** -0.0115 -0.147 0.0181 5.485** 39.68*** -0.108 0.338 31433 (0.394) (0.125) (0.0353) (0.164) (0.174) (0.114) (0.126) (0.130) (0.174) (0.0589) (2.202) (14.46) (0.117) 01:Q2 6.907*** 0.762*** -0.271*** 0.258 0.493** 0.634*** 1.007*** 0.166 -0.148 0.172*** 6.869** 17.39 -0.0979 0.307 31018 (0.418) (0.174) (0.0339) (0.215) (0.240) (0.196) (0.214) (0.181) (0.151) (0.0486) (2.894) (32.16) (0.145)
Intercept PRIME LOAN-SIZE
RATE2 RATE3 RATE4 RATE5 NON-COMMIT
SECURE BAD-LOAN
CAPITAL ROA UN-COMMIT Adj-R2 N 01:Q3 6.000*** 0.761*** -0.259*** 0.289 0.637*** 0.829*** 1.210*** 0.168 -0.211 0.117 7.532*** 3.226 -0.167 0.324 32375 (0.420) (0.174) (0.0324) (0.205) (0.219) (0.160) (0.165) (0.215) (0.159) (0.0813) (2.023) (41.46) (0.104) 01:Q4 4.456*** 0.338 -0.252*** 0.277 0.790*** 0.948*** 1.395*** 0.168 -0.165 0.241*** 5.327*** 51.05** -0.182* 0.218 30857 (0.361) (0.218) (0.0293) (0.177) (0.201) (0.169) (0.174) (0.243) (0.131) (0.0714) (1.590) (22.59) (0.108) 02:Q1 4.732*** 0.552** -0.254*** 0.243 0.513* 0.624*** 1.068*** 0.178 -0.261* 0.0387 4.046 10.09 -0.246* 0.221 31289 (0.553) (0.253) (0.0310) (0.212) (0.290) (0.213) (0.225) (0.214) (0.143) (0.0854) (3.201) (19.46) (0.127) 02:Q2 4.340*** 0.287 -0.256*** 0.157 0.746*** 0.797*** 1.226*** 0.383 -0.375*** 0.101 11.83*** -63.35 -0.134 0.212 31317 (0.415) (0.257) (0.0306) (0.208) (0.273) (0.180) (0.196) (0.343) (0.142) (0.0780) (2.596) (38.88) (0.102) 02:Q3 4.820*** 0.465** -0.264*** -0.139 0.464 0.498* 1.039*** 0.237 -0.234* 0.152* 8.166*** -95.91** -0.0860 0.243 29817 (0.472) (0.195) (0.0261) (0.282) (0.301) (0.262) (0.270) (0.229) (0.124) (0.0872) (1.955) (41.91) (0.0854) 02:Q4 5.248*** 0.0832 -0.267*** -0.487* 0.112 0.183 0.857*** 0.322 -0.117 -0.0123 7.315*** -14.63 -0.0476 0.207 26305 (0.401) (0.191) (0.0302) (0.250) (0.264) (0.199) (0.203) (0.197) (0.131) (0.119) (2.003) (21.53) (0.133) 03:Q1 4.664*** 0.179 -0.265*** -0.277 0.301 0.227 0.903*** 0.240 -0.211** -0.00397 9.664*** -45.83 -0.182 0.201 29343 (0.489) (0.164) (0.0298) (0.301) (0.360) (0.284) (0.290) (0.246) (0.0968) (0.0682) (2.392) (35.41) (0.120) 03:Q2 3.704*** 0.551*** -0.250*** 0.268* 0.766*** 0.717*** 1.367*** 0.210 -0.288** 0.0882 8.587*** -12.87 -0.201 0.232 22043 (0.425) (0.200) (0.0366) (0.159) (0.139) (0.121) (0.133) (0.212) (0.128) (0.0936) (2.931) (54.55) (0.138) 03:Q3 3.813*** 0.577*** -0.245*** 0.361** 0.770*** 0.610*** 1.236*** 0.213 -0.305*** -0.0639 8.293*** -47.50 -0.181 0.222 25277 (0.445) (0.165) (0.0304) (0.147) (0.198) (0.125) (0.146) (0.260) (0.0983) (0.116) (2.815) (57.08) (0.120) 03:Q4 3.434*** 0.426** -0.237*** 0.395** 0.814*** 0.686*** 1.307*** 0.335 -0.129 0.0328 8.622*** -2.050 -0.108 0.212 27176 (0.439) (0.193) (0.0332) (0.155) (0.219) (0.148) (0.182) (0.263) (0.112) (0.112) (2.534) (36.52) (0.123) 04:Q1 3.501*** 0.610*** -0.233*** 0.166 0.694*** 0.570*** 1.170*** 0.111 -0.161 0.0625 9.446*** -44.86 -0.0415 0.218 27973 (0.432) (0.187) (0.0351) (0.172) (0.208) (0.184) (0.199) (0.263) (0.138) (0.0599) (2.539) (41.34) (0.145) 04:Q2 2.967*** 0.420* -0.191*** 0.256 0.703*** 0.577*** 1.179*** 0.279 0.0387 0.122 6.449** 17.59 -0.432*** 0.218 26427 (0.394) (0.216) (0.0191) (0.183) (0.213) (0.173) (0.204) (0.276) (0.106) (0.0983) (2.636) (56.31) (0.131) 04:Q3 3.043*** 0.606*** -0.165*** 0.343** 0.652*** 0.579*** 1.077*** 0.158 0.0154 0.0538 6.606*** 18.25 -0.515*** 0.242 24659 (0.379) (0.169) (0.0184) (0.157) (0.204) (0.150) (0.204) (0.242) (0.0833) (0.105) (2.366) (42.38) (0.121) 04:Q4 3.939*** 0.746*** -0.141*** 0.202** 0.450*** 0.500*** 0.853*** 0.201 -0.0886 0.0640 -1.924 56.05*** -0.838*** 0.296 30813 (0.281) (0.156) (0.0265) (0.101) (0.163) (0.0787) (0.171) (0.223) (0.0973) (0.0699) (1.932) (13.50) (0.120) 05:Q1 4.342*** 0.734*** -0.168*** 0.666*** 1.016*** 1.058*** 1.137*** 0.167 -0.154 0.151*** -1.426 9.469 -0.712*** 0.298 25709 (0.279) (0.225) (0.0222) (0.113) (0.150) (0.118) (0.192) (0.229) (0.103) (0.0564) (1.865) (35.09) (0.120) 05:Q2 4.591*** 0.899*** -0.160*** 0.376*** 0.862*** 0.927*** 1.031*** 0.246 -0.0652 0.134** -0.911 32.19 -0.706*** 0.332 28384 (0.272) (0.187) (0.0245) (0.0946) (0.112) (0.0989) (0.169) (0.165) (0.0993) (0.0510) (2.007) (34.89) (0.104) 05:Q3 4.693*** 0.817*** -0.172*** 0.401*** 0.936*** 0.946*** 1.231*** 0.178 -0.0462 0.0939 3.872* -3.158 -0.676*** 0.320 25930 (0.308) (0.188) (0.0263) (0.130) (0.131) (0.118) (0.158) (0.177) (0.116) (0.0618) (2.291) (23.12) (0.121) 05:Q4 5.311*** 1.080*** -0.162*** 0.386*** 0.901*** 0.959*** 1.280*** 0.142 -0.0431 0.0762 1.552 17.56 -0.668*** 0.361 20188 (0.248) (0.225) (0.0293) (0.114) (0.149) (0.0895) (0.114) (0.190) (0.111) (0.0570) (1.911) (15.81) (0.108)
Intercept PRIME LOAN-SIZE
RATE2 RATE3 RATE4 RATE5 NON-COMMIT
SECURE BAD-LOAN
CAPITAL ROA UN-COMMIT Adj-R2 N 06:Q1 6.111*** 1.001*** -0.171*** 0.465*** 0.917*** 1.008*** 1.293*** 0.195 -0.140 0.0290 0.620 33.42 -0.550*** 0.351 26753 (0.291) (0.179) (0.0254) (0.120) (0.116) (0.130) (0.151) (0.150) (0.0927) (0.0337) (1.829) (30.87) (0.0901) 06:Q2 6.978*** 1.019*** -0.172*** 0.343 0.870*** 0.919*** 1.182*** 0.0826 -0.0284 0.0147 1.044 -72.96 -0.133 0.312 29721 (0.386) (0.159) (0.0261) (0.226) (0.210) (0.192) (0.208) (0.112) (0.0702) (0.0385) (1.932) (53.67) (0.103) 06:Q3 7.480*** 1.059*** -0.180*** 0.148 0.753*** 0.737*** 1.004*** 0.126 -0.0347 0.0331 1.901 -70.69 -0.0959 0.299 31903 (0.329) (0.241) (0.0331) (0.137) (0.119) (0.0984) (0.108) (0.167) (0.0589) (0.0521) (1.348) (60.76) (0.127) 06:Q4 7.476*** 1.068*** -0.190*** 0.0980 0.647** 0.692*** 0.957*** 0.105 -0.162* 0.0638 2.370* -33.93 -0.0805 0.307 27194 (0.431) (0.223) (0.0322) (0.238) (0.251) (0.235) (0.246) (0.189) (0.0864) (0.0551) (1.242) (55.65) (0.0973) 07:Q1 7.196*** 0.967*** -0.187*** 0.234 0.689*** 0.752*** 0.962*** 0.282*** -0.120 0.0230 2.534 -14.52 -0.395*** 0.330 27730 (0.309) (0.199) (0.0328) (0.184) (0.206) (0.182) (0.207) (0.104) (0.106) (0.0347) (1.657) (26.37) (0.0674) 07:Q2 7.352*** 0.859*** -0.183*** 0.176 0.607** 0.590*** 0.812*** 0.249** -0.113 0.0437 1.305 3.032 -0.431*** 0.293 27287 (0.472) (0.210) (0.0318) (0.226) (0.244) (0.208) (0.242) (0.116) (0.110) (0.0431) (1.715) (43.53) (0.0842) 07:Q3 7.235*** 0.938*** -0.178*** 0.415*** 0.803*** 0.802*** 1.005*** 0.216 -0.0470 0.0371 0.977 -44.63 -0.366*** 0.326 26244 (0.306) (0.155) (0.0263) (0.127) (0.143) (0.121) (0.141) (0.149) (0.0855) (0.0452) (1.564) (50.03) (0.0828) 07:Q4 6.720*** 0.827*** -0.174*** 0.216 0.584*** 0.577*** 0.770*** 0.344*** -0.205** 0.0591* 1.218 -36.72* -0.437*** 0.324 26905 (0.314) (0.144) (0.0262) (0.138) (0.159) (0.144) (0.168) (0.117) (0.0834) (0.0323) (1.324) (19.35) (0.0755) 08:Q1 5.541*** 0.610*** -0.192*** -0.0787 0.310 0.364* 0.655*** 0.319** -0.273*** 0.121*** -1.635 31.33*** -0.774*** 0.306 29715 (0.389) (0.157) (0.0262) (0.207) (0.229) (0.214) (0.221) (0.143) (0.0710) (0.0364) (1.752) (8.869) (0.103) 08:Q2 4.602*** 0.333*** -0.171*** 0.166* 0.492*** 0.482*** 0.864*** 0.309** -0.228*** 0.104* 0.291 -19.13 -0.628*** 0.243 29619 (0.256) (0.106) (0.0229) (0.0941) (0.108) (0.0969) (0.0901) (0.151) (0.0567) (0.0563) (1.658) (28.94) (0.0886) 08:Q3 4.400*** 0.528*** -0.158*** 0.0126 0.377** 0.420*** 0.821*** 0.390** -0.270*** 0.108* 0.265 6.745 -0.615*** 0.269 27225 (0.321) (0.121) (0.0240) (0.132) (0.175) (0.138) (0.160) (0.163) (0.0617) (0.0589) (1.563) (14.33) (0.0994) 08:Q4 4.164*** -0.243 -0.166*** 0.0202 0.373** 0.382** 0.780*** -0.0434 -0.170** 0.0658 7.227*** -9.962 -0.0386 0.115 28455 (0.434) (0.174) (0.0233) (0.155) (0.159) (0.153) (0.196) (0.120) (0.0715) (0.0647) (2.471) (13.04) (0.145) 09:Q1 2.579*** 0.943*** -0.130*** -0.109 0.328* 0.306* 0.776*** 0.0425 -0.182** 0.0302 4.254 -14.13 -0.155 0.193 25360 (0.457) (0.186) (0.0294) (0.159) (0.180) (0.173) (0.207) (0.169) (0.0769) (0.0981) (2.801) (9.004) (0.110) 09:Q2 2.433*** 0.876*** -0.116*** -0.327** 0.206 0.277* 0.899*** 0.0914 -0.142* 0.163* 4.845 4.833 -0.171 0.199 25547 (0.462) (0.140) (0.0269) (0.144) (0.140) (0.154) (0.174) (0.117) (0.0835) (0.0831) (3.434) (4.538) (0.129) 09:Q3 2.363*** 1.045*** -0.114*** -0.311** 0.274* 0.326** 0.907*** -0.0870 -0.0538 0.210** 3.641 -12.84 -0.165 0.225 22936 (0.559) (0.153) (0.0308) (0.139) (0.149) (0.153) (0.186) (0.179) (0.0927) (0.103) (3.942) (21.02) (0.113) 09:Q4 2.433*** 1.006*** -0.100*** -0.182 0.490*** 0.543*** 1.160*** -0.150 -0.117 0.168 1.012 -16.73 -0.425** 0.259 22184 (0.722) (0.158) (0.0346) (0.164) (0.159) (0.184) (0.222) (0.185) (0.0969) (0.116) (3.859) (10.42) (0.163) 10:Q1 2.270*** 0.948*** -0.105*** -0.0903 0.587*** 0.645*** 1.415*** -0.0776 -0.0761 0.202*** 0.428 -22.29 -0.504*** 0.273 26426 (0.545) (0.150) (0.0376) (0.160) (0.137) (0.158) (0.182) (0.221) (0.0873) (0.0762) (2.452) (14.11) (0.179)
Table 5: Cross section regression results for selected bank characteristics
(robust standard errors in parentheses) BADLOAN
LARGE BADLOAN MEDIUM BADLOAN SMALL CAPITAL LARGE MEDIUM CAPITAL CAPITAL SMALL UNCOMMITLARGE UNCOMMIT MEDIUM UNCOMMITSMALL
97:Q2 -0.228** 0.0254 0.0827 -1.059 -3.580* 4.955 0.0470 -0.232*** 0.286 (0.109) (0.0609) (0.134) (1.452) (1.940) (5.349) (0.118) (0.0768) (0.250) 97:Q3 -0.0463 0.00250 0.0344 -1.433 -7.353** 5.701 -0.0833 -0.272*** -0.103 (0.169) (0.0687) (0.161) (1.440) (3.027) (4.238) (0.120) (0.0949) (0.202) 97:Q4 -0.0772 0.0294 0.0680 -0.790 -1.715 3.095 0.0394 -0.314*** -0.133 (0.0932) (0.0523) (0.0624) (0.880) (2.616) (3.239) (0.0964) (0.0780) (0.185) 98:Q1 -0.0821 0.195* 0.183 -1.226 -2.323 -2.179 -0.0374 -0.311*** -0.0647 (0.128) (0.104) (0.126) (1.938) (1.858) (3.588) (0.165) (0.0879) (0.173) 98:Q2 -0.255*** 0.228*** 0.00222 4.522*** -3.650* 4.668 0.136 -0.322*** -0.152 (0.0929) (0.0697) (0.0757) (1.535) (2.018) (4.615) (0.105) (0.0895) (0.154) 98:Q3 -0.327** -0.0524 0.241*** 1.989 -3.877** 2.328 0.0474 -0.145 -0.317** (0.122) (0.238) (0.0782) (1.701) (1.867) (2.572) (0.100) (0.161) (0.152) 98:Q4 -0.205* 0.0710 0.114*** 4.805*** -2.435 -3.083 0.00769 -0.132 -0.302*** (0.117) (0.243) (0.0297) (1.323) (4.277) (2.103) (0.121) (0.199) (0.101) 99:Q1 -0.0720 -0.129 0.0463 6.845*** -0.534 -0.276 0.0236 -0.154 -0.286** (0.0859) (0.121) (0.0800) (1.647) (2.726) (3.138) (0.121) (0.185) (0.118) 99:Q2 -0.0885 -0.412** 0.105 4.851*** 0.611 -1.706 -0.0159 -0.0881 -0.206 (0.0769) (0.175) (0.0956) (1.558) (2.517) (2.660) (0.131) (0.190) (0.138) 99:Q3 -0.148* -0.243** 0.0382 4.478** 0.0202 -2.197 0.00583 -0.135 0.164 (0.0734) (0.119) (0.0609) (1.922) (3.093) (2.248) (0.129) (0.154) (0.245) 99:Q4 -0.148** -0.162* 0.0188 3.847** 5.237 0.129 0.0454 -0.280** 0.257 (0.0637) (0.0953) (0.0667) (1.752) (3.209) (2.243) (0.0953) (0.128) (0.197) 00:Q1 -0.330** -0.260** 0.191 0.0294 1.771 0.270 -0.0855 -0.227 0.138 (0.147) (0.113) (0.127) (2.912) (3.256) (2.445) (0.138) (0.160) (0.157) 00:Q2 -0.133 -0.222* 0.000610 7.902*** 1.307 -2.549 -0.188** -0.194 0.410 (0.0862) (0.119) (0.0899) (2.583) (3.101) (2.675) (0.0830) (0.162) (0.298) 00:Q3 -0.160 -0.0451 0.0455 5.500 0.435 10.51*** 0.0475 -0.261 -0.0000320 (0.139) (0.0921) (0.0357) (3.465) (3.348) (3.046) (0.157) (0.209) (0.126) 00:Q4 0.0299 -0.129 -0.0239 6.887*** 1.604 5.905 0.0278 -0.140 0.429 (0.0842) (0.129) (0.0450) (2.534) (3.237) (3.738) (0.165) (0.198) (0.302) 01:Q1 -0.00605 -0.0640 0.0172 5.215 1.791 8.856*** -0.00959 -0.171* 0.191 (0.105) (0.110) (0.0378) (3.256) (2.450) (2.631) (0.160) (0.102) (0.138) 01:Q2 0.243* 0.167 0.124*** 6.807 5.399*** 8.263*** 0.0640 -0.106 -0.0862 (0.141) (0.176) (0.0253) (4.421) (1.577) (2.089) (0.215) (0.102) (0.166) 01:Q3 0.00416 0.115 0.147* 7.128** 6.196** 5.019 -0.120 -0.109 0.317 (0.138) (0.146) (0.0729) (3.194) (2.514) (4.858) (0.149) (0.117) (0.231) 01:Q4 0.292** 0.0856 0.148* 4.680** 4.869** 13.12 0.0776 -0.145 0.255 (0.112) (0.164) (0.0842) (1.786) (2.413) (7.747) (0.173) (0.109) (0.235) 02:Q1 0.0234 0.144 0.342* 2.411 5.649*** 20.22*** -0.140 -0.127 0.495 (0.108) (0.165) (0.178) (3.569) (2.088) (4.020) (0.176) (0.123) (0.294) 02:Q2 0.210* 0.0877 0.197 16.70*** 6.142*** 11.35** 0.181 -0.121 0.366 (0.104) (0.199) (0.119) (4.576) (1.955) (4.870) (0.145) (0.135) (0.264) 02:Q3 0.333*** -0.121 0.0283 10.26*** 4.874** 8.518 0.181* -0.203 -0.428 (0.0965) (0.191) (0.146) (2.297) (2.234) (6.441) (0.104) (0.170) (0.297) 02:Q4 0.0727 -0.0668 0.152 8.743*** 3.293 15.43*** 0.263* -0.142 0.0785 (0.117) (0.214) (0.0965) (2.447) (2.265) (4.662) (0.152) (0.115) (0.308) 03:Q1 0.0341 0.0681 0.619 10.44*** 5.998*** 17.92** 0.00272 -0.272 0.147 (0.0776) (0.195) (0.367) (3.024) (2.032) (7.698) (0.135) (0.201) (0.583) 03:Q2 0.245* 0.0301 0.364*** 9.673*** 5.641 12.15* 0.198 -0.284 -0.465 (0.127) (0.141) (0.126) (3.396) (3.689) (6.500) (0.165) (0.217) (0.378) 03:Q3 0.118 -0.171 0.256 9.125*** 5.858 12.49* 0.0241 -0.246 -0.526 (0.136) (0.224) (0.270) (3.015) (4.199) (6.728) (0.142) (0.209) (0.466) 03:Q4 0.181 0.0246 0.330 9.318*** 7.224*** 12.70** 0.101 -0.225 -0.354 (0.130) (0.190) (0.246) (2.616) (2.016) (5.737) (0.154) (0.172) (0.386)