Future environmental regulations for shipping in the
Baltic Sea area and their consequences for the
seaports
On the basis of the seminar
“Baltic Ports and Environment – new regulations and challenges”
held on 7th December 2010Malmö, Sweden
2 Report coordinator: Baltic Ports Organization Secretariat
Authors:
Monika Rozmarynowska – academic teacher at Gdynia Maritime Academy Bogdan Ołdakowski, BPO Secretary General
Baltic Ports Organization is made up of forty plus major ports in the nine countries surrounding the Baltic Sea. The main objective of BPO is to improve the competitiveness of maritime transport in the Baltic region by increasing the efficiency of ports, marketing the Baltic region as a strategic logistics centre, improving the infrastructure within the ports and their connections to other modes of transport.
TransBaltic, as one of the few transnational projects so far, has been granted a strategic status by the authorities of the Baltic Sea Region Programme 2007-2013. The overall objective of TransBaltic is to provide regional level incentives for the creation of a comprehensive multimodal transport system in the BSR. This is to be achieved by means of joint transport development measures and jointly implemented business concepts. TransBaltic is led by Region Skåne and lasts from 1 June 2009 to 31 December 2012.
3
Table of contents
Introduction... 4 1. Main environmental concerns in the Baltic ports... 5
2. Reduction of emissions from ships - consequences for Baltic transport sector... 8 3. New regulations for sewage discharges from passenger ships - how ports should be prepared for that...
20
4. Ballast Water Management ... 25 Summary... 29
4
Introduction
This report has been prepared on the basis of presentations presented at the TransBaltic and Baltic Ports Organization’s 2nd seminar – “Baltic Ports and Environment – new regulations and challenges” held on the 7th of December 2010 in Malmö and presentations presented at the seminar – “LNG in the Baltic and North Sea - Business opportunities or the cost factor for the ports” held on the 12th of January 2011 in Gothenburg. However, additional information from many other sources has also been used in this report.
In the first part of the report the main environmental priorities of Baltic ports have been indentified according to the ESPO/EcoPorts survey. Further parts deal with future environmental regulations for shipping within the Baltic Sea and their influence on ports. The shipping industry is one of the main contributors to the bad environmental situation within the Baltic Sea. The negative influence of Baltic maritime traffic on the environment is connected mainly with: SOx and NOx emissions, wastewater dumped into the sea, the spread
of alien species which are carried in a ship’s ballast waters. However, there are several steps being undertaken to make sea transport more environmentally friendly and to reduce its disadvantageous influence on the Baltic Sea’s ecosystem.
One of these is the reduction requirements of NOx and SOx emissions for shipping. Annex VI
of MARPOL 73/78 makes the Baltic a “SOx emission control area”, demanding as of 2015 all
ships to use fuel with a sulphur content not exceeding 0.1%. Furthermore, IMO also specifies future NOx emission limits for marine engines. Another regulation is connected with a ban on
dumping untreated ship sewage directly into the Baltic Sea. When this regulation enters into force, passenger and cruise ships will be obliged to use approved sewage treatment plants capable of reducing nutrients or deliver sewage to a port reception facility. In turn, the International Convention for the Control and Management of Ships Ballast Water & Sediments deals with the third environmental problem within the Baltic Sea mentioned above. The entry into force of the BWM Convention would be a crucial step towards reducing the spreading of non-native species worldwide and regionally.
The new environmental regulations are a great challenge not only for the shipping industry but also for ports. In this report the most significant consequences for Baltic ports resulting from the upcoming rules are pointed out.
5
1. Main environmental concerns in the Baltic ports
Port activities have a significant impact on the environment. Noise, dust, and emissions from ships and the transport modes operating in a port, pollution from cargo spillage, bunkering activity all have environmental consequences. Nowadays, environmental issues are a significant component of port management. Ports are well aware of the need to demonstrate the competence to deliver both environmental protection and sustainable development in many areas of their operations. National and international legislation and regulation concerning, inter alia, climate change, security, safety and health aspects is the most significant factor leading a port to invest in its environmental performance. However, apart from environmental regulations, there are some other motivations such as: response to societal pressures, the need to improve operations, and to gain competitive advantage.
The top-10 environmental priorities of Baltic ports
In 2009 the European Sea Ports Organisation (ESPO), in close collaboration with the EcoPorts Foundation, carried out a survey whose aim was to identify the priority environmental issues for European ports and demonstrate the sector’s performance in terms of environmental management. It was the third such survey which has been carried out within the past 15 years.1 The results of the survey are contained in ESPO/EcoPorts Port Environmental Review 2009.
According to this survey, the current environmental priorities in Baltic seaports are, to some extent, the same as the environmental priorities in European seaports. Eight priority issues are found in both the Baltic and the European Top 10 (noise, dredging: disposal, air quality, relationship with local community, dust, dredging: operations, energy consumption, port development - land). Three environmental issues are of the same importance for both Baltic and European seaports (noise, energy consumption and port development – land) and five issues have a different place in the ranking. Garbage/port waste and port development – water - does not appear in the Baltic Top 10, whereas ship exhaust emission and climate change are not found in the Top 10 priorities in European seaports.
The current top environmental priority indicated by Baltic as well as European ports is noise. The generation of noise in ports is related to most mechanical or industrial activities carried out in a port. Noise has a very negative impact on employees, wildlife and the public. The European Noise Directive2 is considered to be one of the main factors for the high priority on noise in seaports. Air quality, as an environmental priority, reflects the priority given to issues related to the health of people working or living around ports, and it is in line with the
1 In 1996 ESPO commissioned the first survey concerning the most important environmental problems in ports, the second such survey was carried out in 2004. In 2009 122 ports from 20 European Maritime States participated in the environmental survey. The Baltic Sea region was represented by 16 Danish ports, 1 Estonian port, 5 Finnish ports, 9 German ports, 1 Latvian port and 12 Swedish ports.
2 On 25 June 2002 the European Parliament and the Council adopted Directive 2002/49/EC relating to the Assessment and Management of Environmental Noise. The Aim of the Directive is to provide a common European basis for tackling the noise problem across the EU.
6 European political agenda. It appears that some environmental issues such as dredging operations, dredging disposal, dust and port development for a large majority of European ports as well as Baltic ports form a basis for environmental collaboration in the port sector. These environmental issues have been among the Top 10 environmental priorities in European ports since 1996. However, two new priorities for 2009 have been indicated – the relationship with local communities and energy consumption. These issues reflect the political priorities on energy efficiency and climate change as well as the importance of good port-city relations and societal integration for the operation of a sustainable port.
Table 1. The Top 10 environmental priorities of Baltic ports and European ports, 2009
No. European ports (122) 2009 Baltic ports (44) 2009
1 Noise Noise
2 Air quality Dredging: disposal
3 Garbage / Port waste Air quality
4 Dredging: operations Relationship with local community
5 Dredging: disposal Dust
6 Relationship with local community Dredging: operations
7 Energy consumption Energy consumption
8 Dust Ship Exhaust emission
9 Port development (water) Climate change
10 Port development (land) Port development (land)
Source: ESPO initiatives on Sustainable Development - presentation, Gun Rudeberg, 2010
Environmental performance of the Baltic Ports
In general, during the past 15 years, European ports have achieved significant progress in the field of environmental management. More and more ports have an environmental policy, carry out environmental monitoring, have their own environmental specialists and implement an environmental management system. As far as Baltic ports are concerned, currently, 66% out of the 44 responding Baltic ports have an environmental policy. However, 43% of the respondent ports make it available to the public. What’s interesting, 55% ports aim to improve environmental standards beyond those required by legislation. 55% of ports have their own environmental personnel and 39% of ports have implemented an environmental management system. Other indicators of the environmental performance of Baltic ports in the fields of environmental policy, environmental management and communication, climate change and energy efficiency are presented in Table 2.
7 Table 2. Indication of the environmental performance of Baltic ports in the fields of environmental policy, environmental management and communication, climate change and energy efficiency.
Areas of interest Indication of the environmental performance in the
fields of interest
Environmental Policy: • 66 % of respondent ports have an
environmental policy
• 43% of respondent ports make it available to the public
• 55% of ports aim improve environmental standards beyond those required under legislation
Environmental communication: • 55% of respondent ports provide
environmental information through their website
• 59% of the ports are aware of the services provided by the Ecoports Foundation • 43% of respondent ports produce a publicly
available Annual Environmental Review or Report
Environmental management: • 39% of ports have a form of Environmental Management System
• 55% of ports have their own environmental specialist(s)
• 68% carry out monitoring within the port area • 45% have identified environmental indicators Climate change and energy efficiency: • 27% of ports measure or estimate their carbon
footprint
• 45% of ports take measures to reduce their carbon footprint
• 52% of ports have a programme to increase energy efficiency
• 23 % of ports produce some form of Renewable Energy
8
2. Reduction of emissions from ships - consequences for the Baltic
transport sector
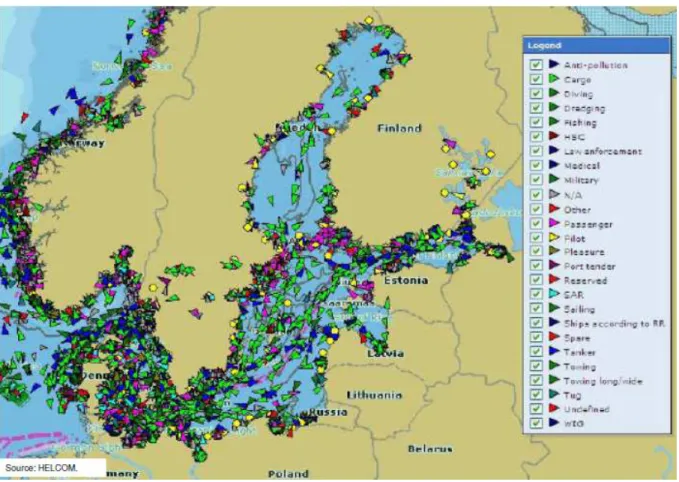
Baltic Sea is one of the busiest seas in the world. It accounts for 15% of the world’s cargo transportation. In 2009, ships entered or left the Baltic Sea about 62,700 times. Each month
approximately 3,500-5,000 vessels ply the waters of Baltic and there is about 2,000 ships in the Baltic Sea at any given time.3
Figure 1. Ships traffic in the Baltic Sea.
Source:HELCOM, NOx emissions from ships - consequences for shipping and Baltic ports -presentation, Ulla Tapaninen, University of Turku, Centre for Maritime Studies, 2010
The extensive shipping activity within the Baltic Sea has a negative impact on the environment. The shipping industry is one of the several contributors to the local pollution, especially in terms of NOx, SOx and particlemass (PM) emission. Baltic Sea shipping in 2008
emitted about 135,000 tonnes SOx, 393,000 tonnes of NOx and 18.9 million tonnes CO2. This
is the same amount of NOx and twice the amount of the SOx as the total land-based emissions
from Sweden and Denmark combined.4
3 http://www.helcom.fi/press_office/news_helcom/en_GB/Report_on_ship_accidents_2009/ (28.02.2011) 4
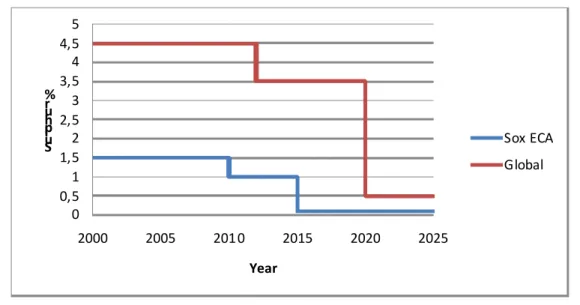
9 0 0,5 1 1,5 2 2,5 3 3,5 4 4,5 5 2000 2005 201 0 2015 2020 2025 S u lp h u r % Year Sox ECA Global
There are several steps undertaken to save the ecosystem in Baltic Sea area, one of these is emission reduction requirements for shipping industry. Limits of NOx and SOx emissions
from ship exhausts are defined by IMO in MARPOL 73/78 Annex VI - “Regulations for the Prevention of Air Pollution from Ships” which entered into force in May 2005. Two sets of emission requirements are defined by Annex VI: global requirements, and more stringent requirements applicable to ships in Emission Control Areas (ECA). An Emission Control Area can be designated for SOx and PM, or NOx, or all three types of emissions from ships.
The Baltic Sea belongs to IMO SOx Emission Control Area (SECA) and the work on
designating the Baltic Sea as a NOx Emission Control Area is ongoing.
Sulphur Content of Fuel
In order to reduce SOx emissions in ECA, IMO requires reduction of fuel sulphur content.
From 1 July 2010 the fuel sulphur contents must be below 1 %. In turn, from 1 January 2015 fuel sulphur content must be below 0.1 % (as can be seen in the Table 3, the global requirements are less stringent). However, according to European Union Directive 2005/33/EC, valid from 1 January 2010, ships at berth in all ports of the European Community shall not use marine fuels with a sulphur content exceeding 0.1% by mass. Ships were given a transitional period till the end of August 2010 to make the necessary technical changes.
Table 3. Sulphur Limit in Fuel
Date Sulphur Limit in Fuel
in ECA (%)
Date Sulphur Limit in
Fuel Global (%)
2000 1.5 % 2000 4,5 %
1 July 2010 1.0 % 2012 3,5 %
2015 0.1 % 2020* 0,5 %
* alternative date is 2025, to be decided by a review in 2018
Source: MARPOL 73/78, Annex VI Regulations for the Prevention of Air Pollution from Ships
10
NOx Emission Standards
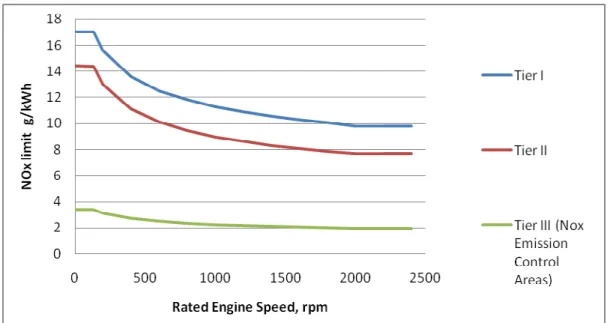
IMO specifies also existing and future NOx emission limits for marine engines. The IMO NOx
emission standards are commonly referred to Tier I, Tier II and Tier III standards. Currently, the Tier I standard is enforced. It applies to a diesel engine which is installed on a ship constructed on or after 1 January 2000. Tier II goes came into effect in January 2011. It means that NOX emissions of the engines will have to be approximately 20% lower than the current
IMO Tier I standard. However, vessels with a keel-laid date on or after 1 January 2016 that travel in NOx ECA will require IMO Tier III certified engines. It means that another 75 %
reduction in NOx will be required for these ships.
Table 4. NOx emission limits
Tier Date NOx limit (g/kWh)
n <130 rpm 130 rpm ≤≤≤≤ n < 2000 rpm n ≥ 2000 rpm
Tier I 2000 17.0 45* n -0.2 9.8
Tier II 2011 14.4 44* n -0.23 7.7
Tier III* 2016 3.4 9* n -0.2 1.96
* in ECA
Source: MARPOL 73/78, Annex VI, Regulations for the Prevention of Air Pollution from Ships
Figure 3. NOx emissionlimits
Switch to low sulphur fuel (MGO, MDO) and its impact on costs of sea transport
To fulfil the new IMO requirements regarding sulphur a cleaner fuel will have to be used after the 1 January 2015. It is possible to use marine diesel oil (MDO) or marine gas oil (MGO) as the main fuel in the ship. MDO and MGO can by supplied with sulphur content
11 below 0.1%. Switching to such fuel only requires minor modification to a ship’s fuel system. However, in order to meet IMO requirements regarding NOx emission limits, additional
solution will have to be adopted. For example, Selective Catalytic Reduction can be used to obtain low levels of NOx emission from engine with conventional fuel.
The price of low sulphur fuel (MGO, MDO) is much higher than the price of fuel with a higher content of sulphur. And, it is very likely that the rising demand for low sulphur marine fuel will increase its price. That’s why the new IMO requirements have raised great concern that the reduction of the sulphur content in marine fuels to 0.1% by 2015 might lead to significant increase in vessels’ operational cost, which will contribute to lower competitiveness of sea transport in comparison with other modes of transport.
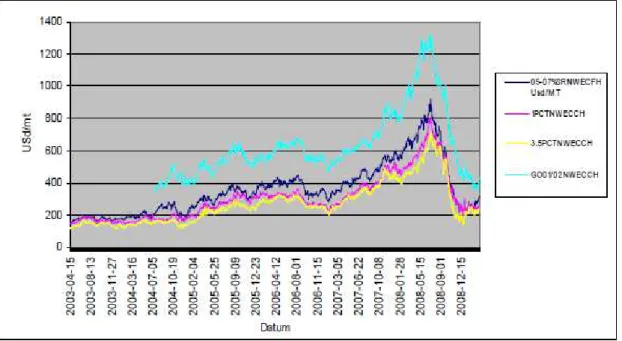
The price of ship fuel constantly fluctuate due to market forces and the cost of crude oil. As can be seen in the diagram below, the price for marine gas oil with 0.1- 0.2% sulphur by weight (light blue curve) has increased from about USD 400 per tonne in 2004 up to around USD 1,300 per tonne at mid- 2008, and then decreased to about USD 400 per tonne at the end of 2008. From 2003 to 2008 the price difference between low sulphur fuel (0.1 %) and bunker oil with higher content of sulphur (3.5 %, 1%) was almost always around USD 250-350 per tonne. The recent prices of ship fuel shows that difference between low sulphur fuel (0.1 %) and bunker oil with higher content of sulphur still falls within these limits. At present the price of IFO380 (3.5 %) is about USD 560 per tonne, LS380 (1 %) – USD 570 per tonne, MGO- 870 USD per tonne (data from February 2011). 5
Figure 4. Ship’s fuel prices evolution
Source: Consequences of the IMO’s new marine fuel sulphur regulations-Report, Swedish Maritime Administration , 2009
According to the Swedish Maritime Administration’s calculations, due to new IMO requirements fuel costs are estimated to rise of about 50-55% in 2015. The increase in fuel costs can be even higher for vessels that mostly transport goods between ports within SECA
5
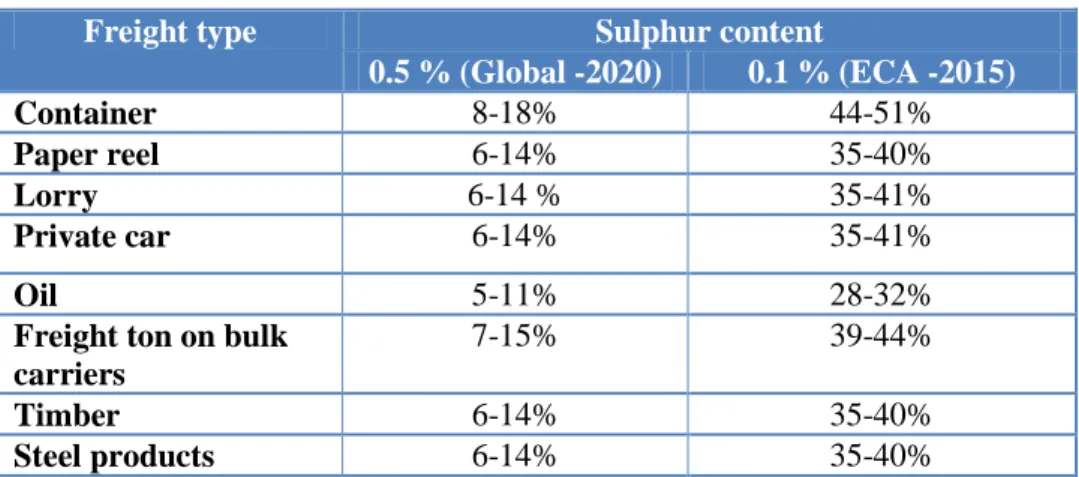
12 and it may reach 70 %. Bunker fuel costs account for 40 % -50% of the total operational costs of a ship. That’s why the more expensive fuel will have a great impact on transport cost. Analysis has been carried out on impact of changeover to low-sulphur fuel on the freight rates. In the Table 5 the estimated percentage increase in costs compared with the present price for certain types of freight is shown. Switching to low sulphur fuel may result in increasing freight rates by 28 % - 51 %. Furthermore, in the Table 6, the estimated percentage rise in freight rates of new vessels due to the use of Tier III NOx emission reduction
equipment is shown. The increase of freight rates due to NOx emission reduction equipment
will not be very significant and it may reach about 3% - 4%.
Table 5. Estimated percentage rise in freight rates of new vessels due to new sulphur limits in fuel.
Freight type Sulphur content
0.5 % (Global -2020) 0.1 % (ECA -2015) Container 8-18% 44-51% Paper reel 6-14% 35-40% Lorry 6-14 % 35-41% Private car 6-14% 35-41% Oil 5-11% 28-32%
Freight ton on bulk carriers
7-15% 39-44%
Timber 6-14% 35-40%
Steel products 6-14% 35-40%
Source: Consequences of the IMO’s new marine fuel sulphur regulations-Report, Swedish Maritime Administration , 2009
Table 6. Estimated percentage rise in freight rates of new vessels due to the use of Tier III NOx emission reduction equipment
Ship type
Size category
Small Medium Large
Container vessel 2.8 % 4.2 % 4.6%
General dry cargo vessel 2.4 % 3.6 % 3.7 %
Dry bulk vessel 3.4 % 3.3 % 3.2 %
Oil tanker 2.0 % 3.1 % 3.4 %
Ro-ro and ropax vessel 3.1 % 3.3 % 3.4%
Source: NOx emissions from ships - consequences for shipping and Baltic ports -presentation, Ulla Tapaninen, University of Turku, Centre for Maritime Studies, 2010
Significant cost increases for transportation by sea as a consequence of using the more expensive fuel will reduce competiveness of sea transport drastically and cause that, in many cases, short sea shipping will no longer be cost-effective. It is very likely that it will lead, to
13 some extent, to a modal backshift from sea to road and change the direction of logistics flows in Europe in order to avoid the SECA.
A survey concerning the modal backshift from sea to road due to sulphur levels of 0.1% in ship fuel was carried out in Sweden (the survey only concerns maritime transport in Sweden). In a report by the Swedish Maritime Administration it is clearly shown that new IMO regulations will lead to a modal backshift to roads since the transportation of goods will be more cost-efficient with lorries. However, modal backshift to roads will have a negative impact on the environment. It will contribute to increased CO2 emissions. The Swedish
Maritime Administration has shown that due to modal backshift, road transport can increase by 6% within Sweden, which corresponds to more than 300,000 tonnes of CO2.
The survey reveals that in Sweden the transfer from routes via the Port of Gothenburg to routes via the Øresund bridge is the single largest effect. In some cases, it would be more cost effective to go from northern Sweden to Germany or even to southern Europe by lorry. For shipping, the results show that a transfer of freight transport from Sweden’s east coast to west coast will take place. Moreover, in many cases, it will also be advantageous to choose the Port of Narvik in Norway instead of the ports in northern Sweden. It is also expected that the transfers from ports in northern Sweden to ports in central and southern Sweden will take place. All of this will contribute to longer transport journeys on land.
Due to new IMO regulations in the European internal market Baltic ports and shipping lines will be in a disadvantageous position. After introducing the new IMO regulations competiveness of Baltic ports will be reduced in comparison with ports in other regions of Europe. There is a probability that there will be a reduction in flow in some or even all Baltic ports. It is very likely that logistics flows in Europe will change in favour of European ports not included in the ECA (for example, Le Havre or Marseille in France or the west coast ports in the U.K.). For example, it is possible that cargo flow to and from countries of Central Europe such as the Czech Republic, Slovakia, Hungary, Austria and also the southern part of Poland will be, to some extent, taken over and handled by Mediterranean ports. However, it is only a hypothetical scenario, and no one really knows how significant the changes in directions of logistics flows in Europe would be.
LNG as an alternative ship’s fuel
New regulations on emissions of sulphur oxides (SOx) and nitrogen oxides (NOx) within the
Baltic Sea have recently increased the interest in and demand for alternative fuels. Liquefied Natural Gas (LNG) as an alternative fuel is currently the most popular option. Using LNG instead of oil considerably lowers the emissions of SOx and NOx. When ships are fuelled with
LNG, no additional abatement measures are required in order to meet the ECA requirements. LNG has been used as marine fuel since 2001. Norway has been the forerunner for LNG – powered ships. Currently, about 20 LNG-fuelled ships are being operated in Norwegian waters. LNG ships that are in use in Norway today, ranging from coast guard boats and supply vessels to ferries.
Natural gas is the cleanest form of fossil fuels. It consists of methane with minor concentrations of heavier hydrocarbons such as ethane and propane. The burning process of
14 natural gas is clean. LNG contains virtually no sulphur; hence SOx emissions from natural gas
engines are reduced by close to 100%. The particle emission is also reduced by close to 100%. Moreover, burning LNG produces 85%-90% less NOx than conventional fuel and
greenhouse gas emissions are reduced by 15-20%.6 Table 7 compares SOx, NOx, PM, and
CO2 emissions from LNG and liquid petroleum fuels.
Table 7. Estimated emissions to air from LNG and liquid petroleum fuel for ships. *
Fuel type SOx (g/kWh) NOx(g/kWh) PM(g/kWh) CO2(g/kWh)
Residual oil 3.5 % sulphur 13 9-12 1.5 580-630
Marine diesel oil, 0.5 % sulphur 2 8-11 0.25-0.5 580-630
Gasoil, 0.1 % sulphur 0.4 8-11 0.15-0.25 580-630
Natural gas (LNG) 0 2 0 430-480
*Emissions related to engine output in kWh. Typical medium speed engines built after year 2000 without exhaust cleaning. Emissions vary with fuel quality and engine type.
Source: Maritime Gas Fuel Logistics. Developing LNG as a clean fuel for ships in the Baltic and North Seas, MAGALOG, December, 2008.
There is currently much research being made on ships propelled by LNG. For example, replacing a conventional passenger ferry in Norway to a LNG-powered vessel would be equivalent to taking 160,000 cars out of traffic as far as NOx emissions are concerned.7
Many manufactures are offering LNG-fuelled engines already. Gas engines which are currently available on the market can be divided into two main categories: dual fuel engines (e.g. Wärtsilä, Man), lean-burn gas engine (e.g. Rolls-Royce, Mitsubishi). These engines have varying characteristics and levels of efficiency. The dual fuel engine runs on both LNG and conventional fuel. It is a flexible solution when the availability of LNG fuel is uncertain (e.g. the lack of LNG bunkering stations). Whereas, the lean burn mono fuel engine gives a simpler installation onboard and is a more suitable solution for ships operating in regions with a developed grid of LNG bunkering stations.
There are major challenges to the widespread implementation of LNG as ship fuel. One of the main challenges is that a lot of room is required onboard for LNG tanks and this contributes to a loss of cargo space. For example, LNG requires about 1.8 times more volume than MDO (marine diesel oil) with an equal energy content. If we add tank insulation, the needed volume is about 2.3 times higher.8 For new-buildings it is quite simple to find space for the larger fuel tanks, while this may be much more difficult, or even impossible, to find it on ships which are already in operation. That’s why there is very little probability that existing ships will be using LNG instead of conventional fuel. It is more likely that LNG as marine fuel will be used by new-buildings.
6 Greener Shipping in the Baltic Sea, DNV, June2010.
7 J. Hansson, LNG As an Alternative Energy Supply in Sweden, Lund University, 2008. 8
Natural gas for ship propulsion in Denmark - Possibilities for using LNG and CNG on ferry and cargo router, Danish Ministry of the Environment, 2010.
15 Moreover, it has to be noticed that in order not to lose much cargo space, the operational range due to bunker capacity of the vessel must be reduced. Therefore, LNG is a fuel alternative basically for vessels which can be re-fuelled quite often. Hence, this fuel alternative is not suitable for large vessels engaged in deep-sea shipping. LNG as ship fuel is most convenient for short sea shipping and such ships as ro-ros and ferries. That’s why more investment in LNG-powered ships is expected in this segment.
MARINTEK carried out studies which indicate that additional costs for a gas-fuelled ship will be 10-15% of the total cost of a conventional ship. It can be estimated that for a typical ro-ro ship of 5,600 DWT, the additional cost would be about EUR 3.2 million. This additional cost is connected mainly with the large LNG tanks and fuel piping system.9
However, according to DNV, a switch to LNG power could potentially save 35% on a vessel’s total operational costs over a 10-year period compared to MGO. In turn, over a 20-year period, a switch to LNG power could potentially save 45% on a vessel’s total operational cost compared to MGO.10
Port infrastructure for distribution of LNG to ships
To offer LNG as a fuel to ships, infrastructure for distribution of LNG fuel in the Baltic Sea region must be established. This infrastructure should consist of small scale LNG terminals designed specifically for bunkering purposes from which LNG can be delivered to ships by truck, permanent filling lines or barge. An LNG terminal serving bunkering operations must provide three basic functions11:
1. Receipt of LNG, most likely by ship delivery (small scale LNG shuttle vessel e.g. 20,000 m3 from a local large LNG import terminal which would serve as a hub to such bunker stations), but also with the possibility of truck delivery.
2. Storage for a quantity of LNG which will allow for the required bunkering operations with suitable delivery intervals.
3. Supply of LNG for the required bunkering operations; i.e. bunkering by truck, barge or permanent filling line.
Below the exemplary supply chain of LNG fuel is presented. It includes large scale and local LNG terminals.
9 Maritime Gas Fuel Logistics. Developing LNG as a clean fuel for ships in the Baltic and North Seas, MAGALOG, December, 2008.
10 The age of LNG is here. Most cost efficient solution for ECAs, DNV presentation, June 2010. 11
Maritime Gas Fuel Logistics. Developing LNG as a clean fuel for ships in the Baltic and North Seas, MAGALOG, December, 2008.
16 Figure 5. Gasum’s supply chain for LNG fuel.
Source: LNG bunkering in ports of Finland – presentation, Pasi Torri, 2010
The choice of location for an LNG terminal for bunkering purposes depends both upon where potential users of LNG are and where there are areas available. LNG is considered an alternative fuel mainly for ships operating in liner services (such as ro-ro ships, ferries and feeder container vessels). Hence, LNG terminals for bunkering purposes should be constructed in locations where the most dense liner services are.
More than 30 LNG receiving and storage terminals are in operation along the coast of Norway. 13 of these are available for fuelling ships and the number of such terminals in Norway is growing. The cost of LNG terminals for bunkering purposes can be seen in similar recent investments in Norway. One example is the terminal under construction in Sarpsborg. The terminal’s capacity is 3,500 m3 and the investment cost is about EUR 11 million. Another terminal will be built by Mols-Linien in Sjællands Odde. It will have a capacity of 5,000 m3 and the investment cost is estimated at EUR 13.5 million. 12
Depending on the circumstances in the bunkering terminal and the quantities of LNG to be supplied, two types of bunkering are currently being used for LNG-propelled vessels in Norway:
1. Bunkering from fixed filling lines. 2. Bunkering from tanker trucks.
Bunkering directly from fixed onshore tanks is the most relevant option if ships can be bunkered normally at one location, and there is available space to install LNG tanks. In this case, LNG is transferred from the storage tanks to the ship via an insulated pipeline. The distance between the storage tanks and the quay should be as short as possible in order to minimise boil-off. A distance of 250 m is indicated as a maximum13. If an LNG terminal for
12 Natural gas for ship propulsion in Denmark - Possibilities for using LNG and CNG on ferry and cargo router, Danish Ministry of the Environment, 2010.
13
Maritime Gas Fuel Logistics. Developing LNG as a clean fuel for ships in the Baltic and North Seas, MAGALOG, December, 2008.
17 bunkering purposes cannot be constructed close enough to the berth of ships to be bunkered, then it would require that ships relocate to another berth near such a terminal.
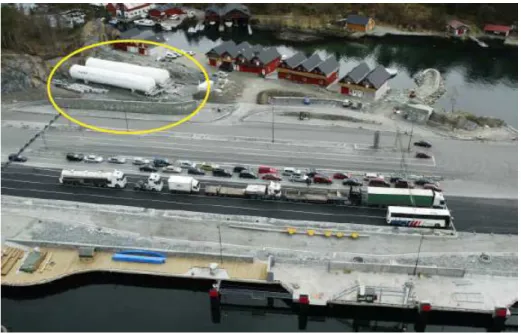
At three of the 13 Norwegian LNG terminals available for fuelling ships, LNG is delivered to ships by fixed filling lines from fixed onshore tanks (Kollsnes production plant, CCB Ågotnes Offshore base and Halhjem ferry quay). For example, at Halhjem ferry port, there are two LNG tanks with a capacity of 500 m3 each. For transfer of LNG from the storage tanks to the ship, a 150 m long insulated pipeline is used. The connection of the shore pipe system to a ship’s fuel tank system occurs via a flange. LNG-propelled ferries calling at Halhjem have two LNG fuel tanks with a capacity of 120 m3 each. With the pumping capacity and tank pressure conditions installed at Halhjem, bunkering occurs at around 100 m3 per hour.
Figure 6. The LNG terminal for bunkering purpose at the Halhjem ferry quay Source: The MAGALOG project- LNG fuelled shipping in the Baltic Sea - presentation
Figure 7. The Halhjem ferry quay
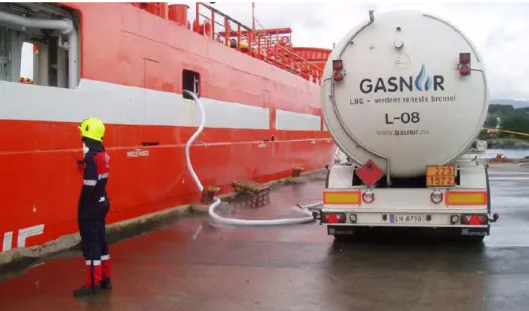
18 Good distribution ways of LNG as fuel for the ships is a very important issue for ship owners. However, it doesn’t necessarily mean that the LNG terminal has to be a bunker station for every ship. There are possibilities for distributing LNG by land transport as well. This solution assumes that a vessel is being bunkered at berth directly from a tanker truck (Figure 8). LNG can be loaded onto a tanker truck at the point of supply and then transported to the point of bunkering. However, the driving distance from the point of supply to the point of bunkering should be suitable. This suitable distance is not defined and depends on the quantities and regularity of LNG to be supplied. However, the distance should be short if quantities are large. A tanker truck can deliver 55 m3 of LNG. It means that several tanker trucks are needed to deliver fuel to a large LNG-propelled ferry (two tanks with a capacity of 120 m3 each), if necessary. The bunkering operation from one track usually lasts about 1.5 hours.
Figure 8. Bunkering of the vessel form tanker truck.
Source: Feasibility study on LNG infrastructure for Short Sea Shipping, Gasnor presentation, May 2006.
Apart from the two abovementioned LNG bunkering solutions, a third option is also being considered - barge to ship bunkering. Bunkering by barge could be more suitable for relatively large quantities and could be carried out at different locations around the harbour area. However, it is dependent on having a nearby LNG terminal.
Planned LNG import and distribution terminals in the Baltic Sea region – part of the future supply infrastructure for LNG fuel.
A number of LNG terminals are planned or considered to be constructed in the Baltic Sea region in the near future. Plans assume construction of large import terminals as well as smaller terminals for local LNG distribution. The location of proposed LNG terminals, LNG terminals, or those under construction, is shown on the map below. Around the Baltic Sea region three LNG import terminals are already under development – a large scale LNG
19 terminal in Świnoujście (Poland), a small scale LNG terminal in Nynäshamn (Sweden) and a small scale LNG terminal in Gothenburg (Sweden). In Finland there are plans to construct two small scale LNG import terminals: in Porvoo in the vicinity of a new liquefaction plant and in Turku/Naantali. A large scale import terminal is planned in Inkoo, where the Baltic Connector offshore pipeline will be entering Finland. The construction of large scale LNG terminals in order to diversify energy sources and reduce energy dependence on Russia is considered by other Baltic countries (Lithuania, Latvia, Estonia). Each from these three countries plans to build its own LNG terminal. However, three large scale LNG terminals in close vicinity will certainly be too many. That’s why it is very likely that only one large scale LNG terminal will be established for these three countries.
Figure 9. Proposed LNG import terminals in the Baltic Sea region
The planned LNG terminals shown in Figure 9 could be considered as part of the future supply infrastructure for LNG fuel. The proposed large scale terminals could be potential hubs for LNG fuel because they will be capable of receiving full-size LNG vessels. The proposed small scale terminals could be potential bunker stations.
20
3. New regulations for sewage discharge from passenger ships -
how ports can prepare for this
Ferries and cruise ships operating in the Baltic Sea carry over 80 million passengers per year. Large amounts of sewage produced on these kinds of ships are discharged into the Baltic Sea. Dumping a ship’s sewage directly into the Baltic Sea has a negative impact on the marine environment. Sewage from ships has a very high concentration of organic matter and nutrients. The wastewater produced annually on ferries and cruise ships operating in the Baltic Sea is currently estimated to contain 460 tonnes of nitrogen and 150 tonnes of phosphorus.14 These substances contribute to eutrophication of the sea. Eutrophication is considered a major problem in the Baltic Sea. It causes many negative effects such as intensified algal blooms, murky water, oxygen depletion and lifeless sea bottoms.
The Baltic Sea as a special area for sewage discharge from ferries and cruise ships
IMO and HELCOM plan to establish special areas for the prevention of pollution by sewage in MARPOL Annex IV. A proposal to designate the Baltic Sea as a special area for sewage discharge from ships, especially from passenger ships, was identified in the HELCOM Baltic Sea Action Plan (BSAP), adopted by the Baltic Sea countries and the European Commission in 2007. In 2009 and 2010 HELCOM Contracting States submitted a joint proposal to IMO to designate the Baltic Sea as a special area in Annex IV to the MARPOL Convention where more stringent discharge regulations would apply for passenger vessels than in other sea areas of the world. The proposal was approved by the 61st Session of IMO Marine Environment Protection Committee (27 September – 1 October 2010) with the view to adopt it by MEPC 62.
According to the new regulations, dumping sewage from passenger vessels into the Baltic Sea will no longer be allowed unless the ship uses an approved sewage treatment plant capable of reducing nutrients (nitrogen and phosphorus). Alternatively, the passenger ship may deliver sewage to a port reception facility (PRF). Dumping of untreated sewage from passenger ships may become illegal for all new ships from 2013, and from 2018 for all ships. However, the entering into force of stricter regulations for sewage discharges from passenger ships depends on the availability of adequate port reception facilities. New regulations will become effective only when HELCOM countries notify IMO that adequate port reception facilities are available in the Baltic Sea. It is estimated that about 63% of the total theoretical nutrient contained in a ship’s sewage dumped into the sea would be eliminated if all passenger ships operating in the Baltic Sea area would discharge all sewage into port reception facilities, or use an effective sewage treatment system capable of reducing nutrients from sewage.15
According to HELCOM, “adequate port reception facilities” means facilities that meet the needs of ships using them, and don’t cause delays to ships. Adequacy of port reception facilities for sewage in ports mostly depends on the passenger traffic volume and the size and kind of the passenger vessels visiting the port. “Adequate port reception facilities” can be different for ports visited only by ferries and ports visited by ferries and cruise ships. The average duration of a ferry voyage is much shorter than the duration of a cruise voyage. It
14
http://wwf.panda.org/what_we_do/where_we_work/baltic/?uNewsID=190942 (09.02.2011). 15
Sewage discharges from shipping – proposed new means, Stakeholder Conference for HELCOM’s Baltic Sea Action Plan, Jorma Kämäräinen, Kotka, 2010.
21 means that smaller amounts of sewage are produced during the ferry voyage than during a cruise voyage. Sewage from ferries can be effectively handled by tank trucks. Therefore, in passenger ports with only ferry traffic, discharge of sewage to tank trucks of sufficient capacity can be considered adequate. Passenger ports, visited by large cruise liners should be equipped with port reception facilities able to receive much larger quantities of sewage at one time. In this case, according to HELCOM, “adequate port reception facilities” should mean the direct discharge of sewage from a ship to municipal sewage systems at quays where passenger ships berth.
Moreover, in order to encourage the use of port reception facilities, a “no-special fee” system for the delivery of ships generating oily wastes, garbage and sewage has been designed. The “no-special fee” system is defined as a “charging system where the cost of reception, handling and disposal of ship-generated wastes, originating from the normal operation of the ship, is included in the harbour fee or otherwise charged to the ship irrespective of whether wastes are delivered or not.”16 However, not every Baltic passenger port has implemented the “no-special fee” system.
HELCOM established a Cooperation Platform on Port Reception Facilities in the Baltic Sea in order to promote a dialogue on the provision of adequate port reception facilities for sewage in passenger ports of the Baltic Sea among key stakeholders. They include Baltic Sea passenger ports, the shipping industry, especially cruise lines, national administrations and municipal wastewater treatment plants. Moreover, the Cooperation Platform’s aim is to exchange experiences on good practices in planning, implementing and operating PRF for sewage, provide guidance on how to upgrade PRF in the first priority ports, promote harmonized regional implementation of the “no-special fee” system for sewage delivery.
Cruise ships’ traffic at Baltic ports
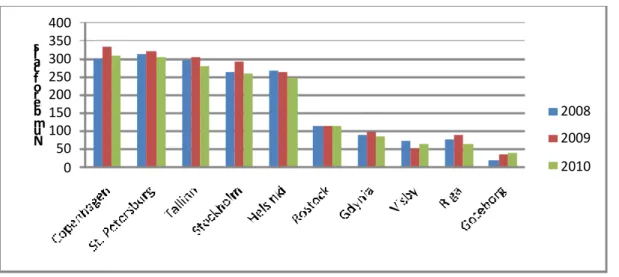
The Baltic Sea receives many cruise ships each year (in 2010 approximately 70 cruise ships).17 In 2010 the number of cruise ship calls was 1,840 and the number of passengers visiting Baltic cruise ports was approximately 2.8 million.18 Wastewater produced by cruise ships visiting the Baltic Sea account for 25% of all ships’ wastewater in the Baltic Sea. The wastewater produced on these vessels is estimated to contain 113 tonnes of nitrogen and 38 tonnes of phosphorus.19
On the Baltic Sea, there are about 25 cruise ports. At present, three out of these cruise ports can serve as good examples on how PRF can be arranged in order to meet the needs of cruise vessels in terms of sewage discharge (fixed link to the sewage system and treatment in the municipal wastewater treatment plant): Helsinki, Stockholm, St. Petersburg. These three ports are among the biggest Baltic cruises ports. It is estimated that the five biggest Baltic cruise ports (St. Petersburg, Copenhagen, Tallinn, Stockholm, and Helsinki) receive 80% of sewage from cruise ships (Figure 12).
16
http://www.helcom.fi/Recommendations/en_GB/rec28E_10/ (9.02.2011).
17 http://www.cruisebaltic.com/media(1329,1033)/Cruise_Business_Review_article_1_2010.pdf (9.02.2011). 18 Cruise Baltic statistics: http://www.cruisebaltic.com/composite-682.htm (data from 25 Baltic cruise ports, without 2 Norwegian ports).
19
22 Figure 10. Top 10 Baltic Cruise ports - number of cruise ships calls in 2008,2009,2010 Source: Cruise Baltic Statistics, http://www.cruisebaltic.com/composite-22.htm (9.02.2011)
Figure 11. Top 10 Baltic Cruise ports in – number of passengers in 2008,2009,2010 Source: Cruise Baltic Statistics, http://www.cruisebaltic.com/composite-22.htm (9.02.2011)
Figure 12. Cruise sewage by port.
Source: Sewage discharges from shipping – proposed new Means – presentation, Jorma Kämäräinen, 2010 0 50 100 150 200 250 300 350 400 N u m b e r o f c a ll s 2008 2009 2010 28% 15% 13% 13% 13% 6% 4% 2% 2% 2% St. Petersbur g Copenhag en Talli nn Stock holm Hel sinki Rostock Gdynia Vi sby Rig a Other 0 100 000 200 000 300 000 400 000 500 000 600 000 700 000 800 000 N u m b e r o f p a ss e n g e rs 2 008 2 009 2 010
23
First and second priority ports with regard to upgrading port reception facilities for sewage
First and second priority ports with regard to upgrading port reception facilities for sewage are indentified in the Road Map adopted by the 2010 HELCOM Moscow Ministerial Meeting. A list of these ports is presented in Table 8. Some of these ports, like Gdynia and Riga, are smaller than many other passenger ports in the Baltic Sea, however, they are important to address as they are visited by large cruise liners. According to HELCOM’s Road Map, in the first priority ports upgrading of port reception facilities to a standard adequate for large passenger ships will be necessary. The second priority passenger ports should be investigated if they need upgrading of their port reception facilities in order to meet new requirements. However, ports currently recognized as having adequate port reception facilities should also be verified. Upgrading of port reception facilities is scheduled to be finalized by 2013 or by 2015 at the latest.
Table 8. First and second priority ports with regard to upgrading reception facilities for sewage (PRF) according to the HELCOM’s Road Map for upgrading PRF .
Port No of ferry passengers in 2009 [million]a No of cruise passengers in 2009 and 2010b Arrangement of port reception facilities for sewage (2010)
Application of the “no-special- fee” system for sewage delivery (2010)
First priority ports
Tallinn (EE) 7.2 2009: 415 575
2010: 390 000
Tankers and tank trucks, no direct discharge to sewer system
Yes
Waste fee charged on every ship with some exceptions. Sewage exceeding 7m3 subject to extra payment.
Rostock (DE) 2.1 2009: 160 000
2010: 222 000
Tankers, no direct discharge to sewer system Yes Copenhagen (DK) 2008: 1.4 2009: 675 000 2010: 662 000 Tankers, no direct discharge to sewer system
Yes
Riga (LV) 0.7 2009: 69 413
2010: 58 248
Tank trucks, no direct discharge to sewer system
Not applied to sewage from passenger ships, which are charged at fixed rates per m3
Gdynia (PL) 0.4 2009: 134 884
2010: 125 005
Tank trucks, no direct discharge to sewer system
1/3 of all delivered amount of sewage from ferries and cruise chips without additional fee Helsingør
(DK)
9.4 - Possibility for direct
discharge to sewer system. However the companies mostly deliver sewage to Helsingborg.
Yes
Rodby Faergehavn (DK)
2008: 6.8 - Direct discharge to sewer system.
Yes
Świnoujście
(PL)
0.5 - sewage is currently carried
by the tank cars which transport sewage to municipal WWTP
24
Second priority ports Helsingborg
(SE)
9.4 2009: 25 987 2010: 15 648
Tank trucks are available. The quay visited by ferries between Helsingborg-Helsingör has its own direct connection to the municipal sewage system.
Yes
Friedrikshavn (DK)
1.8 - Direct discharge to sewer
system.
Yes
Gedser (DK) 1.5 - Direct discharge to sewer
system
Yes
Turku (FI) 3.1 2009: 2736
2010: 2000
Fixed PRF directly to municipal sewer in two quays, Yes Mariehamn (FI) 2009: 2426 2010:5312 Fixed PRF to municipal sewer available at all quays; max. discharge rate: 30-40 m3/h.
Yes
Kiel (DE) 1.5 - sewage can be transferred
directly into
the municipal sewage treatment plant. The seaport has
separate suction devices and takes only a transit function.
Yes
Ystad (SE) 1.8 - Tank trucks are available;
Currently
investigating installation of a direct connection to the municipal sewage system.
Yes
Gothenburg (SE)
1.7 2009: 35 398 2010: 51730
Some quays have a direct connection to the municipal sewage system. In other cases, tank trucks are used
Yes
Trelleborg (SE)
1.6 - Direct discharge to
municipal sewage system available at
2 quays.
Yes
Source: Roadmap for upgrading the availability of port reception facilities for sewage in major passenger ports, HELCOM, 2010; INTERPRETATIONS OF, AND AMENDMENTS TO, MARPOL AND RELATED INSTRUMENTS Proposal to amend MARPOL Annex IV to include the possibility to establish Special Areas for the prevention of pollution by sewage and to designate the Baltic Sea as a Special Area under Annex IV – Supplementary information requested by MEPC 60, Marine Environmental Protection Committee 2010
a Baltic Maritime Ranking 2010, M. Matczak, in Baltic Transport Journal, 4/2010; b Cruise Baltic Statistics, http://www.cruisebaltic.com/composite-22.htm (9.02.2011)
It has to be noted that many Baltic ports are sceptical about upgrading sewage reception facilities for ships. They are not sure if the investment in sewage reception facilities will be proportional to the environmental effect. As yet, there are no regulations which make upgrading a port’s sewage reception facilities obligatory. This is why Baltic ports claim that upgrading reception facilities should be voluntary and it should be their own choice. On the other hand, ports’ reception facilities are not the only solution for preventing sea pollution by sewage from ships. For example, the passenger shipping industry could invest in onboard sewage treatment plants, which would make ships less dependent on reception facilities in Baltic Sea ports.
25
Investing in sewage reception facilities
In Copenhagen a new cruise-ship quay is going to be built. The quay will be 1,100 m long and 70 m wide. Construction works are scheduled to commence at the end of 2011. The new cruise-ship quay is expected to be in use from April 2013. The new quay will be equipped with sewage reception facilities; its cost is estimated to be EUR 2.7 million. The Port of Rostock, until the 2012 cruise season, will invest around EUR 1.7 million in reception facilities for ship sewage at the cruise berths and its connection with the public sewerage system. In the Port of Helsinki all berths (including ferries, cruise vessels and cargo vessels berths) are equipped with sewage reception facilities. The receiving capacity of the sewage system is approximately 100 m3/h. The estimated cost of sewage reception facilities in two locations in the Port of Helsinki is presented in the table below. For comparison, the estimated cost of an onboard sewage treatment plant for large vessels is EUR 5 million.20
At present Port of Gdynia aim to equip two quays (Bułgraskie and Szwedzkie quay) with the sewage reception facilities. However, there are plans that in the future all quays will be equipped with sewage reception facilities. The port of Szczecin – Świnoujście intends to
upgrade its system of sewage reception. Two options are considered – to modernize existing treatment plant in the port area (currently the installation has very limited technical capacities and is not ready to accept sewage from passenger ships) or to connect sewage system directly to the municipal WWTP.
Table 9. Estimated cost of sewage reception facilities in some ports.
Port Localization of sewage
reception facilities Estimated cost of sewage reception facilities Status of sewage reception facilities
Copenhagen New cruise quay (four berths)
2.7 million EUR To be constructed (until 2013)
St. Petersburg New ‘Marine Facade’ cruise port
2.3 million EUR Already in place
Rostock –
Warnemünde
Cruise quay 1.7 million EUR To be constructed (until 2012)
Helsinki
2 quays in Katajanokka 0.5 million EUR Already in place
new cruise berth in West Harbour (450 m)
0.2 million EUR Already in place
Source: Port reception facilities for cruise sewage in the Baltic Sea – presentation, Bain and Company, 2010; http://www.rostock-port.de/en/news/deitalview/article/cargo_handling_gathers_momentum_again/67.html
(22.02.2011)
4. Ballast Water Management
The spread of alien species within the Baltic Sea
Over 120 alien species have been identified in the Baltic Sea. Some of them have been introduced on purpose, for fishing. However, most of them have been carried accidentally in
20
26 ships’ ballast waters. Many of these non-native species reproduce rapidly and contribute to disadvantageous changes in the structure of the Baltic Sea’s ecosystem and bring about serious ecological and economic losses. Most of these alien species originate from freshwater or brackish-water environments. Examples of the Baltic Sea’s non-native species are: round goby (neogobius melanostomus), fishhook waterflea (cercopagis pengoi), and Chinese mitten crab (eriocheir sinensis).
Round goby (neogobius melanostomus) – this species naturally occurs in waters of the Black Sea, Caspian Sea, Marmara Sea and Sea of Azov. In the Baltic Sea, for the first time, it was recorded in 1990 in the area of the Gulf of Gdańsk. However, nowadays, it is observed in
many other regions of the Baltic Sea. An increase in the number is very disadvantageous for the Baltic Sea’s ecosystem. This species is becoming a serious competitor for food with the native species.
Figure 13. Round goby (neogobius melanostomus). Source: http://pl.wikipedia.org/wiki/Babka_bycza (22.02.2011). Chinese mitten crab (eriocheir sinensis) - their area of origin are waters in the temperate and tropical regions between Vladivostok and South-China, Japan and Taiwan. Their native habitat is the Yellow Sea. The first introduction into Baltic Sea waters probably happened in the beginning of the 20th century. Chinese mitten crabs cause damages on dykes and other coastal protection. In addition they cut fishing nets and release fish causing losses to the fishing industry.
Figure 14. Chinese mitten crab (eriocheir sinensis). Source: http://www.corpi.ku.lt/nemo/ericho.html (22.02.2011).
Fishhook waterflea (cercopagis pengoi) - this species naturally occurs in the Ponto-Caspian region: the Caspian Sea, Sea of Azov and Aral Sea. The first specimen in the Baltic Sea was recorded in 1992 in the area of the Gulf of Finland and the Gulf of Riga. Fishhook waterfleas found almost no obstacles in spreading throughout the Baltic Sea. This species has a negative impact on the Baltic ecosystem and causes losses to the fishing industry. It clogs fishing nets and competes with herring for zooplankton prey. Figure 15. Fishhook waterflea (cercopagis pengoi). Source: http://www.corpi.ku.lt/nemo/cercopag.html (22.02.2011).
27
International Convention for the Control and Management of Ships Ballast Water & Sediments
Alien species which are transferred into marine ecosystems through ballast water have become a very serious problem in many regions of the world. In order to reduce spreading of non-native species regionally and worldwide the International Convention for the Control and Management of Ships Ballast Water & Sediments was adopted by at the International Diplomatic Conference held at IMO Headquarters in London in February 2004. The Convention will enter into force one year after ratification by 30 states, representing 35 per cent of world merchant shipping tonnage. As of October 2010, 27 states have ratified the Convention, representing 25.32% of world merchant shipping tonnage.
The Convention introduces specific requirements for ballast water management which will apply to different vessels at different times depending on their ballast water capacity and construction date. The Convention foresees two standards of ballast water management: ballast water exchange and ballast water performance. Whenever possible, the exchange procedure should be carried out at least 200 nautical miles from the nearest land and in water at least 200 m in depth. If this is not possible for operational reasons then such exchange should be undertaken as far from the nearest land as possible, but at least 50 nautical miles from the nearest land in waters of at least 200 m in depth. However, due to limited biological efficiency the exchange standard is regarded as an interim measure. The performance standard is connected with having an onboard ballast water treatment system which should be approved by the administration.
The convention also requires that each ship shall have on board a Ballast Water and Sediment Management Plan approved by the administration. All ships will be obliged to carry out ballast water management procedures to a given standard and maintain a Ballast Water Record Book in order to record each operation connected with ballast water (when the ballast waters are taken on board and when they are discharged, etc.). Moreover, each state which ratifies the Convention should ensure that ports and terminals, where cleaning or repair of ballast tanks takes place, are equipped with adequate facilities for the reception of sediments. Such reception facilities shouldn’t cause undue delay to ships and should provide for the safe disposal of such sediments which doesn’t cause damage to the environment.
Sweden so far is the only Baltic country which has ratified the Ballast Water Management Convention. All the remaining Baltic countries have agreed to ratify it by 2013 at the latest. Most of the other Baltic countries have already started the ratification process.
It has to be mentioned that the Convention’s requirements concerning the distance from the nearest land where ballast water can be exchanged, cannot be met within the Baltic Sea. For such cases, the Convention foresees that special areas for Ballast Water Exchange could be designated. HELCOM in its Ballast Water Road Map, adopted as part of the HELCOM Baltic Sea Action Plan, indicates the need for investigating whether and where ballast water exchange zones could be designated in the Baltic Sea. It has to be mentioned that species are likely to spread within the Baltic Sea on their own. Several factors, for example, salinity and temperature, can limit their natural range of dispersal. However, the HELCOM HOLAS Project results revealed that most of the alien species in the Baltic Sea have a wide tolerance to salinity. Bearing in mind the other environmental factors determining species’ dispersal, it can be stated that Water Exchange zones within the Baltic Sea would only have limited
28 applicability – for example for voyages on selected routes within the Baltic Sea assessed as posing a high risk of spreading alien species that could be reduced by conducting BWE. (e.g. routes between fresh water ports separated by more saline waters and situated in different sub-basins).21
Voluntary ballast water exchange outside the Baltic and North Seas
HELCOM together with OSPAR have undertaken an initiative to avoid ballast water exchange within Baltic Sea and OSPAR areas. They developed the General Guidance on the Voluntary Interim application of the D1 Ballast Water Exchange Standard in the North-East Atlantic and the Baltic Sea, which has been applicable since 1 April 2008. According to the Guidance, the vessels transiting the Atlantic or entering the areas of OSPAR or passing through the OSPAR area and heading to the Baltic Sea from routes passing the West African Coast are requested on a voluntary basis to carry out ballast water exchange before entering the OSPAR area and Baltic Sea. What’s more, the release of sediments should not take place within 200 nm of the coastline of the North-East Atlantic or within the Baltic Sea. HELCOM together with OSPAR also developed the General Guidance on the Voluntary Interim application of the D1 Ballast Water Exchange Standard by vessels leaving the Baltic Sea and transiting through the North-East Atlantic to other destinations. According to this Guidance, as of 1 January 2010, ballast water will not be exchanged in the Baltic Sea or until a vessel is 200 nm off the coast of North-West Europe and in waters deeper than 200 m.
21
HELCOM activities related to the transfer of Alien Species in the Baltic Sea, 12th Global Meeting of the Regional Seas Conventions and Action Plans, Norway, 2010.
29
Summary
One of the regulations which may bring about the most significant consequences for ports is the new IMO regulation concerning a reduction in SOx emissions from ships. It may have a
great impact on Baltic ports and place them in a disadvantageous position. From 2015 vessels operating in the Baltic Sea will be obliged to use fuel with a sulphur content not exceeding 0.1%. Using more expensive fuel will result in significant cost increases for transportation by sea. The competiveness of sea transport will be reduced drastically and, in many cases, short sea shipping will not be cost-effective. It is very likely that it will lead, to some extent, to a modal backshift from sea to road. What’s more, a change in direction of logistics flows in Europe may be expected. After introducing the new IMO regulations Baltic ports will be in a low competing situation in comparison with ports in other regions of Europe. It is very likely that the logistics flow in Europe will change in favour of European ports not included in the ECA.
New IMO regulations concerning a reduction in NOx emission from ships will definitely have
a lower impact on ports than regulations concerning SOx emission reduction. To meet the new
rules some investments on board ships will be required. However, the cost increases of sea transport due to NOx emission reduction equipment will not be very significant.
The SOx and NOx emission reduction requirements may also bring about other challenges for
ports. It is very likely that in the near future LNG will be used as ship fuel within the Baltic Sea. It will be necessary to establish the infrastructure for distribution of LNG fuel in the Baltic Sea region. This infrastructure should consist of small scale LNG terminals specifically designed for bunkering purposes.
Another important regulation is connected with sewage discharge from ferries and cruise ships. IMO and HELCOM plan to establish the Baltic Sea as a special area where sewage discharge to the sea will no longer be allowed unless the ship uses an approved sewage treatment plant capable of reducing nutrients. Alternatively, a passenger ship may deliver sewage to a port reception facility (PRF). This regulation may be associated with the necessity of revising ports’ sewage reception facilities and even with upgrading port reception facilities to an adequate standard.
In conclusion, the upcoming environmental regulations for shipping in the Baltic Sea bring about consequences not only for the shipping industry but also for ports. These consequences may be associated with necessary investments or even with some losses for Baltic ports.