Was it worth it?
Do low-income New Zealand student loan
borrowers increase their income after
studying for a tertiary qualification?
This report forms part of a series called Beyond tertiary study.
Other topics covered by the series include how graduates’ earnings change over time, labour market outcomes, education and economic growth, and qualifications and income.
Author
Ralf Engler, Senior Research Analyst Email: ralf.engler@minedu.govt.nz Telephone: 04-463 7039
Acknowledgements
The author gratefully acknowledges comments provided by Roger Smyth, Anne Haase, Zaneta Park, Nancy Chu, Paul Mahoney, Warren Smart, (all from Ministry of Education), Charlotte Defeijter (Ministry of Social Development). The author would especially like to thank Isabelle (Izi) Sin (Motu Economic and Public Policy Research) and Sarah Crichton (Ministry of Business, Innovation and Employment). The author also gratefully acknowledges the assistance provided by StatisticsNZ micro-data laboratory staff.
All views expressed in this report, and any remaining errors or omissions, remain the responsibility of the author.
Published by
Tertiary sector performance analysis
Graduate achievement, vocations and careers MINISTRY OF EDUCATION
© Crown Copyright
This work is licensed under the Creative Commons Attribution 3.0 New Zealand licence.
You are free to copy, distribute and adapt the work, as long as you attribute the work to the copyright holder and abide by the other licence terms. To view a copy of this licence, visit www.creativecommons.org/licenses/ by/3.0/nz/.
This report is available from the Ministry of Education’s Education Counts website: www.educationcounts.govt.nz.
June 2014
Was it worth it?
1 Summary 4
2 Introduction 8
3 How income changes for low-income students after studying for a tertiary
qualification 11
4 Post-completion income distributions 21
5 Other considerations 28
5.1 People in their fifties 28
5.2 Subject of the qualification 29
5.3 Type of job or industry of employment 29
5.4 Type of tertiary study, full-time or part-time 29
5.5 Previous qualifications attained 30
5.6 Size of student loan 30
5.7 Ease of repayment 31
5.8 Type of benefit 31
5.9 Length of time on a benefit 32
5.10 Labour market and economic conditions 33
5.11 Unobserved factors that might be correlated with income 35
6 Confidentiality of data 36
1
SUMMARY
KEY POINTSThis report looks at student loan borrowers living in New Zealand 20 to 50 years of age with pre-study incomes below the student loan repayment threshold.
The average incomes of these New Zealand student loan borrowers, and their rate of increase in income, are higher if they complete a higher-level qualification like a diploma or bachelors degree, compared to those who complete a certificate-level qualification.
Women generally have lower average graduate incomes, and lower rates of increase in their income compared to men, although older women completing bachelors degrees have higher income trajectories than their male counterparts.
Those on a benefit, indicating some difficulty in accessing the labour market, generally have smaller increases in income on completing the same level of qualification, and relatively flat rates of increase in income after graduating, compared to those not on a benefit, on average.
Younger graduates generally have higher rates of increase in their incomes than older graduates, on average.
Average incomes increase with time, generally.
These factors and their interactions are associated with both whether a low-income student loan borrower living in New Zealand crosses the loan repayment threshold—that is, has an income after study that obliges them to start repaying their student loan—and the timing of when this occurs.
Younger men generally have average incomes which are above the loan repayment threshold one year after completing a qualification at any level, and under most circumstances, men have average incomes above the threshold after some years even if they don’t complete their qualification.
Only women who complete diploma or bachelors degrees have average incomes above the repayment threshold soon after graduating, though in the longer term, most women’s average graduate incomes cross the repayment threshold, although it is only just above the threshold for those who complete lower-level qualifications.
If any individual student loan borrower finds ongoing paid employment after completing their study, they are likely to have an income above the student loan repayment threshold. It is therefore the interplay between their access to the labour market, and how that is facilitated by their qualification, and their personal characteristics and circumstances, which will determine whether they will have sufficient income to be obliged to repay their student loan.
If someone living in New Zealand is earning below the student loan repayment threshold, then they probably don’t have a job, or they have a low-paid or part-time job. If that person with a low income takes out a student loan to study for a qualification to enhance their employment prospects—and for most people this is primarily why they study—for their post-study income to reach the student loan repayment threshold they have to find paid employment, or better-paid employment, or increase their hours of work. Whether a graduate can do this depends on how much the labour market values the generic or industry-specific skills gained by completing that qualification. It also depends on the person’s experience in the particular industry or career being sought, and their ‘employability’. These factors in turn are associated with the person’s gender, their age on graduation, their beneficiary status, and the level of qualification gained.
Personal characteristics like ambition, motivation, previous qualifications held, non-work obligations and such like are also important, as are the prevailing labour market and economic conditions.
In this report, we investigate whether student loan borrowers with a low incomes (those with a pre-study income below the student loan repayment threshold), living in New Zealand, earn enough income after studying for a tertiary qualification to meet the loan repayment threshold, that is, to be obliged to start repaying their student loans. We considered the level of qualification studied, whether the qualification was completed or not, and sex, age, and benefit status. We looked at how average incomes changed through time for this combination of factors, and we also looked at the distribution of graduate incomes one year after study. We also considered the association between the subject of the qualification completed and these factors. We were not able to consider personal characteristics and many of the other factors associated with someone’s income.
Whether someone’s income reaches the student loan repayment threshold depends on their pre-study income and the size of the step increase in their income once they complete their studies. Clearly, the higher their pre-study income and the larger the step-increase, the easier it is to reach the repayment threshold. Generally, step increases in income are higher after completing higher-level qualifications, and generally, younger people have higher step increases for completing the same level of qualification than older people.
Incomes also generally rise over time. The annual rise in income is important if someone’s income is not above the repayment threshold immediately after completing study. A faster rising income also means loan repayments are less burdensome financially, particularly for people with post-study incomes that are at first not much higher than the repayment threshold. Younger people generally see a higher annual rise in their income after completing a qualification compared to their annual rise before they studied, while older people generally do not. Younger people’s income generally rises faster than older peoples.
In our study, being on a benefit or not is a proxy for the level of engagement with the labour
market. For people on a benefit, the step change in income on completing a qualification is
generally lower than for those seen by non-beneficiaries, and beneficiaries’ annual rate of change in income after completing a qualification is often flat. Men in their twenties who are on a benefit after completing a qualification are the exception.
Student loan borrowers with low incomes, and who study for and complete bachelors degrees,
have estimated average incomes one year after graduating which are above the student loan repayment threshold. Even graduates with post-completion incomes at the bottom quarter of the income distribution (given their particular circumstances) have incomes above the repayment threshold. This applies to both sexes, for people up to 50 years of age, and regardless of their level of access to the labour market, as indicated by their beneficiary status.
If these student loan borrowers study for but don’t complete a bachelors degree, their estimated average income will exceed the repayment threshold within five years after they finish their study.
For low-income student loan borrowers who complete diplomas, their estimated average
income is also above the student loan repayment threshold one year after graduation. However, for those diploma graduates with incomes at the bottom quarter of the income distribution for their group, generally only men have incomes above the repayment threshold. For women completing diplomas, their graduate incomes are above the threshold only for those with median and higher incomes.
For low-income student loan borrowers who study for but don’t complete diplomas, men generally have estimated average incomes above the repayment threshold one year after study, but most people have estimated average incomes within five years after their study ends.
For low-income student loan borrowers completing certificate-level qualifications, the results
are more varied. Men who have no restrictions on their access to the labour market, and older men and women generally, are more likely to have estimated average incomes above the repayment threshold one year after graduating, compared to their respective counterparts. But within five years, most groups graduating with a certificate-level qualification have estimated average incomes above the repayment threshold, even if only slightly above.
Whereas all bachelors graduates, and most diploma graduates, with incomes at the bottom quarter of the income distribution for their group, had high enough incomes to be obliged to
start to repay their student loans, certificate-level graduates with incomes at the 25th percentile
for their group one year after completing don’t have incomes which cross the repayment threshold, so they are not obliged to start to repay their student loans. Older student loan borrowers on a benefit also don’t reach the repayment threshold one year after completing a certificate if they have median or lower incomes for their group. Young men are again the
exception—those with incomes at the 25th percentile generally are above the repayment
threshold.
Most groups who study for but don’t complete qualifications below the level of a bachelors
degree don’t have average incomes above the repayment threshold one year after completing study. However, since incomes rise with time, most non-completers, other than young women, have average incomes above the repayment threshold within five years after study.
Since incomes are generally rising over time, if someone already has an income that is above the student loan repayment threshold, then notwithstanding any circumstances which might reduce their income, they will continue to have sufficient income to be obliged to start to repay their loan. This is independent of what level of qualification they study and whether they complete that qualification or not.
All these results are contingent on a person gaining employment after completing their study.1
Similarly, personal motivation, persistence and ability will also play a role, both in terms of gaining employment, and in the level of remuneration received, independent of the level of tertiary study undertaken.
It is likely that the subject of the qualification also plays a role—for example, whether the qualification completed was in engineering or nursing. However, our analysis finds there are strong associations between the subject studied and gender, and to some extent age, and this association is stronger for lower-level qualifications. So controlling for age and gender implicitly controls for the subject of the qualification to a large extent.
Any low-income graduate student loan borrower in our study populations may earn above the loan repayment threshold; it is just statistically more likely that someone completing a higher-level qualification will have this higher-level of graduate income. Therefore, we cannot suggest that simply completing a higher-level qualification will always result in someone earning sufficient income for them to be obliged to start paying off their student loan. Like any research analysis that does not or cannot control for personal characteristics, like motivation, ability, confidence—or indeed any factors systematically linked with the outcome of interest—there is
always the possibility that the factors causing the changes in income we observed for people
1 More precisely, it has to be paid employment. There is a world-wide trend for young graduates, or anyone attempting to start a new career, to work as unpaid interns. This is being driven by more difficult economic conditions and higher unemployment. More details, including the situation in New Zealand, can be found in the report by Stewart and Owens (2013).
completing a tertiary qualification are due to these unobserved factors. That the step changes in average income we observed in our study are linked in time to the qualification completion event is not in question. But it might be that any intelligent, motivated and confident person
completing any qualification will have a higher income after graduating. The different incomes
we see for people graduating with different levels of qualification might just be because a higher proportion of able and motivated people choose to study at bachelors level, so on average, their graduate incomes will be higher than those who choose to study at lower levels.
These caveats apply to any research findings that do not or cannot control for these unobserved human characteristics.
Glossary of terms
Annual change in income The increase in income someone experiences due to pay rises, or cost-of-living adjustments to their salary or income. The annual change in income might be different before and after someone studies, and before and after someone completes a qualification.
Complete a qualification Studies for and is awarded a qualification at the end of a period of study.
Pre-study income The income for someone who is not studying, and for most people in the study population, before they complete a qualification.
Post-completion income The income for someone who has studied and completed a qualification, and is not studying currently.
Post-study income The income for someone who has studied, but is not currently studying.
Step increase in income A one-off change (usually an increase) in income due to a person changing jobs, receiving a promotion, or being paid a bonus. It might also come about by someone entering or re-entering the work force.
2
INTRODUCTION
In New Zealand, people studying for a tertiary qualification are, in the main, entitled to take out
a student loan to fund their study.2 Unlike some other countries, student loans in New Zealand
are interest-free,3 and there is no obligation to start paying back the loan until the person’s
income reaches a threshold (it was $19,084 for the 2014 tax year). For student loan borrowers who earn salaries or wages, repayments are deducted from their income by their employers. However, if a person’s income is below the student loan repayment threshold, there is no
automatic deduction.4 Self-employed people with student loans are required to make regular
loan repayments themselves if their income is above the repayment threshold.
The government carries the liability for the student loan while it is not repaid. One of the main drivers of the cost of New Zealand’s student loan scheme is loan borrowers whose income is insufficient to make progress in repaying their loans (Ministry of Education 2012). Therefore it is important to understand the circumstances where people’s income is below the repayment threshold after they have completed a tertiary qualification. Colloquially we ask, ‘was the study
worth it?’5
Previous studies have shown there is a sizeable proportion of people who have student loans but who earn insufficient income to repay that loan. For the cohort who left study in 2006, about a quarter of all New Zealand resident student loan borrowers’ income was under the repayment threshold for each of the following three years (Chen and Webster 2013).
‘Slow repayers’, of which those who do not make repayments to their loan at all are a sub-group, have been extensively studied over the past few years (Smyth and Hyatt 2005, Hyatt 2005, Griffin, Scott and Smyth 2005, Chen and Webster 2013), so the factors that characterise slow repayment are quite well known. In particular, females, older people, people in receipt of a benefit, people of Māori and Asian ethnicity, those who don’t complete their qualification, and people who study at lower qualification levels are over-represented in those who are slow to repay their student loans (Chen and Webster 2013).
Previous New Zealand studies on tertiary education and post-study income have usually considered income at particular years after completing a qualification. Mahoney, Park and Smyth (2013) considered incomes one, two and five years after completing a qualification, while Griffin et. al. (2005) considered income three and six years later. Mahoney (2011) considered income one and four years after completion for his work on income differences by gender. Crichton and Dixon (2011) did some time-series analysis, but their main focus was on the relative differences in income between people who completed a qualification and a matched control group (who did not study) three years after the completion of a qualification. One further study considered income over time (Maani 1999), but in that study the time points were census years, so time was represented in four-year intervals, and Maani considered each year in a separate regression analysis. All these reports are helpful in determining if someone is earning
sufficient income to be above the repayment threshold at a particular point in time, but we can’t
determine when,or whether they might reach that threshold.
To answer this question we need to know how income changes over time. Knowing how income changes not only allows us to ask how long it will take for someone to reach the
2 The eligibility rules for student loans in New Zealand can be found at http://www.studylink.govt.nz/financing-study/student-loan/index.html. 3 The loans remain interest-free if the student loan borrower remains in New Zealand after they finish their studies.
4 The rules for paying back a student loan in New Zealand can be found at http://www.studylink.govt.nz/finishing-study/paying-back-your-loan/index.html.
5 Just to be clear, we are not asking whether tertiary study is associated with better employment outcomes or with a lower likelihood of being on a benefit.
threshold, but we can also see how income changes when different qualifications are completed, how it varies between people of different age, or for people in different economic circumstances, and how the various factors act in combination.
There are three aspects of income that need to be considered when comparing it to a threshold. Firstly, we need to consider the income prior to any tertiary study. Clearly, if income is above the repayment threshold, then it is unlikely, barring any unexpected life events, to fall below that threshold, at least in the longer term. For this reason we need to consider people whose pre-study income is below the repayment threshold. Secondly, there may be a step change in income on completing a qualification. This might result from a person being able to work extra hours, or move from part-time to full-time work, or start on a new, better-paid career path. Alternatively, the qualification might enable a person to enter (or re-enter) the labour market. Each of these events would result in a step change in income. Lastly, completing a tertiary qualification may increase the rate at which income rises over time. This may come about because a person may be promoted to a more senior position, or they may take on more responsibilities, which in turn attracts a higher annual increment in their salary or wages. For self-employed people, a qualification might lead to higher productivity, and hence higher income, or provide greater status, which might attract more business.
In this study we use two approaches to gain a better understanding of the dynamics of income
when studying for and completing a tertiary qualification. First, we model average incomes6
through time. We consider the annual change in income before studying and after completing a qualification, and the step change in income on completing. We model income for individual men and women student loan borrowers over time who had low incomes—defined as being below the 2008 student loan repayment threshold—at the start of the study period in 1999. We look at people across a range of ages, some of them studying for a variety of qualification types, some of who complete those qualifications. We note whether someone is receiving a benefit or not in any one year. We limit our study population to those people who are resident in New Zealand, and we consider their income over the ten years 1999 to 2008. We compare income in 2008 dollars, and the rate of change in income, for the various combinations of factors, pre- and post-study, against the loan-repayment threshold in 2008.
Our second approach is to look at the distribution of post-completion incomes for people who
have completed a qualification. Specifically, we consider whether incomes in the lower, middle or upper quartiles of the post-completion income distribution are above the repayment threshold, also controlling for age, gender, benefit status and whether or not someone has a student loan.
The age groups considered in this report are for people in their twenties, thirties and forties. We did look at people in their fifties, but relatively few people of this age completed qualifications, especially at higher levels. We therefore can’t have as much confidence in these results. We don’t present the results for this age group formally, but we do summarise the findings generally in section 5.
In Section 3 we model income trajectories for student loan borrowers with incomes below the student loan repayment threshold at the start of our time series. Section 4 covers our second approach, looking at the distribution of post-completion incomes for our study groups. In section 5 we consider some other aspects of this study.
This report deliberately omits the statistical and technical details which underpin the analysis used in this study. This was done to make the report more readable to a non-technical audience.
6 Income in our study is the sum of wages and salaries, self-employed income, ACC payments, other benefit payments, pensions, study grants and parental paid leave payments. Excluded is rental income and accommodation supplement payments. These excluded sources of income are not in the Inland Revenue income data we had access to.
The statistical and technical details can be found in a separate report, ‘Statistical methods and results for Was it worth it?’ which is available on the Ministry of Education’s EdCounts website (http://www.educationcounts.govt.nz/publications/tertiary_education).
3
HOW INCOME CHANGES FOR LOW-INCOME
STUDENTS AFTER STUDYING FOR A TERTIARY
QUALIFICATION
Personal income generally increases with time. As people become more experienced, they achieve pay rises by taking on more responsibility, or they move into better paid jobs. For many people, this career progression and rise in income is facilitated by becoming more qualified. In this section we consider how income changes on completing a qualification for student loan borrowers with low pre-study incomes; our definition of ‘low income’ is that a person had to have an income at the outset of the analysis period below the student loan repayment threshold.
Our results are shown in Figures 1 to 3.7 There are some quite clear patterns.
In many cases, completing a qualification results in a step increase in income, with larger step increases associated with completing higher-level qualifications. However, in some situations, completing a lower-level qualification results in essentially no change in income. This occurs predominately for those on a benefit—being a proxy for engagement with the labour market— and for women.
There is essentially no change in the income trajectory for people with low incomes in their thirties or forties who studied for a qualification but did not complete it. Younger people do see a step increase in income if they don’t complete, and this step is higher if they studied higher-level qualifications. But the step increase is always much less than the change in income if they did complete. These observations also apply to people in receipt of a benefit.
Average pre-study incomes for people on a benefit are slightly higher for men in their forties, and somewhat higher for women in their thirties or older, compared to people not on a benefit. Young men in their twenties have lower incomes when on a benefit, while younger women on a benefit have much the same incomes. The annual rate of increase in income is generally lower for beneficiaries. The difference in income between beneficiaries and others is probably related to the fact that those on a benefit have a guaranteed income, while others may or may not have an income. The predominant benefit type also varies between men and women, with men on a benefit more likely to be on the unemployment benefit, while women on a benefit are more likely to be on a dependent persons benefit. See Section 5 for more details regarding the relationship between benefit type and gender over the years of the study period.
Another feature of the income trajectories is that the annual rise in income is lower for beneficiaries after completing a qualification, comparing people of similar age and gender. In many cases, the annual change in income for those on a benefit is relative flat. It also seems that on average, beneficiaries don’t receive as large a step increase in income as non-beneficiaries for completing the same level of qualification.
The exception to this appears to be young adult males with low incomes who are in their twenties when they complete a qualification. For these young men, beneficiaries have a smaller step increase on completing a qualification, at any level, but the annual rate of increase after completing is only slightly less than similar young men not on a benefit. In contrast, young women on a benefit have lower annual increases in income after completing a qualification than their peers not on a benefit. We note that the annual rise in income for young women not on a benefit is lower than their corresponding male counterparts.
7 The graphs are produced from the results of mixed model regressions, one for each combination of age group and highest level of tertiary study. Annual income was regressed against gender, benefit status, student loan status, enrolment status, whether a person had ever studied, completion status, time in years (as linear and quadratic terms), and time since completing (also as linear and quadratic terms), and their interactions. Pre-study income, the annual change in income pre- and post-study, and the step change in income on completing were modelled as random effects.
Notes on the figures
The plotted results (Figures 1 to 3) are the results of regression models. The incomes (in 2008 dollars) are estimated average incomes for prototypical people with particular combinations of factors. For example, Figure 1, top left hand panel, shows the estimated income, over time, for men in their twenties. One line is for men before they studied, and then after they completed studying for a certificate at levels 1 to 3, who were not in receipt of a benefit. This line separates into the estimated income for a man who completed that qualification (solid black line), and another for a man who did not complete that qualification (dashed black line). The second line in that figure is for men who were on a benefit (gray line), who also studied for a certificate at levels 1 to 3, and who either did or didn’t complete that qualification. The 2008 student loan repayment threshold is also shown in each figure.
The x-axis shows time as years since the last enrolment. Time periods -3 to 0 indicate the estimated income for a particular group in the years prior to any study. Years 1 to 6 show the estimated income for a particular group after they’ve ended their study. The years actually enrolled in tertiary study are not shown. This is done deliberately. In the models, we have a variable which estimates income during the enrolment years. This is generally negative, as peoples’ income is usually lower while they are studying, either because they are not working, or working less hours. It is usually more negative for younger people, and for those studying for higher-level qualifications. It is often not significantly different from zero for older people studying lower-level qualifications, probably because the study is part-time and doesn’t impact on their income.
When someone’s study ends, there are two components to the change in their income; there is the change back to the ‘usual’ income because they are no longer studying, and there is the possible change in income due to completing a qualification. If we don’t separate these two components in the models, then we would over-estimate the step change in income due to the actual completion of a qualification, as opposed to the cessation of study itself. The lines in the figures track the expected change in income on completing a qualification (or not) compared to the income for a group before any study.
Personal characteristics can be constant through time, like gender, or they can vary with time, like being on a benefit. Plotting estimated income trajectories for characteristics that are time-invariant is straightforward. We show separate figures for men and women, and for people who have the same highest level of study. However, for characteristics that can vary with time, what to plot is more problematic. Consider whether someone has a benefit or not. It is possible to show estimated income trajectories for people who are in receipt of a benefit in year 1, and not in any other year, or in year 2, and not in any other year, or in years 1 and 2, and not in any other years, etc. The possibilities, when combined with the other characteristics we are modelling, quickly become unmanageable, and many combinations won’t be particularly informative. Instead, what we have done is to plot the two end points of these possibilities; one line shows the estimated income for a prototypical person who is never on a benefit in any year, and the other line is for a prototypical person who is on any benefit for at least one month in
each year. The two lines indicate the upper and lower limits of income for the particular combination of
characteristics being plotted.
The study populations were people living in New Zealand, who were either 20, 30 or 40 years of age in 1999, with pre-study incomes in 1999 below the 2008 student loan repayment threshold. People with zero income in every year of the study were excluded. Sample sizes (randomly rounded to base 3) are provided in the following table.
Age in 1999
Highest level of study (if any) 20 30 40
Certificates at levels 1 to 3 61,041 46,302 43,842
Certificates at level 4 61,197 46,764 44,070
Diplomas 64,713 48,519 45,336
Bachlors degrees 72,954 50,301 46,371
Figure 1. Expected average income over time for prototypical people with low incomes in their twenties with a student loan, by level of qualification, gender, beneficiary status, and whether or not they completed a tertiary qualification
C e rt if ic a tes a t l ev e l 1 t o 3 C e rt if ic a tes a t l ev e l 4 D ipl o m as at l ev el s 4 t o 7 B ac he lor s at l ev el 7
Source: Statistics New Zealand, Integrated Data Infrastructure, Ministry of Education interpretation.
0 5 10 15 20 25 30 35 40 45 50 -3 -2 -1 0 1 2 3 4 5 6 Es tim at ed ta xa bl e in co m e ( $ x 10 00 )
Years after last enrolment Men
No benefit, completed No benefit, not completed Benefit, completed Benefit, not completed Repayment threshold 0 5 10 15 20 25 30 35 40 45 50 -3 -2 -1 0 1 2 3 4 5 6 Es tim at ed ta xa bl e in co m e ( $ x 10 00 )
Years after last enrolment Women
No benefit, completed No benefit, not completed Benefit, completed Benefit, not completed Repayment threshold 0 5 10 15 20 25 30 35 40 45 50 -3 -2 -1 0 1 2 3 4 5 6 Es tim at ed ta xa bl e in co m e ( $ x 10 00 )
Years after last enrolment Men
No benefit, completed No benefit, not completed Benefit, completed Benefit, not completed Repayment threshold 0 5 10 15 20 25 30 35 40 45 50 -3 -2 -1 0 1 2 3 4 5 6 Es tim at ed ta xa bl e in co m e ( $ x 10 00 )
Years after last enrolment Women
No benefit, completed No benefit, not completed Benefit, completed Benefit, not completed Repayment threshold
Figure 2. Expected average income over time for prototypical people with low incomes in their thirties with a student loan, by level of qualification, gender, beneficiary status, and whether or not they completed a tertiary qualification
C e rt if ic a tes a t l ev e l 1 t o 3 C e rt if ic a tes a t l ev e l 4 D ipl o m as at l ev el s 4 t o 7 B ac he lor s at l ev el 7
Source: Statistics New Zealand, Integrated Data Infrastructure, Ministry of Education interpretation.
0 5 10 15 20 25 30 35 40 45 50 -3 -2 -1 0 1 2 3 4 5 6 Es tim at ed ta xa bl e in co m e ( $ x 10 00 )
Years after last enrolment Men
No benefit, completed No benefit, not completed Benefit, completed Benefit, not completed Repayment threshold 0 5 10 15 20 25 30 35 40 45 50 -3 -2 -1 0 1 2 3 4 5 6 Es tim at ed ta xa bl e in co m e ( $ x 10 00 )
Years after last enrolment Women
No benefit, completed No benefit, not completed Benefit, completed Benefit, not completed Repayment threshold 0 5 10 15 20 25 30 35 40 45 50 -3 -2 -1 0 1 2 3 4 5 6 Es tim at ed ta xa bl e in co m e ( $ x 10 00 )
Years after last enrolment Men
No benefit, completed No benefit, not completed Benefit, completed Benefit, not completed Repayment threshold 0 5 10 15 20 25 30 35 40 45 50 -3 -2 -1 0 1 2 3 4 5 6 Es tim at ed ta xa bl e in co m e ( $ x 10 00 )
Years after last enrolment Women
No benefit, completed No benefit, not completed Benefit, completed Benefit, not completed Repayment threshold 0 5 10 15 20 25 30 35 40 45 50 -3 -2 -1 0 1 2 3 4 5 6 Es tim at ed ta xa bl e in co m e ( $ x 10 00 )
Years after last enrolment Men
No benefit, completed No benefit, not completed Benefit, completed Benefit, not completed Repayment threshold 0 5 10 15 20 25 30 35 40 45 50 -3 -2 -1 0 1 2 3 4 5 6 Es tim at ed ta xa bl e in co m e ( $ x 10 00 )
Years after last enrolment Women
No benefit, completed No benefit, not completed Benefit, completed Benefit, not completed Repayment threshold 0 5 10 15 20 25 30 35 40 45 50 -3 -2 -1 0 1 2 3 4 5 6 Es tim at ed ta xa bl e in co m e ( $ x 10 00 )
Years after last enrolment Men
No benefit, completed No benefit, not completed Benefit, completed Benefit, not completed Repayment threshold 0 5 10 15 20 25 30 35 40 45 50 -3 -2 -1 0 1 2 3 4 5 6 Es tim at ed ta xa bl e in co m e ( $ x 10 00 )
Years after last enrolment Women
No benefit, completed No benefit, not completed Benefit, completed Benefit, not completed Repayment threshold
Figure 3. Expected average income over time for prototypical people with low incomes in their forties with a student loan, by level of qualification, gender, beneficiary status, and whether or not they completed a tertiary qualification
C e rt if ic a tes a t l ev e l 1 t o 3 C e rt if ic a tes a t l ev e l 4 D ipl o m as at l ev el s 4 t o 7 B ac he lor s at l ev el 7
Source: Statistics New Zealand, Integrated Data Infrastructure, Ministry of Education interpretation.
0 5 10 15 20 25 30 35 40 45 50 -3 -2 -1 0 1 2 3 4 5 6 Es tim at ed ta xa bl e in co m e ( $ x 10 00 )
Years after last enrolment Men
No benefit, completed No benefit, not completed Benefit, completed Benefit, not completed Repayment threshold 0 5 10 15 20 25 30 35 40 45 50 -3 -2 -1 0 1 2 3 4 5 6 Es tim at ed ta xa bl e in co m e ( $ x 10 00 )
Years after last enrolment Women
No benefit, completed No benefit, not completed Benefit, completed Benefit, not completed Repayment threshold 0 5 10 15 20 25 30 35 40 45 50 -3 -2 -1 0 1 2 3 4 5 6 Es tim at ed ta xa bl e in co m e ( $ x 10 00 )
Years after last enrolment Men
No benefit, completed No benefit, not completed Benefit, completed Benefit, not completed Repayment threshold 0 5 10 15 20 25 30 35 40 45 50 -3 -2 -1 0 1 2 3 4 5 6 Es tim at ed ta xa bl e in co m e ( $ x 10 00 )
Years after last enrolment Women
No benefit, completed No benefit, not completed Benefit, completed Benefit, not completed Repayment threshold 0 5 10 15 20 25 30 35 40 45 50 -3 -2 -1 0 1 2 3 4 5 6 Es tim at ed ta xa bl e in co m e ( $ x 10 00 )
Years after last enrolment Men
No benefit, completed No benefit, not completed Benefit, completed Benefit, not completed Repayment threshold 0 5 10 15 20 25 30 35 40 45 50 -3 -2 -1 0 1 2 3 4 5 6 Es tim at ed ta xa bl e in co m e ( $ x 10 00 )
Years after last enrolment Women
No benefit, completed No benefit, not completed Benefit, completed Benefit, not completed Repayment threshold 0 5 10 15 20 25 30 35 40 45 50 -3 -2 -1 0 1 2 3 4 5 6 Es tim at ed ta xa bl e in co m e ( $ x 10 00 )
Years after last enrolment Men
No benefit, completed No benefit, not completed Benefit, completed Benefit, not completed Repayment threshold 0 5 10 15 20 25 30 35 40 45 50 -3 -2 -1 0 1 2 3 4 5 6 Es tim at ed ta xa bl e in co m e ( $ x 10 00 )
Years after last enrolment Women
No benefit, completed No benefit, not completed Benefit, completed Benefit, not completed Repayment threshold
One thing that needs to be kept in mind is that these income trajectories are not the average of all people in the population; they apply only to those student loan borrowers who have low pre-study incomes. For young adults, this will include people who have not yet started work, or are in part-time work. The trajectories therefore are probably typical of many young adults before they start their careers. But for the older study populations, their low average income makes them atypical of the older population generally. The factors that might result in an older worker having a low income could be lower than average education or qualifications, personal or physical impediments to working full time, or having other non-work responsibilities which limit the hours they can work in paid employment. There might be other reasons too: a lack of motivation to improve their lot, a lack of ability (perceived or real) which prevents them from undertaking study to improve their employment prospects, and other circumstances, like where they live geographically, or their access to transport. Some of these factors will not be mitigated by completing a qualification at any level.
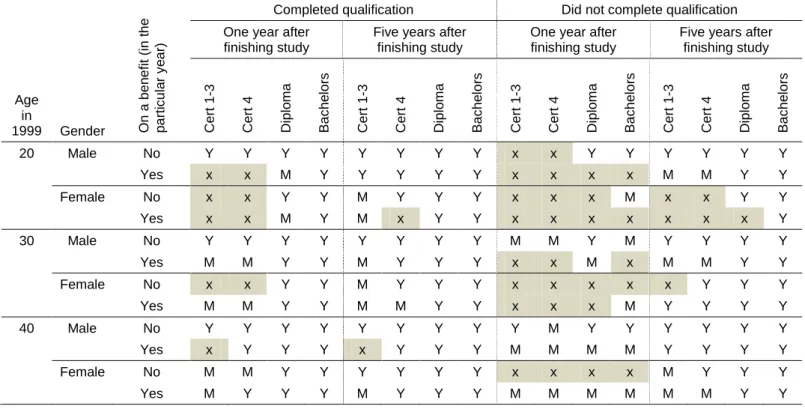
We can summarise the results in the figures in tabular form. In Table 2, we show the status of income relative to the loan repayment threshold one and five years after completing study, for those who completed a qualification or not, for men and women with different benefit status. We distinguish between incomes which are above the student loan repayment threshold, only just above, and those which are not. We have shaded these latter instances to help visualise the results.
It is clear from Table 2 that completing a qualification is far more likely to result in an income above the repayment threshold, although for men generally, and older people, average incomes have risen to be mostly above the repayment threshold within five years. Similarly for those who do complete; if their incomes haven’t reached the repayment threshold after one year, they mostly have by year five. However, for those completing lower-level certificate qualifications, average incomes are often only marginally above the threshold, while they exceed the threshold for those completing diplomas and bachelors degrees for all age groups, sexes and benefit status.
Subject choices
It might be the case that the differences we see in income trajectories between people of different age and gender after completing the same level of tertiary study is because of differences in the subject of the qualification completed. It is known that some qualifications lead to higher-paid jobs—medical qualifications for example—or are more in demand in the labour market—engineering qualifications are an example. So if there is a systematic difference in the subjects studied between say, men and women, or people on a benefit versus those not receiving a benefit, or younger versus older people, this might go some way to understanding differences in income after completing such a qualification.
We investigated whether there were systematic patterns of preference in the particular qualifications completed by our study populations. We found:
• There are strong associations between gender and the subject of the qualification
completed for all levels of study, although the particular subjects studied by men and women depend on the level of study. Women tended to gain qualifications in the areas of nursing, teacher education, human welfare, language and literature and personnel services. Men tended to gain qualifications in the areas of mechanical and industrial engineering, automotive engineering and technology, agriculture, horticulture and viticulture, building, architecture, and sport and recreation.
Table 1. Indicators showing whether average incomes for student loan borrowers reach the student loan repayment threshold for particular combinations of level of study, age, gender and benefit status, one year and five years after completing study, for those who did or did not gain the qualification
Age in 1999 Gender On a ben ef it ( in t he par ti c ul a r y e ar )
Completed qualification Did not complete qualification
One year after finishing study
Five years after finishing study
One year after finishing study
Five years after finishing study Ce rt 1 -3 Ce rt 4 D ip lo m a B ac he lor s Ce rt 1 -3 Ce rt 4 D ip lo m a B ac he lor s Ce rt 1 -3 Ce rt 4 D ip lo m a B ac he lor s Ce rt 1 -3 Ce rt 4 D ip lo m a B ac he lor s 20 Male No Y Y Y Y Y Y Y Y x x Y Y Y Y Y Y Yes x x M Y Y Y Y Y x x x x M M Y Y Female No x x Y Y M Y Y Y x x x M x x Y Y Yes x x M Y M x Y Y x x x x x x x Y 30 Male No Y Y Y Y Y Y Y Y M M Y M Y Y Y Y Yes M M Y Y M Y Y Y x x M x M M Y Y Female No x x Y Y M Y Y Y x x x x x Y Y Y Yes M M Y Y M M Y Y x x x M Y Y Y Y 40 Male No Y Y Y Y Y Y Y Y Y M Y Y Y Y Y Y Yes x Y Y Y x Y Y Y M M M M Y Y Y Y Female No M M Y Y Y Y Y Y x x x x M Y Y Y Yes M Y Y Y M Y Y Y M M M M M M Y Y
These indicators are based on Figures 1 to 3. Y=income above the student loan repayment threshold M=income slightly above the repayment threshold x=income not above repayment threshold
• There are clear associations between the subject of the qualification completed and the age of the student, but this applies mostly to lower-level qualifications, less so for higher levels. Younger women tended to complete certificates in the creative arts, food, tourism, hospitality and personnel services, while young men tended to complete certificates in sport and recreation, building, and engineering-related subjects.
• There are also some recurring patterns in the subjects of the qualifications completed by
people on a benefit. The association was strongest in lower-level certificates, and essentially non-existent in bachelors degrees, probably because beneficiaries were less likely to study at this higher level. Beneficiaries tended to be associated with mixed field studies (these include career development programmes, job search skills programmes and work practices programmes), and personnel services, tourism, and visual arts and crafts qualifications. Being on a benefit and being female were also closely associated.
• We looked at the association between having a student loan and the field of study, but
the strongest association was between having a loan and being younger.
• We also considered whether there was any link between the subject of the qualification
and pre-study incomes, but we found no association.
It is clear there are systematic differences in the subjects of the qualifications completed. It should be also clear that the subjects themselves have different employment and income potentials (see Mahoney, Park and Smyth, 2013). We think these help to understand some of the
differences in income trajectory seen for people completing the same level of qualification. In
particular, beneficiaries who complete lower-level mixed field programmes are likely to be older persons with poor work histories, and completing one of these programmes is not likely to provide the same boost to income as someone completing a vocationally-focussed qualification at the same level of study. More generally, people with less involvement with the labour market will be expected to have lower average incomes over time.
Additional patterns of income trajectories
In our regression models, we include factors, known as residuals, which allow each person’s individual income parameters to be scattered about the relevant population averages. These residuals represent those portions of income that remain ‘unexplained’ by the model’s factors (Singer and Willett 2003). Since these residuals represent deviations between the individual income parameters and their respective population averages, their variances and co-variances summarise the population variation around these averages after controlling for the factors in the model.
In our models, we captured between-person residuals for pre-study and post-completion rates of change in income, and for the level of pre-study income and the step change in income on gaining a qualification. The model also captures the residuals which account for any one person’s actual income trajectory around their population’s average income trajectory through time.
In short, we are able to look at the correlations between these residuals to give us a feel for how people’s income varies after controlling for their gender, age, beneficiary status, what level of study they attempted (if any), and whether or not they gained a qualification at that level. These correlations are shown in Table 1.
For young adults in their twenties, at the start of their careers and before they undertake any tertiary study, there is a small but significant positive correlation between their income and how fast that income is rising over time (Table 1, first column of data). That is to say, a higher
pre-study income is weakly associated with a higher annual rise in income. On the other hand, there
is a weak negative relationship between these two factors for people in the middle of their
careers. Or in other words, before starting any tertiary study, generally for those in their thirties or older, the higher their income the slower it is likely to be going up each year. This latter relationship is the one we are most familiar with. People who are paid more, on average, have
smaller annual increments in their salary.8 But this is not the case for young adults. Rather, it
seems young people who have started their careers higher up the income ladder seem to be slightly more likely to be on a steeper income trajectory. But the correlations are not large, which means there is much variation in the general patterns just described.
Table 2. Correlation coefficients between selected components of income, by age and level of study
Correlation between: Age in 1999 Level of study Pre -s tu d y i n c o m e and r at e of i n c reas e in in c om e bef or e s tudy ing P re -s tu d y i n c o m e and c hange in inc om e on c om pl e ti ng P re -s tu d y i n c o m e and r at e of i n c reas e in in c om e a ft er c om pl e ti ng R at e in i n c reas e i n i n c om e bef or e s tudy ing and c hange in inc om e on c om pl e ti ng R at e of i nc rea s e i n i nc o m e bef or e s tudy ing and th e rat e af ter c o m pl et ing C hange i n inc o m e on c om pl e ti ng and r at e of inc reas e i n in c om e af ter c om pl e ti ng 20 Certificates at levels 1 to 3 0.09 *** -0.29 *** -0.22 *** -0.16 *** -0.62 *** 0.14 ** Certificates at level 4 0.12 *** -0.28 *** -0.16 ** -0.19 * -0.60 *** 0.09 ns Diplomas 0.13 *** -0.16 *** -0.13 ** 0.00 ns -0.47 *** -0.07 ns Bachelors 0.12 *** -0.05 ns -0.04 ns -0.01 ns -0.39 *** -0.19 *** 30 Certificates at levels 1 to 3 -0.17 *** -0.40 *** -0.04 ns -0.02 ns -0.79 *** 0.22 *** Certificates at level 4 -0.17 *** -0.39 *** 0.04 ns -0.07 ns -0.79 *** 0.41 *** Diplomas -0.17 *** -0.16 ns 0.06 ns -0.07 ns -0.64 *** -0.02 ns Bachelors -0.16 *** 0.06 ns -0.05 ns -0.32 *** -0.61 *** 0.16 * 40 Certificates at levels 1 to 3 -0.14 *** -0.32 *** 0.02 ns -0.13 ns -0.70 *** 0.09 ns Certificates at level 4 -0.14 *** -0.32 *** -0.04 ns -0.14 ns -0.67 *** 0.12 ns Diplomas -0.15 *** -0.20 * -0.15 * -0.05 ns -0.63 *** 0.28 *** Bachelors -0.15 *** -0.07 ns -0.05 ns -0.26 *** -0.65 *** 0.18 ***
The probability (p) that a given value is zero is indicated by: *** p<0.001; ** p<0.01; * p<0.05; ns – not significantly different from zero. Confidence indicators are based on bootstrapped standard errors and confidence intervals using 500 iterations for each of the 12 regression results shown (one per line in the table).
Source: Statistics New Zealand, Integrated Data Infrastructure, Ministry of Education interpretation.
The correlation between someone’s income prior to studying and the change in income on completing a qualification is given in column 2 of Table 1. This shows a consistent pattern of being moderately negative for lower-level qualifications, tending to zero for higher-level qualifications. This suggests that having a higher income somehow negates the advantage, in terms of a step change in income, of completing a lower-level qualification. It’s as if there is an upper limit to what a lower-level qualification will provide in terms of income, and if that income has already been reached, completing one of these qualification doesn’t add much extra to someone’s income. On the other hand, the step change in income on completing a diploma, and especially a bachelors degree, is essentially independent of someone’s income before they start their study.
The correlation between the amount of pre-study income and the annual rate of increase in income after completing is given in column 3 of Table 1. It appears there is only a significant
8 For people who earn a salary or wage, their job or position it usually associated with a salary range. The higher someone’s income is in that range, the lower their annual increment. Once the upper limit of the range is reached there might be no further increments unless the person changes position or there is a review of the salary range.
correlation between these two components of income for young adults, and it is strongest for young adults studying for and completing a certificate at levels 1 to 3. There is less correlation for certificates at level 4 and diplomas, and no correlation for young adults studying and completing a bachelors degree. The correlation suggests that for young adults completing lower-level qualifications in their twenties, the higher the income prior to study, the lower the rate of increase in income after completing. This pattern complements that seen between income prior to study and the step change in income on completing a qualification.
The correlation between the rate of change in income before studying and the step change in income on completing (Table 1, column 4), and between the step change in income on completing and the annual change in income after completing (Table 1, column 6) do not show any consistent pattern across age or level of study.
The largest correlation is found between the annual changes in income before studying and after completing (Table 1, column 5). There is a consistent trend within each age group for the correlations to be larger (more negative) for lower-level qualifications, but even for people completing bachelors degrees, the correlations are still quite large and negative.
This suggests that someone is less likely to get a large annual increment in their income after completing a qualification if they already receive large annual increments, and this is more likely to be the case if they complete a lower-level qualification. Of course there may still be a benefit in terms of a one-off step increase in income, and on average, this is indeed the case. Again, this step increase is generally higher for those completing higher-level qualifications.
The corollary is also important; people with lower pre-study rates of increase in income are
more likely to have a higher rate of increase in their income after completing a qualification.
The incomes reported in this section have been averages, predicted by our regression models. These results are most useful if the average is a good measure of a group’s income. However, our models show there is much variation between people in their pre-study and post-study incomes, and in the step change in income on completing a qualification, even for the same gender, age group and level of qualification completed, although our models also show there is far less variability in the annual rate of change in income. So it might be that while the average income is above the student loan repayment threshold, there are others in the group whose income is below the threshold.
In the next section we look at the distribution of post-completion incomes and how these vary with the factors in our models.
4
POST-COMPLETION INCOME DISTRIBUTIONS
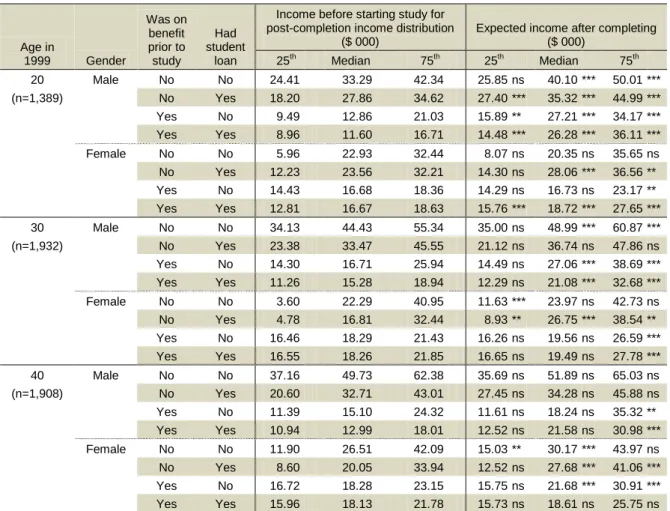
The results in the previous section were average incomes for particular sub-populations of student loan borrowers. The statistical models we used estimated average incomes. The average is a good measure of an outcome if most values are centred near the average, with a small dispersion around this average. However, incomes don’t usually follow this pattern. As we saw from the results of the previous section, there is much unexplained variation around the average results. This is why incomes are usually reported as medians, to account for the fact incomes are typically not normally distributed, with fewer people having high incomes, and proportionally more people having below-average incomes. In this section we consider the distribution of post-completion income, conditional on the same range of factors we considered previously. The results are presented in Tables 3 to 4, and summarised in Figure 4 and Table 7. Tables 3 to 6 show the income in the year before someone starts study at a particular level of qualification,
and the expected income in the year after completing, for people at the 25th, 50th and 75th
percentile of post-completion income.9
The study population for this analysis includes anyone with an income under $100,000 in all of the years 1999 to 2008, and excludes people with zero income in each of those years. We select people where we have both a record for them before they start any tertiary study, and another record one year after they completed a qualification.
The tables show the pre-study and completion income for three groups; those whose
post-completion income was at the 25th percentile for the particular combination of characteristics
(age, gender, student loan and benefit status), the median or 50th percentile, and the 75th
percentile. In this way we can see whether people in the lower quartile of the income distribution for a particular combination of characteristics reach the student loan repayment threshold on completing a qualification, compared with people with similar characteristics but higher in the post-completion income distribution.
Note that the results in this section are not directly comparable to the results in the previous section. Previously, we ensured everyone’s pre-study income in the study population was below the repayment threshold. In this section, some groups with particular combinations of characteristics have pre-study incomes which are above the repayment threshold.
The results show that for student loan borrowers completing bachelors degrees, graduates with incomes at the bottom quarter, and higher, of the income distribution for their particular combination of characteristics have post-completion incomes that are above the repayment
threshold.10 For those at the 25th percentile of graduate income, this is not because their
pre-study incomes were already above the threshold. These results conform to the results for average incomes one year after graduating as seen in the previous section (see Table 2 and contrast with Table 7). It also means that at least 75 per cent of bachelors degree graduates will be obliged to start repaying their student loans in the year after completing their qualification.
For those completing diplomas, incomes at the median and 75th percentile are generally above
the repayment threshold. However, for those with graduate incomes at the 25th percentile for
their group, only men not on a benefit have incomes above the repayment threshold.
9 These results are also derived from statistical modelling. Quantile regression was used to model the expected income in the year after completing a tertiary qualification, controlling for birth year, gender, benefit status and student loan status, conditional on the quartile of the income in the year after starting study.
10 Since our lowest quartile was the 25th percentile, we cannot say if someone with an income below this would have been above the student loan repayment threshold.
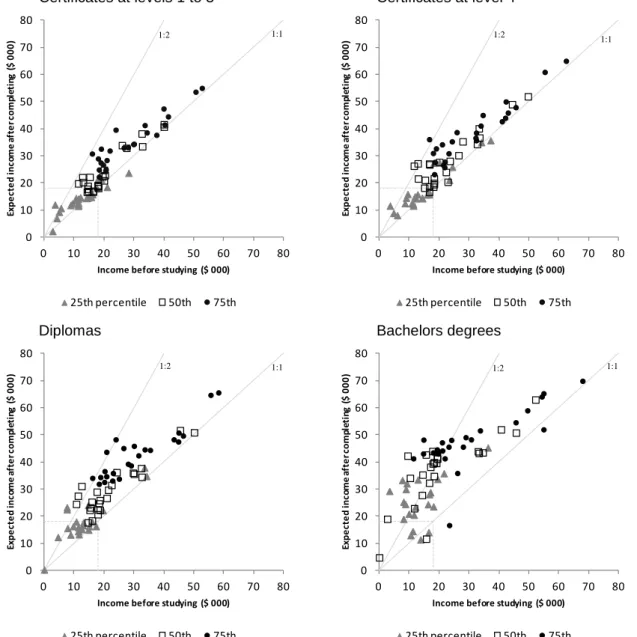
For progressively lower level qualifications, the results show progressively fewer groups with graduate incomes above the repayment threshold. Certainly, anyone with a graduate income at
the 75th percentile will be above the repayment threshold, regardless of what level of
qualification they complete. But for older people completing a certificate at level 4, those on a benefit with a median income or lower for their group are below the repayment threshold. And for those completing certificates at levels 1 to 3, the same result applies to those on the median
income for this group. But for those at the 25th percentile of graduate income, only young men
not on a benefit have an income that is above the repayment threshold.
Of course graduates across the post-completion income distribution have different pre-study incomes. These are shown in Tables 3 to 6, and the relationship between the pre-study and post-completion incomes is summarised in Figure 4. Note Figure 4 shows data for people with and without student loans, and with and without a benefit, as the general patterns appear to apply to all students.
Table 3. Distribution of incomes (in thousands of dollars) before and after completing a certificate at levels 1 to 3, by
age, gender, and student loan and benefit status
Age in 1999 Gender Was on benefit prior to study Had student loan
Income before starting study for post-completion income distribution
($ 000)
Expected income after completing ($ 000) 25th Median 75th 25th Median 75th 20 Male No No 19.01 32.64 39.89 21.37 ns 38.18 *** 47.44 *** (n=3,342) No Yes 17.84 26.02 33.63 21.15 ** 33.90 *** 41.33 *** Yes No 10.61 14.32 18.00 14.43 *** 16.71 ** 29.01 *** Yes Yes 9.29 11.42 16.03 12.37 *** 19.82 *** 30.75 *** Female No No 2.81 20.03 29.83 2.18 ns 20.91 ns 34.31 *** No Yes 8.81 19.46 28.01 11.79 * 22.39 ** 33.12 *** Yes No 14.12 16.32 18.28 14.43 ns 16.73 ns 22.33 *** Yes Yes 12.11 16.38 18.26 14.65 *** 17.08 *** 24.93 *** 30 Male No No 28.18 39.96 50.60 23.68 *** 41.59 * 53.60 ** (n=4,101) No Yes 17.52 32.77 41.40 18.30 ns 33.45 ns 44.45 ns Yes No 11.39 15.23 23.92 14.22 ** 22.16 *** 39.58 *** Yes Yes 11.38 14.57 18.95 12.70 * 18.89 *** 32.57 *** Female No No 5.04 20.28 37.51 9.25 *** 22.84 ** 37.69 ns No Yes 4.16 12.99 30.01 6.96 ns 20.30 *** 34.42 * Yes No 15.67 18.14 20.59 14.80 ns 18.12 ns 25.02 *** Yes Yes 16.09 17.97 19.66 15.81 ns 18.82 * 26.72 *** 40 Male No No 20.97 39.98 52.65 18.50 ns 40.69 ns 54.98 ns (n=3,738) No Yes 10.46 27.50 40.23 13.49 ns 32.93 * 41.48 ns Yes No 11.39 14.76 21.94 11.95 ns 17.03 * 31.94 *** Yes Yes 11.38 14.52 18.93 11.45 ns 17.80 ** 27.45 *** Female No No 5.56 19.98 34.27 10.72 *** 24.79 *** 38.63 *** No Yes 3.55 12.76 26.59 12.02 *** 22.08 *** 32.99 *** Yes No 14.76 17.87 20.90 14.97 ns 19.19 * 28.41 *** Yes Yes 14.46 17.93 20.47 14.51 ns 18.71 ns 24.47 *** The probability (p) that a given post-completion income is greater than the income before study is indicated by:
*** p<0.001; ** p<0.01; * p<0.05; ns – not significantly different.
Table 4. Distribution of incomes (in thousands of dollars) before and after completing a certificate at level 4, by age, gender, and student loan and benefit status
Age in 1999 Gender Was on benefit prior to study Had student loan
Income before starting study for post-completion income distribution
($ 000)
Expected income after completing ($ 000) 25th Median 75th 25th Median 75th 20 Male No No 24.41 33.29 42.34 25.85 ns 40.10 *** 50.01 *** (n=1,389) No Yes 18.20 27.86 34.62 27.40 *** 35.32 *** 44.99 *** Yes No 9.49 12.86 21.03 15.89 ** 27.21 *** 34.17 *** Yes Yes 8.96 11.60 16.71 14.48 *** 26.28 *** 36.11 *** Female No No 5.96 22.93 32.44 8.07 ns 20.35 ns 35.65 ns No Yes 12.23 23.56 32.21 14.30 ns 28.06 *** 36.56 ** Yes No 14.43 16.68 18.36 14.29 ns 16.73 ns 23.17 ** Yes Yes 12.81 16.67 18.63 15.76 *** 18.72 *** 27.65 *** 30 Male No No 34.13 44.43 55.34 35.00 ns 48.99 *** 60.87 *** (n=1,932) No Yes 23.38 33.47 45.55 21.12 ns 36.74 ns 47.86 ns Yes No 14.30 16.71 25.94 14.49 ns 27.06 *** 38.69 *** Yes Yes 11.26 15.28 18.94 12.29 ns 21.08 *** 32.68 *** Female No No 3.60 22.29 40.95 11.63 *** 23.97 ns 42.73 ns No Yes 4.78 16.81 32.44 8.93 ** 26.75 *** 38.54 ** Yes No 16.46 18.29 21.43 16.26 ns 19.56 ns 26.59 *** Yes Yes 16.55 18.26 21.85 16.65 ns 19.49 ns 27.78 *** 40 Male No No 37.16 49.73 62.38 35.69 ns 51.89 ns 65.03 ns (n=1,908) No Yes 20.60 32.71 43.01 27.45 ns 34.28 ns 45.88 ns Yes No 11.39 15.10 24.32 11.61 ns 18.24 ns 35.32 ** Yes Yes 10.94 12.99 18.01 12.52 ns 21.58 ns 30.98 *** Female No No 11.90 26.51 42.09 15.03 ** 30.17 *** 43.97 ns No Yes 8.60 20.05 33.94 12.52 ns 27.68 *** 41.06 *** Yes No 16.72 18.28 23.15 15.75 ns 21.68 *** 30.91 *** Yes Yes 15.96 18.13 21.78 15.73 ns 18.61 ns 25.75 ns The probability (p) that a given post-completion income is greater than the income before study is indicated by:
*** p<0.001; ** p<0.01; * p<0.05; ns – not significantly different.
Table 5. Distribution of incomes (in thousands of dollars) before and after completing a diploma, by age, gender, and student loan and benefit status
Age in 1999 Gender Was on benefit prior to study Had student loan
Income before starting study for post-completion income distribution
($ 000)
Expected income after completing ($ 000) 25th Median 75th 25th Median 75th 20 Male No No 0.00 11.26 29.95 0.00 ns 27.46 *** 45.88 *** (n=1,494) No Yes 14.73 24.18 33.56 24.14 *** 36.21 *** 44.60 *** Yes No 7.62 12.50 20.83 23.34 ** 31.10 ** 43.68 ** Yes Yes 8.80 10.71 16.12 13.23 *** 24.50 *** 34.07 *** Female No No 0.00 20.94 31.52 0.30 ns 26.73 * 42.42 *** No Yes 10.67 21.39 29.00 17.98 *** 29.69 *** 38.72 *** Yes No 12.90 17.56 22.99 16.73 * 28.97 *** 35.85 *** Yes Yes 9.68 15.23 18.31 16.25 *** 22.34 *** 31.90 *** 30 Male No No 34.21 45.42 55.59 34.84 ns 51.70 * 64.68 * (n=1,440) No Yes 19.63 32.44 43.31 22.19 ns 37.67 ** 48.30 ** Yes No 11.39 14.59 23.92 14.48 ns 17.65 ns 48.29 *** Yes Yes 11.38 15.54 20.21 15.94 *** 23.20 *** 36.56 *** Female No No 12.57 32.62 46.39 15.16 ns 34.46 ns 49.67 ns No Yes 7.83 22.54 35.35 15.59 *** 31.48 *** 44.43 *** Yes No 15.96 18.26 22.75 17.97 ns 24.73 *** 33.11 *** Yes Yes 15.01 17.88 20.07 16.26 ns 20.74 ** 32.58 *** 40 Male No No 33.49 50.05 58.24 37.89 ns 50.90 ns 65.62 *** (n=1,257) No Yes 7.64 29.72 44.78 22.46 *** 35.97 ns 47.54 ns Yes No 11.38 18.59 26.52 14.49 ns 25.87 ns 45.08 *** Yes Yes 11.61 16.04 18.84 13.31 ns 18.35 ns 34.37 *** Female No No 13.06 29.95 44.87 17.70 ** 35.56 ** 50.77 ** No Yes 4.60 15.93 27.99 12.34 *** 25.28 *** 39.28 *** Yes No 17.28 18.61 24.98 16.28 ns 22.33 ns 33.79 *** Yes Yes 14.80 17.88 20.76 14.95 ns 22.49 *** 34.71 *** The probability (p) that a given post-completion income is greater than the income before study is indicated by:
*** p<0.001; ** p<0.01; * p<0.05; ns – not significantly different.
Table 6. Distribution of incomes (in thousands of dollars) before and after completing a bachelors degree, by age, gender, and student loan and benefit status
Age in 1999 Gender Was on benefit prior to study Had student loan
Income before starting study for post-completion income distribution
($ 000)
Expected income after completing ($ 000) 25th Median 75th 25th Median 75th 20 Male No No 0.00 0.00 11.43 0.00 ns 4.75 ns 41.27 *** (n=2,067) No Yes 8.86 19.27 28.92 30.03 *** 41.27 *** 49.05 *** Yes No 9.20 9.49 14.83 32.07 *** 42.29 *** 48.21 *** Yes Yes 8.08 10.27 14.72 19.01 *** 34.14 *** 43.09 *** Female No No 0.00 2.66 21.90 0.00 ns 18.96 *** 41.25 *** No Yes 8.05 19.10 27.96 25.27 *** 39.63 *** 45.56 *** Yes No 8.72 16.69 19.70 24.54 *** 32.25 *** 43.08 *** Yes Yes 9.88 14.53 18.04 20.92 *** 35.29 *** 43.49 *** 30 Male No No 12.93 45.72 54.91 33.46 ns 50.76 ns 65.33 * (n=1,104) No Yes 19.47 33.03 45.64 33.65 *** 43.87 *** 54.58 ** Yes No 13.82 15.69 23.36 11.43 ns 11.66 ns 16.71 ns Yes Yes 11.64 17.13 21.02 20.51 *** 38.20 *** 47.22 *** Female No No 18.06 34.56 49.48 23.59 ns 43.49 *** 58.97 *** No Yes 3.40 15.61 30.68 29.30 *** 42.65 *** 48.33 *** Yes No 16.45 17.87 19.33 14.06 ns 39.39 *** 44.64 *** Yes Yes 16.31 18.28 23.23 24.44 *** 39.90 *** 45.61 *** 40 Male No No 36.34 52.19 67.90 45.31 ns 62.96 * 69.92 ns (n=933) No Yes 12.13 33.27 54.92 23.41 * 43.26 *** 52.03 ns Yes No 11.15 11.69 26.13 14.49 ns 22.89 ns 35.93 ns Yes Yes 10.46 14.27 19.77 12.99 ns 27.77 *** 43.89 *** Female No No 21.63 40.74 54.30 35.83 *** 51.99 *** 64.10 *** No Yes 7.70 17.84 33.67 33.34 *** 43.96 *** 51.55 *** Yes No 17.09 18.28 21.12 28.76 ns 34.83 *** 44.22 *** Yes Yes 16.67 19.37 24.06 28.06 *** 41.24 *** 48.13 *** The probability (p) that a given post-completion income is greater than the income before study is indicated by:
*** p<0.001; ** p<0.01; * p<0.05; ns – not significantly different.