The author would like to thank Don Dutkowsky, Rick Ericson, Brad Heim, Peter Meyer, Greg
Debit vs Credit:
A Model of Self-Control with Evidence From Checking Accounts
Marc Anthony Fusaro
Assistant Professor Department of EconomicsEast Carolina University [email protected]
March 2008
Abstract:
Debit cards are the fastest growing consumer payment method despite being more expensive and less convenient than credit cards. We present a model and show empirical evidence explaining this phenomenon. Checking account evidence shows that debit cards are used as a tool to restrain overspending. We also test whether the overspending is behavioral or cost-based. In the rational model, consumers use debit to avoid costly budgeting, thus spending control is a cost-driven motivation for using debit cards. In the behavioral model, some
consumers simply can not control spending without a restraining device. The data supports spending control as a motive for debit use, however, the data does not provide conclusive evidence for the rational or behavioral explanations. JEL codes: D14, G21, L14
1.
I
NTRODUCTION
Debit cards are the fastest growing segment of electronic payments. Table (1) shows that while the growth in credit card transactions averaged 10% per year between 1998 and 2004, debit card transactions have grown by 22% and 26% during the same period. Debit transactions have grown from 28 to 45 percent of point-of-sale card transactions during that period.
The puzzle of debit’s popularity is that explicit costs would seem to favor credit over debit. With debit, the money is immediately subtracted from the bank account. Whereas, with credit, the customer is billed for purchases at the end of the month and has further grace period to pay. As long as no balance is carried on the card, the consumer pays no interest. Evaluating this float at a savings account interest rate, it may be minor. But for consumers in need of cash, the opportunity cost – payday loans or bank bounce protection – is quite high. Credit cards also offer the
option of converting the payment into an uncollateralized loan with zero transaction cost. Most credit cards offer rewards (cash back, airline miles, gift certificates, warranty on purchase, charitable donations, etc.) or a below market interest rate, whereas only 5.7% of banks offer rewards on their signature debit cards (Moebs 2006). And some financial institutions
Credit OnlineDebit OfflineDebit 2004 5.0% 23.6% 20.0% 2003 7.1% 23.3% 20.0% 2002 7.1% 4.0% 22.0% 2001 8.9% 31.8% 26.2% 2000 19.0% 25.5% 30.3% 1999 12.7% 25.0% 40.1% 99-04 75.8% 228% 305% Source: EFT Data Book (2004)
1PIN debit cards use the ATM network infrastructure to transfer data, and money,
between customers, merchants and their respective banks. Identity is verified by a four digit PIN number. Signature debit cards use the Visa or MasterCard network to transfer data and identity is verified when a customer signs a receipt.
2There are often several terminals per location so these numbers represent a severe deficit Figure 1: Nesting Structure of Payments
(15%) charge a fee for PIN1 debit purchases, ranging from ten cents to two dollars per
transaction. Customer experience and merchant acceptance is virtually identical between credit and signature debit. However, PIN debit is accepted at far fewer locations. In 2003, there were 5.25 million merchant locations accepting Visa and MasterCard; there were only 3.98 million online debit terminals.2
Our goal is to explain why people can choose debit over credit. Much of the growth in debit card use is substitution from paper, checks and cash. From 1995 to 2003, electronic payments grew from 23 percent to 55 percent of all payments. Borzekowski and Kiser (2006)
find that the closest substitutes for debit are cash, checks and credit in that order. It is convenient to frame the consumers’ decision process in a nesting structure where they first choose whether to pay with current or future funds. Then if using current funds they choose cash, check or debit (see Figure 1). The model and empirical tests contained herein address the first decision – whether to use current or future funds. Our subject is not a new
phenomenon of the digital payments age; rather, it is an old phenomenon – borrowing versus
contemporaneous payment. The advantages of the debit age are that it allows a cleaner
comparison (debit and credit are similar in many dimensions considered by Klee, 2006) and that data are now available to track debit transactions as opposed to the anonymity of cash. Although the puzzle could be stated as contemporaneous payment versus borrowing, the two options are henceforth referred to as debit and credit.
This paper addresses the question debit or credit with a two level process. First, we show that many people use debit as a tool of self restraint. With this, a second question emerges. Is this self restraint due to consumers playing a behavioral game against themselves or due to consumers finding debit to be the lowest cost tool for spending management? The former
explanation is similar to models by Thaler and Shefrin (1981), Bertaut and Haliassos (2002), and Prelec and Loewenstein (1998) and empirical work by Prelec and Simester (2001), Liabson, Repetto and Tobachman (2004), Ashraf, Karlin and Yin (2006) and Ausubel (1991). The latter is supported by models such as Ameriks, Caplin and Leahy (2004) and Kocherlakota (1998). Also, the behavioral spending control is refuted by Zinman (2006).
Players in the industry recognize the spending control motive for using debit cards. Visa’s web site lists the following as an “advantage of paying with Visa check cards”: “Use your Visa check card as a budgeting tool to help you track your expenses and manage your money better.” This statement could be taken as an expression of the card’s benefits over cash (“track expenses”), but it clearly also hints at the card as a tool for restraining spending. Specifically, it says “a budgeting tool”.
In our model, consumer purchases are stochastic which complicates the budgeting
process. This stochastic environment leads to overspending. In cases where the overspending is persistent, consumers can use a debit card to spend out of liquidity which restrains spending to
the current period affordable level. The model implies that (1) debit card users will have accumulated credit card balances in the periods before switching to debit and (2) they will shop at a greater variety of stores. In addition, people who use debit to restrain spending could also (3) use in-pocket-cash to restrain spending. These three predictions of the model are supported in the data indicating that debit cards are used to restrain spending.
Two versions of the model are presented to account for (1) a cost based motivation for using debit cards as a tool of self-restraint or (2) a behavioral explanation for using debit cards as such. In the behavioral model, the overspending is a result of exogenous forces which drive consumption above income. In the cost based model, budgeting is costly and some consumers find it low cost to spend out of liquidity rather than expending effort to plan affordable
purchases. A fourth test is performed to separate these explanations with mixed results. Our results support spending control as a motivation for debit card use but provide mixed results on the question of whether it is behavioral or cost based.
Zinman (2006) provides several cost based reasons to use debit other than spending control and argues against spending control motives. Borzekowski, Kiser and Ahmed (2006) [henceforth BKA] also argue against spending control motives. Zinman finds evidence that 38% of households are motivated by such cost based factors. But he also notes that up to 31% of the debit using households are unexplained by these factors. Analysis of BKA results, provided in section (4) below, shows that spending restraint explains debit use in 24% of debit-using households. Both of these papers use household survey data. Ours is the only study to use actual customer transactions, a course of action recommended by Zinman. The data used here is sufficiently rich to test and support spending control as a motive for using debit.
3Income is insignificant in some regressions (tables 8 and 9). Further, Fusaro (2005) Their basic mechanism is similar in that consumers track purchases only with a costly tracking technology. In our model, consumers who do not use the technologies (debit cards or budgeting) consume more or less than optimal due to forecast error. In their model, in contrast, consumers without the technology optimally choose to purchase more. Our data show that debit card use is unrelated to income3 counter to the prediction of their model. Finally, our model predicts
borrowing early in life leading to debit card use later, where their model predicts savings over the life cycle (appropriate for many applications).
Section (2) describes the model and the testable hypotheses of the model. Section (3) describes the data and section (4) provides the empirical evidence to support the claim that debit use is a form of spending control. Section (5) concludes.
2. A Model of Household Expenditure
In this section, we present a model of consumption, budgeting and payment. Expenditure – even for a well planned consumer – is variable across periods. Resulting variation in
purchases causes some consumers to overspend. In order to restrain this overspending, a consumer could forgo the benefits of a credit card by spending only out of a checking account via a debit card. When the checking account is exhausted, all future transactions are declined, thus restraining purchases. Two potential causes of the overspending are presented: behavioral and cost-based.
2.1 Model Setup
At the beginning of a period, the consumer has an income, y, and demand for a single unit of each good in a set of goods, , which is larger than any consumer can afford. The
consumer creates a shopping list containing N goods out of the potential goods. The goods on the period t shopping list are randomly ordered: good 1, good 2, ... , good N. The consumer receives the opportunity to purchase good 1 from the shopping list with probability θ . Next, the opportunity to purchase good 2 arrives with probability θ. This pattern continues through until good N has been reached. By the end of the period the consumer will have had the opportunity to purchase θN goods from her shopping list. Each good provides surplus, though the surplus varies across goods. Major purchases which are financed, fall outside the scope of this model. The discount factor between periods is β ; however, there is no discounting within a period.
For purchases, the consumer has a choice between paying with funds available in a checking account if using a debit card or being billed at the end of the period if using a credit card. If, upon receipt of the bill, the consumer does not have enough money in the checking account to pay the bill, the balance due may be converted to a loan with zero transaction cost. Naturally, if a debit card is used, then money must be available in the account or the transaction is declined at the point-of-sale. When using debit the user pays a fee, φ , which may be
interpreted as foregone credit card rewards, foregone float, the foregone flexibility of being able to borrow and any explicit fee. It is assumed that the consumer chooses one payment method for all purchases (though may switch in future periods). In reality, consumers pay for purchases with multiple payment methods based on factors such as purchase size and type of retailer. The one card assumption here should be taken to represent a consumer’s primary payment method for everyday purchases when all methods are accepted.
At the beginning of period t , the consumer knows income, y ; the discount factor, β ; and the costs of debit and credit. The consumer does not know θ. The consumer must calculate – or estimate – a level of affordable expenditure, N .
According to the above, the consumer makes two decisions. First, the consumer selects a payment method. Second, she makes a shopping list to match income. We proceed to analysis of shopping list selection.
2.2 Overspending and the Consumer’s Budget Constraint
In this section, the consumer’s level of spending is described with the options for fulfilling the budget constraint. Two versions of the model are presented. In the first, the consumer has three options for selecting N.
The consumer can pay to learn θ ; we call this budgeting. Or the consumer could avoid the cost of budgeting if instead a debit card is used to make purchases since the debit card will not allow the consumer to overspend. Finally, the consumer could do neither, estimating affordable
consumption. In this version of the model,
consumers use debit to avoid overspending only when it is lower cost than expending effort to budget. In the second version of the model, some types of consumers overspend by assumption and thus overspending can be seen as behavioral.
The consumer has income, y, to spend on goods. Denote the average price across goods y = per period income
N = length of individual’s shopping list number of goods available
θ = percentage of shopping list available
φ = fee for using debit
β = discount factor
= average price per good across goods.
p
ρ = portion of over(under) spending reduction
γ = cost of over(under)spending reduction Bt = credit card balance at period t.
on a shopping list as . Then if a consumer purchases p θN goods, expected expenditure is . Define N* to be the value of N which solves the budget equation: . A
p N
θ
p Nθ = yconsumer who wants a balanced budget will desire to choose N*. Over a lifetime, consumers must have a balanced budget, but in any individual period a consumer has the ability to borrow (with a credit card) or save.
Consumers begin with a randomly selected signal of θ and then adjust.
Assumption 1: Each consumer receives a random signal θ0 from the range [θ θ, ]. This value is
drawn once at t=0 and persists. The distribution of the signal has mean at the true θ.
The signal θ0 is persistent because our lives dictate that we purchase largely the same types of
goods period-to-period; our lifestyles do not change drastically. The distribution of the signal should have mean at the true θ because forecasts are accurate in the mean. Using the signal θ0
the consumer calculates a level of purchases, N0, which satisfies the equation pθ0N0 = y. The
two models differ in the options for adjusting from N0 and in the interpretation of this
assumption.
2.2.1 The Cost Model
In this version of the model, the value N0 should be thought of as a starting point from
which the consumer endeavors to find N* . From this starting point, each consumer has two methods to abandon this randomly drawn starting point and move to – or closer to – a balanced budget: calculate the budget satisfying level N* at a cost, or use a debit card to avoid the need to choose N0 (i.e., rather than budgeting, spend until the money runs out). This option is described
in section (2.3). If the consumer chooses to do neither, she will deduce more about her level of N* as she realizes several periods of consumption. How and when consumers learn whether N0>N* is described in section (2.4). Once they know more, they potentially choose one of the
two options for moving to or toward N*. The process of calculating N* is described here. Consumers do not initially know their value of N* , but they do know that it will be in a range. They may expend resources to reduce or eliminate the range. Specifically assume:
Assumption 2: Each consumer can select a value ρ from the set , such that 0#ρ#1. A
consumer who draws θ0 and has chosen ρ will actually purchase N* + ρ(N0–N*). A
consumer who selects ρ must also pay an accounting cost γ(1-ρ) where γ varies across consumers.
Consumers have control over their purchases, but they must expend resources to discover N0 . If ρ is a boolean decision (i.e., = {0,1}) with a fixed cost, γ , then each consumer will go
through a decision process which looks very much like the decision to use a debit card described below. But if consumers can choose any value for ρ between zero and one (i.e., = [0,1]), then they will chose the value that maximizes their utility. Naturally, those with a lower cost of budgeting will be more likely to do so, bringing their purchases closer to N*. Appendix B contains the solution to the optimal level of ρ conditional on γ, for a particular utility function.
2.2.2 The Behavioral Model
In this version of the model, the consumer’s signal θ0 represents a belief about how
much the consumer will purchase. When using a credit card to conduct transactions the
to restrain spending below this pre-ordained level is a debit card, purchasing only the goods for which liquid funds are available.
<reference some behavioral papers which model overspending>
2.3 Selecting a Card
Consumers have two payment technologies at their disposal, credit and debit. The credit card allows borrowing which is convenient in this environment of stochastic purchases. Indeed, recall that consumers – even those who choose to calculate an exact N* – will have variation in purchases. Debit cards restrict purchases to be no greater than income plus any available
savings. In this section, we present proposition 1 which shows that setting optimal shopping list, N* , provides greater utility to setting N>N* and using a debit card to restrain spending.
Proposition 2 then shows a range of parameter values such that debit consumers unsure of their level of N will use credit, switching to debit only after accumulating a credit card balance and discovering that N>N*.
First, consider a consumer who has N0<N* . This consumer would accumulate savings.
When a credit card is used, the consumer can pay the balance every month and not need to borrow, on average. If the consumer uses a debit card, she would still spend less than income, saving on average, but lose the ability to borrow during periods in which more than θ goods are available for purchase. Therefore, the credit card to dominates the debit card for this user.
Consider, now, a consumer with N0 > N* . One method of setting the shopping list at the
optimal level, N* , is to pay the budgeting cost of calculate N* . See Appendix B for more on the optimal level of budgeting. Focus now on those consumers who do not budget – those with high cost of budgeting γ. Such consumers must choose between using a debit card to restrain
circumstances, faced with uncertainty about ones true level of θ a consumer uses credit. However, once she discovers that her spending is unsustainable (i.e., N0>N*) she switches to a
debit card.
Proposition 1: There is a range of parameter values such that consumers choose to use credit if
they are unsure whether N0 is higher than N* but switch to debit if they learn that N0>N* .
Proof: Let the utility increment from choosing a debit card over a credit card be δj , where j = u,
c. δu is the increment to utility gained from adopting a debit card when the individual is
uncertain as to the level of N* . δc is the increment to utility gained from adopting a debit
card when the individual is certain that N0>N* . (Note that the utility increment of
adopting debit is zero when the individual is certain that N0#N* because the utility
increment derives from debit’s ability to keep the user from accumulating high credit card balances. In this case, the user will not accumulate balances with either card.) Note that δj > 0 since staying out of debit is desirable. Then 0 < δu < δc because δu is a
weighted average of δc and zero. Let δr be the utility increment from adopting credit which derives from rewards, float and flexibility and avoiding debit fees. In the case where δu<δr<δc , a consumer who is uncertain about the level of θ will prefer credit to
debit. If the consumer were to discover that N*<N0 , the consumer will switch to debit.‘
Proposition 1 is a key result which will be tested empirically is section 4. Now turn to
Proposition 2 which demonstrates that having a shopping list of length N* is preferable to having a shopping list longer than N* and using a debit card to restrict purchases.
Proposition 2: Conditional on purchases (i.e., conditional on N*), utility is decreasing in N .
Proof: Consider two individuals, S and T , both purchasing N1 ex-post. They have identical
utility functions. S searches for N2>N1 but consumes N1 on average, perhaps because S
uses a debit card to stop spending at the level N1. T purchases N1 without the help of a
debit card; perhaps T calculates N*=N1. Recall that goods vary in value. Each good, n,
provides a differing utility. Since surplus varies, consumers should have a well defined preference ranking over goods. Optimizing consumers search for not just any N goods, but the highest ranked N goods. In particular, T searches for the best N1 goods and
purchases those available. S searches for N2 goods which arrive in random order and
purchases the first θN1 goods. Thus T purchases only goods ranked higher than good N1
while S purchases some goods ranked below N1.‘
This proposition says that debit card users make sub-optimal purchases which crowd out higher utility goods, simply because the lower value good arrives first. Thus, using debit is not a perfect substitute for calculating N*.
Under certain parameter values (high γ and δu < δr < δc ), consumers would not calculate
their optimal purchases (i.e., select ρ>0) and they would choose credit when unsure about their type but switch to debit when they become aware that N0>N* . The following section describes
how consumers would discover that N0 is too high or too low.
2.4 Discovering One’s Type
In the cost model, consumers do not initially know N* (unless they select ρ=1). If, in any period, a consumer spends too much and needs to borrow, this is not sufficient cause to conclude
that N* < N0. Indeed, borrowing in any one period, could be a result of N being too high (i.e.,
) or the result of variation in realized available items from the shopping list (i.e., more p Nθ 0 > y
than θ items were available to purchase this period). Borrowing is a signal that potentially N*<N0, but one signal is not enough to conclude as such; two such signals are not enough. The
level of credit card balance and/or the number of borrowing periods are the only feedback that consumers receive as to their level of N* . Only when the consumer gets “enough” signals can she conclude that N* < N0. In the behavioral model the interpretation is different; when the
consumer receives “enough” signals she concludes that the current path is unsustainable and needs to restrain spending. This section quantifies the term “enough”, using a hypothesis testing approach.
Even if a consumer sees a string of deficit periods, how would that consumer differentiate a random string of favorable price periods from systematic borrowing? Proposition 3 provides an answer to this question. The null hypothesis is N* = N0 which corresponds to zero expected
credit card balance, Bt. If the balance exceeds the confidence interval around B
t=0, then the
individual can reject the null hypothesis and conclude that N* < N0. If savings accumulates
higher than the negative of the lower bound of the confidence interval, then she can conclude that N* > N0.
The actual level of confidence consumers use is an empirical issue which could be answered using a database containing debit card use and credit card balance. Such a database is not currently available. But even without knowing at what confidence level the consumer will conclude that N* < N0, proposition 3 is a reasonable description of how consumers must deduce
N* given that the only signals they see are their credit card balance and the number of borrowing periods. For exposition, the proposition shows a two-standard-deviation confidence interval,
(
)
(
)
(
)
(
)
N p N y r r p N r r r t t θ − ρ + − ρ θ −θ + − + ⎡ ⎣ ⎢ ⎢ ⎤ ⎦ ⎥ ⎥ + + 1 1 1 1 1 2 1 2 2 2 ,though the confidence level used by a consumer is an empirical question.
Proposition 3: Debt balance is distributed normally
And the 95% confidence interval which would allow a consumer to conclude that N is too high (low) is
Proof: See Appendix C.
The number of deficit periods is an alternative signal to credit card balance. Under the null hypothesis that N0 = N* , the probability of a deficit period is 0.5. A series of t periods
constitutes a Bernoulli distribution B(t,0.5). A confidence interval can easily be constructed for any number of periods, t . The individual would know that N* < N0 (alternatively N* > N0) if
the number of deficit (alternatively saving) periods exceeds the critical value for t .
Corollary 1: When a consumer discovers that N* is less than N0 and switches to debit, she has
positive credit card balance. Such consumers have a higher credit card balance than those who continue to use credit.
Proof: The first statement follows directly from proposition 3; those who switch to debit have a credit card balance indicated by proposition 3. Those who do not switch to debit do so because their credit card balance does not reach such a level. Either they are saving or
(
)
(
)
(
)
(
)
(
)
(
)
−
−
+
−
+
−
+
−
+
⎡
⎣
⎢
⎢
⎤
⎦
⎥
⎥
+ +196
1
1
1
2
196
1
1
1
2
2 2 2 2 2 2.
ρ
p
θ
θ
N
r
, .
ρ
θ
θ
r r
p
N
r
r r
r rtheir balance is not at such a level. Thus, debit users will tend to have higher credit card balances than those who continue to use credit cards. ‘
2.5 Testable Hypotheses
The model presented above can be outlined in two steps. First, for some reason,
consumers overspend. Second, this overspending causes them to use a debit card as a strategy to restrain spending. Each of these two parts can be taken as separate phenomena and tested.
In either the behavioral or cost-based version of the model, some consumers (those with high N and high cost of budgeting) use a debit card to restrain their spending. In the cost-based version of the model, they use debit cards to restrain spending because it is the lowest cost tool. In the behavioral version, using a debit card is the only way to restrain purchases. First we discuss how to test the part of the model that is common to both versions, whether debit card use is a remedy for overspending. Second, we discuss whether the overspending is behavioral or cost based, testing the two versions against each other.
The cost model can be summarized by a 2 by 2 matrix listing parameters and outcomes. For simplification, table (3) shows discrete parameter values. The columns contain low and high cost of calculating a budget (γ). The rows contain low and high N0 . Those with high γ but
low N0 do fine estimating their purchases. Those
with low γ and low N0 do fine estimating their
purchases but the cost of budgeting is low so they could also calculate. Those with low γ but
Skilled at Bugeting (Low γ) Budgeting Is Costly (High γ) Savers (N0#N*) calculate or estimate estimate Over-spenders
(N0>N*) calculate use debit
high N0 would accumulate credit card balances if they try to estimate. However, for this group,
budgeting is low cost. Those with both high γ and high N0 can not estimate or calculate. They
need a debit card. Debit use is correlated with γ , which is (correlated with) marginal value of time. The behavioral model can be summarized by N0. Those with low N0 estimate while those
with high N0 eventually need to use debit to control their spending.
2.5.1 Debit Cards are a Tool to Restrain Spending
This model provides three testable hypotheses. First, consumers with high levels of N relative to N* accumulate credit card balances. Second, debit card users shop for a larger variety of goods. Third, they use debit cards to restrain spending, they may also use cash holding to restrain spending (i.e., carry less cash). These results hold regardless of what causes the overspending.
According to the model, consumers discover their affordable level of purchases, N* , only after a long period of using a credit card and accumulating credit card balances (or saving). To restrain their spending, they then switch to debit cards but still have outstanding credit card balances. This observation is formalized in Corollary 1 and leads to Hypothesis 1:
Hypothesis 1 (H1): Debit card users have higher credit card balances than debit card
non-users.
In any scenario where consumers use a debit card to control spending and did not start doing so from their initial period, this will be the case. H1 is a test not just of the model but of spending control as a motive for debit card use. Further, alternative explanations of debit card use imply the opposite (being credit constrained, getting cash back to avoid ATM fees,
convenience or simple preference related explanations).
goods must select which N goods. This leads to Hypothesis 2:
Hypothesis 2 (H2): A consumer who uses debit, purchases a greater variety of goods than a
credit user, ceterus paribus.
The debit user has a list with N0>N* goods (thought in any one period only purchasing θN* , on
average, before money runs out). A credit user with identical purchases must have a shopping list containing exactly N* goods. Thus over the course of several periods the credit user
purchases from a list of length N* and the debit user purchases from a list of N0>N* goods. The
debit user purchases a greater variety of goods. One might interpret those with longer shopping lists with impulse shoppers who lack self-control. This hypothesis is implied by spending control models but not by alternative explanations.
A final hypothesis is not implied directly by the model but is an extension of the model to cash holding. Specifically, we could generalize the spending tools in the model to be a high liquidity tool and a low liquidity tool. Credit cards (high liquidity) allow consumers access to past, current and future income; debit cards, in contrast allow consumers access to only past and current income. Another application of this generalized model is to cash holding. Consumers can limit their liquidity by carrying less cash, thus putting more distance between their potential purchases and their assets (bank account money in this case). Viewed in this way, we might expect consumers who limit their liquidity by using a debit card to also limit their liquidity by carrying lower volumes of paper currency.
Hypothesis 3 (H3): Consumers who use debit hold less paper currency.
We implement this hypothesis, identify those who hold less cash, by measuring people who visit the ATM more frequently taking out less cash at each visit. Absent this model we would expect the opposite relationship. Alternative explanation of debit use also predict the opposite. Since
(some) debit card users get cash bank at the supermarket we would expect them to visit the ATM less often. Those who seek convenience should visit the ATM less often. Credit constrained consumers have no expected prediction for cash holding.
In section (4), these three hypotheses are tested and evidence is found to support all three.
2.5.2 Why Consumers Overspend
The two versions of the model both imply overspending which necessitates debit cards. But the two versions of the model imply two very different root causes of the overspending. In the cost based model, consumers are heterogeneous with respect to their budgeting cost. Those with a low cost of budgeting are unlikely to overspend and thus require the services of a debit card. Conversely, individuals with a higher opportunity cost of time are less likely to budget, and more likely to overspend and use debit. In contrast, there is little reason to believe that opportunity cost of time is correlated with behavioral impulse purchases leading to
overspending.
Hypothesis 4 (H4): According to the cost based model debit use should be correlated with a high
opportunity cost of time.
All three hypotheses are tested in section (4). But, first we describe the data used.
3. Data and Variable Definitions
In this section, we describe the data set, explain how a debit card user and a credit card user are identified in the data, and define variables to test H1-H4. The empirical analysis employs a sample of transaction records from 2,312 checking accounts obtained from a small
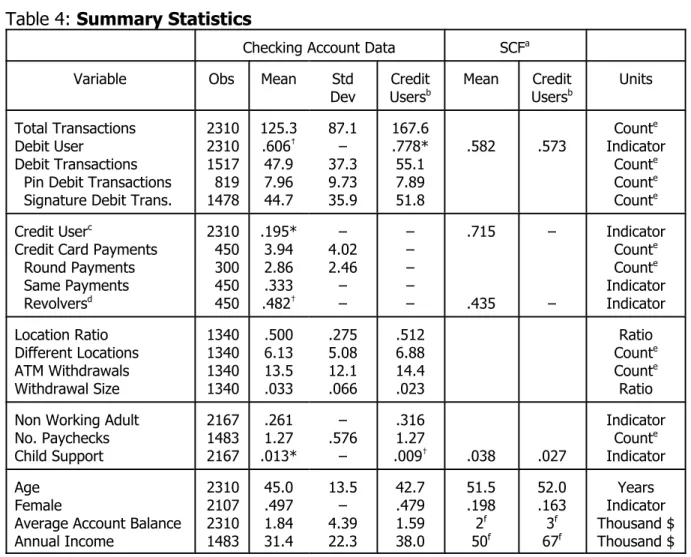
depository institution in the Midwest. Two accounts are discarded due to lack of customer information, leaving us with 2310 accounts. The data include customer information and all transactions with associated balances from June, July, and August, 2003. For each transaction, the data contain the date, amount, balance and information on the source or destination. For ATM or debit card transactions, the address and/or store name is listed. The data also contain customer information including age, account tenure, gender, and a joint account indicator. Table (4) shows summary statistics for the data. The median customer was 44 years old. The average checking account balance was $1843. The average annual income for customers was $31,000; although any income not passing through this account was not observed.
3.1 Identifying Credit and Debit Card Users
Over 60% of account holders used debit cards. The average customer made 125 withdrawal transactions in the three month sample, and the average debit card user made 49 debit card transactions. This rate of debit usage is comparable to the Survey of Consumer Finances (SCF) and the survey reported in Borzekowski, Kiser and Ahmed (2006). The variable DebitUser is an indicator for anyone who made more than four transactions with a debit card during the three month sample period. Four transactions was chosen as the cutoff so that the level of debit users in our data matches that reported in the SCF. Regression results through the paper are robust to altering this definition.
Credit card users are elusive because the data allows us to observe only the checking account. Define CreditUser as an account holder who made a credit card payment. On average, credit users made four payments. The mode was three payments – generally to the same card – over the three month sample. These payments are identified through the descriptive field of
4Automated Clearing House is the electronic money transfer system through which direct deposit and direct billing operates.
5In a process known as check truncation the receiving party of a check, in this case the ACH4 transactions in the data. For example, ACH payments made to “American Express” or “Discover” or “Cred Crd Pmt” are identified as payments toward credit card balances (see Appendix A for a full list of the descriptions identifying credit card payments). Thus we identify credit card payments either made electronically (ACH) by the customer, or converted to an ACH transaction by the credit card issuer.5 In the data, nearly 20% of accounts made at least one identified payment toward a credit card balance as compared to 72% in the SCF. What accounts for the 52 percentage point discrepancy? We can not identify two types of credit card payments, those that were processed as a paper check through the entire payments system, and those that have an ambiguous or misleading description. The latter should be random variation, however, the former could introduce bias into our measure of credit card users.
We assess the representativeness of our data by comparing it with the SCF . (The SCF is used for comparison purposes only. All empirical work uses the checking account records). Table (4), includes SCF statistics where comparable data exists. For both our data and the SCF, the table lists the figures for the full sample and for a sample restricted to credit card users. Other than having a higher income, credit users are similar to the general population (according to the SCF). This was true in our data as well. Also, the identified credit users in our data were similar to credit users in the SCF, indicating that little if any bias is introduced by our inability to detect all credit users. The exception to this lack of bias is that debit users are over represented. In the SCF, 58% of people are debit users, whether looking at the whole population or just credit users. In our data, however, debit users were more likely than debit non-users to be identified as
credit users – more likely to pay their bills online. This can also be seen in Table (6) where 78% of credit uses also use debit cards compared to 56% of credit non-users. When the sample is restricted to credit users only (models H1d, H1e, and H1f), this bias will skew the table (7) coefficients toward zero, against our expected results.
Checking Account Data SCFa
Variable Obs Mean Std
Dev UsersCreditb Mean UsersCreditb Units
Total Transactions Debit User
Debit Transactions Pin Debit Transactions Signature Debit Trans.
2310 2310 1517 819 1478 125.3 .606† 47.9 7.96 44.7 87.1 – 37.3 9.73 35.9 167.6 .778* 55.1 7.89 51.8 .582 .573 Count e Indicator Counte Counte Counte Credit Userc
Credit Card Payments Round Payments Same Payments Revolversd 2310 450 300 450 450 .195* 3.94 2.86 .333 .482† – 4.02 2.46 – – – – – – – .715 .435 – – Indicator Counte Counte Indicator Indicator Location Ratio Different Locations ATM Withdrawals Withdrawal Size 1340 1340 1340 1340 .500 6.13 13.5 .033 .275 5.08 12.1 .066 .512 6.88 14.4 .023 Ratio Counte Counte Ratio Non Working Adult
No. Paychecks Child Support 2167 1483 2167 .261 1.27 .013* – .576 – .316 1.27 .009† .038 .027 Indicator Counte Indicator Age Female
Average Account Balance Annual Income 2310 2107 2310 1483 45.0 .497 1.84 31.4 13.5 – 4.39 22.3 42.7 .479 1.59 38.0 51.5 .198 2f 50f 52.0 .163 3f 67f Years Indicator Thousand $ Thousand $
a2004 Survey of Consumer Finances (SCF),sample is restricted to checking account holders. bFigure reported are the means when sample is restricted to credit users.
cCredit users can be identified only when their bills are paid electronically (either web pay or payee conversion). dRevolvers defined as anyone who either has repeat payments or has more then one round payment.
eAll count variables are for the entire 3 month sample.
6Regression results are robust to altering the definition of RoundPmt by rounding to the
3.2 Variables Used to Test H1 - H4
H1 states that debit users are more likely to be revolving a credit card balance – paying toward a balance rather than just paying for current period expenses. Two variables, RoundPmt and SamePmt, indicate consumers who used their credit card not for payments but were rather paying toward a (previously accumulated) balance. A consumer paying a balance in full would pay the whole balance right down to the penny; whereas, someone paying part of a high balance is likely to pay in round increments. Define RoundPmt as the number of credit card payments made in multiples of $10.6 Two thirds of credit card users made at least one round payment and they made an average of three round payments in three months. Second, when paying down
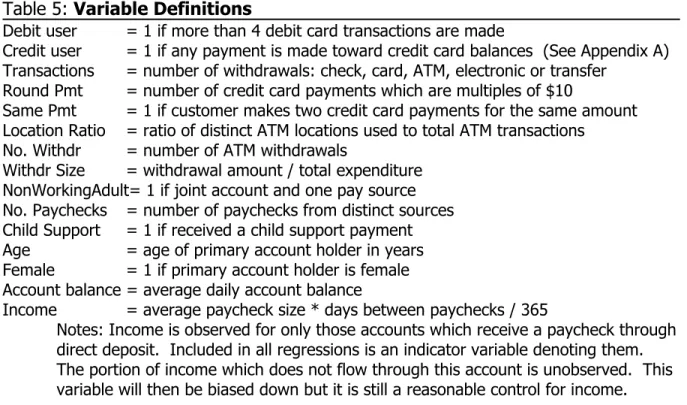
Table 5: Variable Definitions
Debit user = 1 if more than 4 debit card transactions are made
Credit user = 1 if any payment is made toward credit card balances (See Appendix A) Transactions = number of withdrawals: check, card, ATM, electronic or transfer
Round Pmt = number of credit card payments which are multiples of $10
Same Pmt = 1 if customer makes two credit card payments for the same amount Location Ratio = ratio of distinct ATM locations used to total ATM transactions
No. Withdr = number of ATM withdrawals
Withdr Size = withdrawal amount / total expenditure NonWorkingAdult= 1 if joint account and one pay source No. Paychecks = number of paychecks from distinct sources Child Support = 1 if received a child support payment Age = age of primary account holder in years Female = 1 if primary account holder is female Account balance = average daily account balance
Income = average paycheck size * days between paychecks / 365
Notes: Income is observed for only those accounts which receive a paycheck through direct deposit. Included in all regressions is an indicator variable denoting them. The portion of income which does not flow through this account is unobserved. This variable will then be biased down but it is still a reasonable control for income.
balances people likely pay the same amount each month, whereas those paying for recent purchases are very unlikely to have equal payments across months. Define SamePmt as an indicator for a consumer who made two payments of identical amounts. One third of credit users made two identical payments. Finally, define a credit card Revolver as one who either made two payments of the same amount or made more than one round payment. Nearly half (48.2%) of credit card users are revolvers, similar to the percentage of revolvers in the SCF.
H2 states that overspenders, and thus debit users, shop at a greater variety of store locations. The ideal measure is distinct purchase locations as a percent of all purchases; however, we do not witness credit card purchases. Consumers use cards (debit or credit) for high-value transactions and use cash for low-value transactions (see Klee, 2006). With an incomplete picture of high-value (card) transaction, we turn to low-value (cash) transactions. The same behavior – greater location variety for
overspenders – should be present in both low and high value transactions. Cash purchase locations are unseen; however, ATM withdrawal locations are observable. Since consumers often withdraw money when they need it, the number of ATM withdrawal locations is a reasonable proxy for the number of cash purchase locations. Define the variable LocationRatio as the ratio of distinct ATM locations used to the total
number of ATM withdrawals. The mean of LocationRatio is 0.5, indicating that the average customer visits an ATM twice in three months. Since credit cards have a higher average
purchase level than debit cards (Klee, 2006), it is possible that the cutoff level for switching from
Debit Users Total
No Yes
no credit use
credit users 811100 1049350 1860450 ATM user
& plastic user & credit user
291 41 41 1197 1197 319 1488 1238 360 total 911 1399 2310
Table 6: Count of Debit Users Among Various Subgroups
cash to a card is lower for debit users than for credit users. Then debit users would be less likely to use cash than credit users. If this is true, the bias in LocationRatio would bias our results downward (against the model prediction).
Holding low cash volumes is correlated with debit card use according to H3. Consumers who carry less cash will, ceteras paribus, make a lower value cash withdrawals but need to visit the ATM more often. This does not imply that debit users withdraw more or less total cash, merely that cash acquisition is more diffuse conditional on total cash withdrawn. Define the variable WithdrSize as the average withdrawal amount as a fraction of total expenditure. Define NoWithdr as the number of ATM withdrawals. The average withdrawal was three percent of quarterly expenditure and the average customer visited the ATM once a week.
We test the behavioral model against the cost-based model (H4), using measures of opportunity cost of time. Three proxies for opportunity cost of time are having a non-working adult in the household, working multiple jobs, and being a single parent. NonWorkingAdult indicates households with a joint account and receiving only one paycheck. Such a household is assumed to have a relatively lower opportunity cost of time. Define the second variable,
NoPaychecks, as the number of paychecks from different employers. The more jobs one works, the higher the opportunity cost of time, ceteras paribus. The variable ChildSupport captures single parent households and is an indicator for a household which receives child support payments. These households are assumed to have a relatively higher opportunity cost of time. Only 29 households in the sample received child support payments.
3.3 Control Variables
holder. We proxy for wealth with the average daily balance in the checking account, an imperfect proxy but still valuable as a control variable. Income is observed through direct deposit of paychecks. Imputed income is included for those without direct deposit; an indicator variable marks such observations. Throughout the paper regression coefficients are reported for income but not for imputed income or the indicator of missing income.
4. Evidence
This section presents the results of empirical tests of the two claims of this paper. First, some consumers use debit cards to restrain their spending. Second, there is mixed evidence on whether this need for spending control is behavioral or a low cost substitute for budgeting. We begin with the latter.
4.1 Debit Cards as a Tool of Self-Control
By confirming hypotheses 1, 2, and 3 the results support spending control as a motive for using debit. We treat each in turn.
4.1.1 Debit Users Carry Credit Card Balances
In order to test H1, we seek evidence that debit card users who also make credit card payments are not just paying for recent credit card transactions but rather are paying to reduce a balance carried from a previous statement period. Therefore, we look for evidence that debit card users are also credit card revolvers.
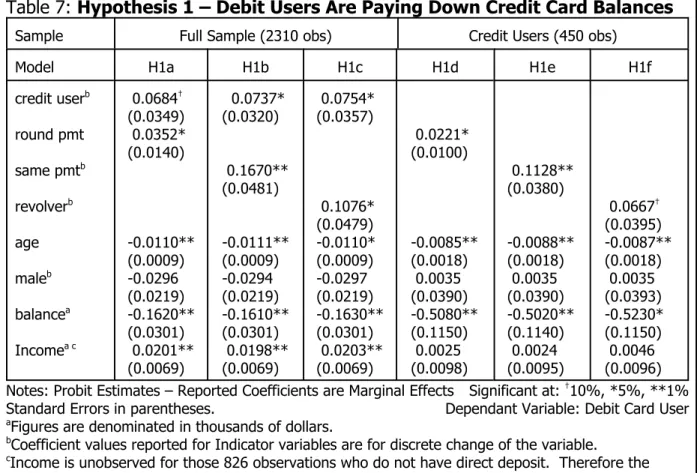
characteristics and the variables of interest. In all equations, the coefficients on RoundPmt , SamePmt , and Revolver are positive and significant. This result indicates that debit card users, when also using a credit card are likely to be paying down a balance rather than paying for recent purchases.
In equations (H1a), (H1b), and (H1c) the full sample is used and we control for credit users in the regression. Equations (H1d), (H1e), and (H1f) we restrict the sample to only credit card users. In this restricted sample the coefficients on RoundPmt , SamePmt , and Revolver are still positive and significant. In the restricted sample, the sample bias discussed in section (3) biases our results downward, against the model predictions. Zinman (2004 and 2006) also finds
Sample Full Sample (2310 obs) Credit Users (450 obs)
Model H1a H1b H1c H1d H1e H1f
credit userb round pmt same pmtb revolverb age maleb balancea Incomea c 0.0684† (0.0349) 0.0352* (0.0140) -0.0110** (0.0009) -0.0296 (0.0219) -0.1620** (0.0301) 0.0201** (0.0069) 0.0737* (0.0320) 0.1670** (0.0481) -0.0111** (0.0009) -0.0294 (0.0219) -0.1610** (0.0301) 0.0198** (0.0069) 0.0754* (0.0357) 0.1076* (0.0479) -0.0110* (0.0009) -0.0297 (0.0219) -0.1630** (0.0301) 0.0203** (0.0069) 0.0221* (0.0100) -0.0085** (0.0018) 0.0035 (0.0390) -0.5080** (0.1150) 0.0025 (0.0098) 0.1128** (0.0380) -0.0088** (0.0018) 0.0035 (0.0390) -0.5020** (0.1140) 0.0024 (0.0095) 0.0667† (0.0395) -0.0087** (0.0018) 0.0035 (0.0393) -0.5230* (0.1150) 0.0046 (0.0096) Notes: Probit Estimates – Reported Coefficients are Marginal Effects Significant at: †10%, *5%, **1%
Standard Errors in parentheses. Dependant Variable: Debit Card User
aFigures are denominated in thousands of dollars.
bCoefficient values reported for Indicator variables are for discrete change of the variable.
cIncome is unobserved for those 826 observations who do not have direct deposit. Therefore the
coefficient on income reflects only 1484 observations. For the other observations an imputed income is used (coefficient not reported) and for all observations an indicator variable designates observations for which income is imputed (coefficient not reported).
revolving credit card balances to be significantly correlated with debit card use in survey responses.
The model also indicates that revolvers are generally accumulating credit card balances and debit users are paying down balances. In reality, some debit users may pay round amounts but not enough to cover credit card purchases, thus accumulating balances. This type of person would be identified as a debit card user and identified as one who carries a balance. The fact that some of these balances are rising only strengthens the argument that debit users are
overspenders.
The model indicates that one advantage of credit is for consumption smoothing. Even credit users with N<N* will occasionally charge in excess of income and then pay part of the bill leaving the rest for next period when expenditure likely is less. In this case, the credit user would likely pay a round increment. If the same thing happens in two adjacent periods, the credit user would pay the same amount in two periods. This will also bias the results toward downward.
BKA and Zinman (2004) offer reasons that people use debit cards. Among them are inability to qualify for a credit card, convenience, time at checkout, rewards, desire for cash back at checkout, and record keeping. If some debit users are credit constrained, they will not have credit card balances. This lowers average balances of debit users making it less likely to detect a correlation between debit use and paying a balance which would bias the result toward zero.
If people use debit out of convenience, then there is no reason to believe that debit use will be correlated with credit card balances. If people use debit because it is quicker at the checkout, then it should be correlated with wage rate, but the regressions control for income. The data providers do not offer rewards on their debit card so this can not be a motive for using
debit in these data. People can get cash with their debit card purchase at a supermarket thus avoiding the need for a trip to the ATM. We might expect that people who are averse to spending $1.50 at the ATM would also be averse to paying credit card interest. In which case, we would expect the opposite results.
Potentially, people who carry credit card balances would be more likely to value/need tracking (from a debit or credit card as opposed to cash or check). But if this is the case, the purpose of the tracking is as a tool of spending restraint, which is consistent with our model. BKA recognizes this interpretation of the tracking motive.
Finally, note that the coefficient on credit card user is positive and significant across the regressions. This can be interpreted as a comfort for/aversion to plastic. It also supports the idea that debit card users are former credit card users who got into trouble with credit and are now either paying down those balances, or reserve credit for only large purchases of durables.
4.1.2 Debit Users Have Greater Purchase Variety
H2 predicts that debit users will purchase a greater variety of goods – they will have a greater variation in purchase locations. The variable LocationRatio is a measure of purchase dispersion. (See section 3 for details on this variable.) Table (8) shows the results of regressions including this variable. Equation (H2a) show that the coefficient on LocationRatio is positive and significant despite the bias indicted in section 3. This indicates that debit card users purchase at a greater variety of locations than non debit users – that debit users have a more ambitious shopping list, ceterus paribus (not all of which are purchased in any one period). This result could be interpreted as debit users being impulse purchasers.
This result could be a comfort-with-technology effect; i.e., plastic users (both debit and credit) use more purchase locations than paper users (checks and cash). To weed out this
possibility, consider equations (H2b), (H2c) and (H2d). Equations (H2b) and (H2c) restrict the regression to plastic users and credit users respectively and still debit card users do indeed show a greater variety of locations. Finally, using the whole sample again, equation (H2d) regresses credit card users on the same factors as equation (H2a) but the number of purchase locations does not predict credit card use. These three equations effectively rule out the possibility that debit users’ variety of ATM locations is simply a comfort-with-technology effect.
Another possible alternative explanation is a merchant acceptance effect. Such an explanation would be that merchant non-acceptance of debit cards causes debit users to use cash more frequently (at more locations) than credit users do. However, in our data sample merchant acceptance of credit and debit should be identical. At the time of our data collection, in 2003, Visa and MasterCard were still enforcing the honor all cards rule which stated that any merchant accepting Visa or MasterCard branded credit cards must likewise accept Visa, or MasterCard
Equation H2a
(All Accounts) (Plastic Users)Equation H2b (Credit Users)Equation H2c (All Accounts)Equation H2d
Dep Var: Debit User Debit User Debit User Credit User
Coef Std Err Coef Std Err Coef Std Err Coef Std Err
credit userb debit userb locations age maleb balancea Incomea c .068** .286** –.0041** –.015 –.069** –.006 .022 .036 .0010 .021 .026 .006 .038* –.0007 .011 –.012 –.0034 .017 .0004 .009 .008 .0018 .162** –.0026 .035 –.377** –.0004 .057 .0014 .029 .082 .0064 .084** .050 –.0009 –.007 –.130* .024** .027 .042 .0010 .022 .064 .005 no. of obs 1488 1238 360 1488
Note: Probit Estimates – Reported Coefficients are Marginal Effects Significant at: *5%, **1%
aFigures are denominated in thousands of dollars.
bCoefficient values reported for Indicator variables are for discrete change of the variable. cSee footnote c in table (7).
respectively, branded debit cards. This rule was phased out in 2004.
This result is taken as strong evidence for certain features of the model. Specifically, it supports the idea that debit card users have a more ambitious shopping list than they can ultimately purchase in a period.
4.1.3 Debit Users Hold Less Cash
Consider H3 – a consumer limits liquidity in order to restrain spending. Debit cards are one method of reducing liquidity; another method is to limit cash holding. A correlation
between debit use and low cash holding is further evidence that debit use, like low cash holding, is related to spending restraint (See Section 3). The four columns of table (9) are similar to those in table (8). In the primary equation (H3a), the coefficient on NoWithdr and WithdrSize are significant at the 1% and 5% levels respectively. This result suggests that debit users carry less cash (i.e., withdraw more often but less each time; NoWithdr>0, WithdrSize<0). Even when
Equation H3a
(All Accounts) (Plastic Users)Equation H3b (Credit Users)Equation H3c (All Accounts)Equation H3d
Dep Var: Debit User Debit User Debit User Credit User
Coef Std Err Coef Std Err Coef Std Err Coef Std Err
credit userb debit userb no withdr. withdr. size age femaleb balancea Incomea c .077** .0057** –.264* –.0044** .025 –.056* –.0013 .022 .0011 .113 .0009 .021 .027 .0059 .0015** –.035 –.0006 .0008 –.0081 –.0046* .0005 .048 .0004 .0088 .0081 .0018 .0040* –.185 –.0030* .0003 –.032** .0013 .0016 .236 .0014 .0298 .008 .0062 .093** –.0011 –.087 –.0012 –.018 –.136* .025** .027 .0010 .173 .0010 .022 .065 .006 no. of obs 1488 1238 360 1488
Note: Probit Estimates – Reported Coefficients are Marginal Effects Significant at: *5%, **1%
aFigures are denominated in thousands of dollars.
bCoefficient values reported for Indicator variables are for discrete change of the variable. cSee footnote c in table (7).
compared to debit non-users some of whom use cash primarily, debit users have more frequent withdrawals.
The positive sign on NoWithdr could be a comfort-with-technology effect. In order to preclude this possibility, equations (H3b) and (H3c) restrict the sample to plastic users and credit users respectively. And equation (H3d) uses all consumers who make ATM withdrawals but the dependent variable is credit users. In equations (H3b) and (H3c), the coefficient on number of withdrawals remains significant and positive indicating that this is not a comfort with technology effect. Finally, equation (H3d) shows that credit users do not carry less cash. These three
equations indicate that Equation (H3a) is not showing a comfort-with-technology effect but rather a debit card effect.
In addition to spending control motivations, people could desire to carry less cash at any one time due to crime concerns or liquidity reasons. Due to a lack of variation in crime across customers, it is difficult to test crime as a driver of carrying less cash. This lack of variation in the data also makes it unlikely that crime is driving the differences in cash carrying. Debit card users are making all payments out of liquidity. Therefore, it is unlikely that debit card users are also making small ATM withdrawals out of a lack of liquidity. Thus, the results of this section, a correlation between debit card use and carrying small amounts of cash, is taken as evidence for the spending control motive. <get crime stats for milwaukee and compare to ATM addresses>
4.1.4 Debit Users, Revolvers and Transactors
While the dependant variable distinguishes debit users from non-users, three groups appear in the model. First, there are those with N<N* ; they use a credit card and are called transactors because they do not carry a balance. Second are those for whom N>N* but are unaware of this fact; they are revolvers since they carry a credit card balance. Finally, there are
those who know that N>N* ; they use debit.
This creates an estimation problem. High balance revolvers are mixed with the no balance transactors (both groups are debit non-users). According to the model, debit users and credit card revolvers should carry a balance and credit transactors should not. Some people with self control problems are not yet using debit. The presence of the revolvers with the transactors biases the results toward zero. If fact, despite this effect weakening the results we still see strong results – z-scores of 2.6 and 3.2 for the hypothesis (1) equations, z-scores of 7.8 for the
hypothesis (2) equation, and 4.8 and 2.3 in the hypothesis (3) equations.
Two other interesting results deserve note. When controlling for income, wealth
(account balance) is negatively related to the likelihood of using a debit card. This is consistent with the theory that debit cards are used to restrain spending; i.e. those maintaining liquid wealth do not need spending restraint.
Second, when controlling for features of ATM use (tables 8 and 9), income has no recognizable impact on debit card use. These results are similar to Stavins’ (2001) and Borzekowski and Kiser’s (2006) findings. This result contradicts the Ameriks, Caplin and Leahy (2004) model in which the monitoring technology is decreasing in income. Other research has a mixed message on income. Mantel and McHugh (2001) find that debit usage increases with income. Carow and Staten (1999) find that debit usage is inverse u-shapped (highest among middle-income). It is interesting that debit cards are not positively related to income and wealth, as other electronic payments tend to be and as new technology in general tends to be.
4.1.5 Comparison with Survey Evidence
7This assumes that being a censored observation is independent of this alternative to debit. Since the survey did not ask explicitly for an alternative to credit the missing data likely cards as a form of spending restraint. This number is quite striking when one considers that Zinman found 30% of debit users to be ripe for potential spending control explanations. A first look at the BKA data seems to trivialize spending control as a motivation for debit use. Table (4) of BKA reports that 5.8% of debit card users report using debit cards for spending restraint. Upon closer analysis, a substantial number of consumers cite spending control.
BKA consider four payment options: cash, check, debit and credit. Recall the current funds/future funds distinction illustrated in figure (1). Under this framework, cash, check and debit are contemporaneous payment instruments whereby one pays out of liquidity and so could be used for spending restraint. Credit is a form of borrowing. This nesting structure is verified by BKA’s and Borzekoswki and Kiser’s result that debit’s closest substitutes are cash and check. The aggregate survey results incorporate respondents who reported their preference of debit over cash, of debit over check and of debit over credit. With a narrower research question than BKA, we are interested only in those who reported their reason for using debit instead of credit.
Using the reported results from tables (3) and (4) of BKA we can narrow the sample to those who reported why they use debit rather than credit. The percentage of people reporting debit as an alternative to credit is reported in table (3) of BKA. Table (3) reports that 19.4 percent of debit users chose debit as an alternative to credit and another 21.4% mention no alternative to debit. Allocating these proportionately to cash, check and credit7, the percentage of those using debit instead of credit rises to 24.7% or 166 respondents. From Table (4) of BKA, 5.8% or 39 respondents cite spending control motives. Therefore, 39 of 166 respondents, or 23.5%, of people reporting debit as an alternative to credit cite spending control motives. This is
too large a share to dismiss spending control as unimportant.
4.2 Cost Based vs. Behavioral Explanation for Overspending
Hypothesis 4 is a result of the cost model. It says that if the cost based model is accurate, then debit cards and budgeting are substitute tools of spending control. Thus consumers with a low opportunity cost of time are more likely to budget and therefore less like to need debit as a tool of spending restraint. Behavioral explanations dominate if opportunity cost of time is not correlated with debit card use. We develop three indicators of opportunity cost of time. First, households with a joint account but only one income source have low cost of time. Second, the more sources of income a household has, (the more jobs it works) the less time it has. And third, single parent households (receiving child support payments) have a high opportunity cost.
Regression results are reported in table (10). The signs on all three measures of
opportunity cost are as expected. Those working multiple jobs and single parents are more likely to use debit cards. The variable NoPaychecks is significant at the 1% level providing support for the cost based model. The variable ChildSupport is not significant. However, when run
separately (equation H4d) this variable is significant at the 10% level. With such a small population of child support recipients (29 out of 1484 accounts) it is not surprising that we can not achieve high levels of statistical significance. Thus this variable provides little, if any, support for the cost model. Being a one income family is not statistically related to using a debit card in either equation (H4a) or (H4b), providing no support for the cost model. These results are largely inconclusive on the question of whether debit cards are a cost minimizing tool for
spending control or the long-run self’s weapon in the battle against the short-term self. There is probably some truth in both explanations, though it is up to future work to find the evidence.
5.
C
ONCLUSION
This paper helps to explain why such large numbers of consumers are choosing debit cards (current liquidity) as their primary method of payment for purchases despite a seemingly more cost effective alternative in credit cards (future liquidity). The theory presented posits that debit cards, being a method for accessing cash on hand, provide a needed level of spending restraint for consumers who lack self control when using a payment method which embodies borrowing – short-term and zero-interest if used responsibly but high-interest if used in the longer term.
A data set containing transaction records for 2310 checking accounts including debit card
Equation (H4a) Equation (H4b) Equation (H4c) Equation (H4d)
Coef Std Er Coef Std Er Coef StEr Coef St Er
nonworkingadultb no paychecks child supportb age male balancea Incomea c –.0053 0.069** 0.157 –0.012** –0.034 –12.1** 1.59* .0281 .026 .081 .001 .026 3.12 .067 –0.037 –0.011** –0.033 –12.9** 2.12** .026 .001 .026 3.13 .64 0.076** –0.012** –0.039 –12.0** 1.52* .024 .001 .026 3.12 .66 0.178 –0.011** –0.034 –12.9** 2.17** .073 .001 .026 3.13 .64 Notes: Probit Estimates – Reported Coefficients are Marginal Effects Significant at: *5% **1%
Number of Observations 1484 Dependant Variable: Debit Card User
aFigures are denominated in thousands of dollars.
bCoefficient values reported for Indicator variables are for discrete change of the variable. cSee footnote c in table (7).
purchases and credit card payments is employed to test key aspects of the theory. Findings support the theory of debit cards as a tool which restrains overspending. They show that debit card users, when making credit card payments, are more likely to be paying off large balances. And they show that debit card users are likely to have a greater profusion of shopping locations as is predicted by the model. Finally, they show that debit users carry less cash (i.e., withdraw smaller amounts of cash more often).
The model also offers two potential explanations as to the cause of the overspending, cost based and behavioral. We test the two explanations with mixed results. Three measures of opportunity cost of time are developed. One points to cost based factors, one is more favorable toward behavioral explanations, the third is mixed.
Finally, the model indicates that using a credit card is superior to a debit card, not just because of the pecuniary factors listed in the introduction, but also because those who enter shopping with an accurate picture of their spending potential can select the optimal goods. Whereas, those who shop until they run of our money are subject to the random arrival of goods.
One much noted predictor of payment method is purchase size. Large purchases are more likely to be credit transactions. Larger purchases, however, are more likely to be one-time purchases; thus, are better candidates for intentional borrowing. This work abstracts away from issues of intentional borrowing or purchase size. Rather, purchase size is held constant and purchases are part of recurrent expenses. The logical implication of the result that consumers spend less with debit cards is that they spend more with credit cards. This fact is defended in stark terms by retail, banking and credit card executives. However, less academic work has shown that businesses are justified in accepting the high interchange fees of credit cards.
R
EFERENCES
Ameriks, John, Andrew Caplin and John Leahy, “The Absent-Minded Consumer”, NBER Working Paper No. 10216, January 2004.
Ashraf, Nava, Dean Karlan and Wesley Yin, “Tying Odysseus to the Mast: Evidence from a Commitment Savings Product in the Philippines”, The Quarterly Journal of Economics, Vol 121, No 2, May 2006, p 635-672.
Ausubel, Lawrence M., “The Failure of Competition in the Credit Card Market”, American Economic Review, Vol 81, No 1, March 1991, p 50-81.
Bertaut, Carol C., and Michael Haliassos, “Debt Revolvers for Self Control”, University of Cyprus Working Papers in Economics #0208, June 2002.
Borzekowski, Ron and Elizabeth Kiser, “The Choice at the Checkout: Quantifying Demand Across Payment Instruments”, Federal Reserve Board FEDS papers #2006-17, February 2006. Borzekowski, Ron, Elizabeth Kiser and Shaista Ahmed, “Consumers’ Use of Debit Cards: Patterns, Preferences, and Price Response”, Federal Reserve Board FEDS papers #2006-16, February 2006.
Card Industry Director: The Blue Book of the Credit and Debit Card Industry in North America, 16th edition, Dennis Shaw, Editor, Thompson Media, New York, © 2004.
Carow, Kenneth A. and Michael E. Staten, “Debit, Credit, and Cash: Survey Evidence on Gasoline Prices”, Journal of Economics and Business, Vol 51, No 5, September 1999, p 409-422.
“EFT Data Book: The Complete Guide to the ATM and POS Debit Markets, 2005 edition”, ATM & Debit News, Vol 4, No 45, September 16, 2004, Thompson Media.
Fudenberg, Drew and David K. Lavine, “A Dual Self Model of Impulse Control”, Harvard mimeo, 2006.
Fusaro, Marc Anthony, “Consumers’ Bank Choice and Overdraft Volumes: An Empirical Study of Bounce Protection Programs”, mimeo, East Carolina University, 2003
Fusaro, Marc Anthony, “Modeling Consumers’ Checking Account Behavior: An Empirical Study of Bounce Protection Programs”, East Carolina University, Department of Economics Working Paper #0505, January 2005.