AGRONOMIC STUDIES OF FORAGE BRASSICAS AS FULL-SEASON AND COVER CROPS FOR GRAZING IN NORTH DAKOTA
A Dissertation
Submitted to the Graduate Faculty of the
North Dakota State University of Agriculture and Applied Science
By
Osvaldo Roberto Teuber Winkler
In Partial Fulfillment of the Requirements for the Degree of
DOCTOR OF PHILOSOPHY
Major Department: Plant Sciences
May 2017
North Dakota State University
Graduate School
Title
AGRONOMIC STUDIES OF FORAGE BRASSICAS AS FULL-SEASON AND COVER CROPS FOR GRAZING IN NORTH DAKOTA
By
Osvaldo Roberto Teuber Winkler
The Supervisory Committee certifies that this disquisition complies with North Dakota State
University’s regulations and meets the accepted standards for the degree of
DOCTOR OF PHILOSOPHY SUPERVISORY COMMITTEE: Dr. Marisol Berti Chair Dr. Edward Deckard Dr. Burton Johnson Dr. Kevin Sedivec Dr. Larry Cihacek Approved:
July 3, 2017 Dr. Richard Horsley
iii ABSTRACT
Annual forages represent a good feed resource to extend the grazing season into fall and winter, providing a good quality forage for the livestock, allowing more efficient use of
rangeland, and improving soil properties. Many species in the Brassicaceae family are used as forages for grazing. Forage brassicas have high forage yield, high nutritive value, low cost of establishment and harvest (direct grazing), and provide many ecosystems services. Forage brassicas can be grown as full season forage crops or as cover crops planted after a grain crop. The objectives of this study were:1) to identify brassicas species and cultivars with high biomass production and forage quality when grown as full-season and as cover crops; 2) to determine their optimum sowing date, plant density and the response to different N and S fertilization rates. Replicated experiments were conducted at four sites Fargo, Prosper, Carrington and Walcott, ND in 2012-2014. Results indicate swede (Brassica napus L. var. napobrassica) and kale
[B.oleraceae L. convar. acephala (DC)] were the highest forage yielding brassicas when established in full-season and turnip [Brassica rapa L. var. rapa (L.) Thell).], cv. ‘Appin’ was the highest yielding sown in August. In full-season brassicas, delaying sowing date reduced total forage yield but did not influence forage quality. In brassicas sown after August, total forage yield decreased significantly only in radish in the second sowing date. Plant density did not have an effect on forage yield averaged across environments and species in full-season forage
brassicas. This was different in brassicas sown after August, where the highest forage yield was obtained with the highest plant density (≥200 plants m-2). Kale and swede leaf and root/stem
yield increased up to 200 kg N ha-1 in a linear response. Sulfur and the interaction between N and S did not have an effect in forage yield and quality. Both full-season and cover crops forage brassicas have great potential as supplemental high quality forage for grazing in North Dakota.
iv
ACKNOWLEDGMENTS
There are so many people and institutions to thank for helping me during my five years living, studying, and working at NDSU. I would like to thank my advisor, Dr. Marisol Berti for her guidance and dedication to help me in my program, my research and my dissertation. My thanks to my committee members, Dr. Edward Deckard, Dr. Burton Johnson, Dr. Larry Cihacek and Dr. Kevin Sedivec for their advice and help with my research and this dissertation.
I would like to thank all my NDSU´s teachers, Plant Science´s office staff, technicians and classmates, who in one or another way help and support me. My deepest appreciation and gratitude to full and part-time forage team members, Alfredo, Dulan, my wife Johanna, Bob, Steven, Devan, and Zachary, for all support and help in those long and hard lab and field works.
My sincere gratitude to Fulbright Commission, NDSU´s Plant Sciences Department, CONICYT (National Commission for Scientific and Technological Research of Chile) and my institution INIA (Agricultural Research Institute of Chile), for their financial support.
To all my friends, from different nationalities and parts of the world, who were my family here in the USA. Specially, my thanks to Viviana, Gonzalo, Patty, Franco, Sergio, Adnan, Isaias and family, the Osorno´s, The Maerten´s, the Secor´s, the Eggum´s and all my latino´s friends.
Finally, I would like to thank my family in Chile who supported and encouraged me from the distance, on the earth or in the heaven, my parents, grandparents, parents in law, and all my closer relatives. Especially, I would like to thank from the bottom of my heart to my beloved wife Johanna and daughter Catalina, who believed in me and left everything behind to
accompany me in this adventure. They, with their unconditional love helped me, supported me, and encouraged me every day to reach this dream and accomplishment.
v
DEDICATION
I dedicate this dissertation to my parents Sonia and Egon, my grandparents Elsa and Roberto and my Tante Iris, who gave me the knowledge and values to be the person I am today and the
education to be the professional I am today.
To my parents in law, closer relatives and friends in Chile and USA who have always been there to support me and give me a word of encouragement when everything looked dark and without
sense.
To my beloved daughter Catalina who gave me the joy of being a father, and who anonymously inspired me and encorauged me to work hard to demonstrate her that everything is possible in our life, when you fight for your dreams and ideals. Also, for being my beloved “perrito” who
have demonstrated me her unconditional love in every moment of my life.
Finally, to my beloved wife Johanna who was my partner and friend at the university; my pillar and my support in my studies and our home, my compass and my ground wire in this journey, and my adviser and friend in my life. Thank you for being by my side in this adventure, for your
comprehension and strength in difficult times, for being the support of our family, for your unconditional love, and for being my love…I love you.
vi TABLE OF CONTENTS ABSTRACT……….. ACKNOWLEDGMENTS………...………... DEDICATION………...………. LIST OF TABLES………..………… LIST OF FIGURES……… CHAPTER 1. INTRODUCTION………... CHAPTER 2. LITERATURE REVIEW……… 2.1. Forages brassicas………...
2.1.1. Botanical classification and species……….………. 2.1.2. History and distribution of forage brassicas………... 2.1.3. Characteristics of brassicas as forage………... 2.1.3.1. Phenology……….. 2.1.3.2. Physiology………... 2.1.4. Forage brassica biomass production………. 2.1.5. Forage brassicas management………... 2.1.5.1. Field selection and soil preparation………... 2.1.5.2. Sowing date and sowing depth………... 2.1.5.3. Sowing rate and plant density……… 2.1.5.4. Fertilization response…………... 2.1.5.5. Other managements……….……….. 2.2. Cover Crops………... 2.2.1. Benefits of cover crops……….. 2.2.2. Challenges to grow cover crops………... 2.2.3. Soil health……….. iii iv v x xviii 1 4 4 4 5 6 6 7 9 11 11 12 13 15 21 23 23 24 25
vii
2.2.4. Soil erosion……….…... 2.2.5. Increasing soil fertility………...
2.2.5.1. Nitrogen fixation………... 2.2.5.2. Nitrogen scavenging………... 2.2.5.3. Scavenging of P and other nutrients…………... 2.2.6. Pest management………...
2.2.6.1. Weed control………..
2.2.6.2. Disease control………... 2.2.6.3. Insect and nematodes control………...
2.2.7. Agronomic management………... 2.2.7.1. Selection of cover crop species………... 2.2.7.2. Sowing date………... 2.2.7.3. Sowing rate and sowing depth…………... 2.2.7.4. Sowing method………..…... 2.2.7.5. Termination of cover crops………... 2.2.7.6. Cover crop biomass production………... 2.3. Brassicas forage quality………... 2.3.1. Crude protein………. 2.3.2. Fiber and digestibility……….…... 2.3.3. Energy and soluble carbohydrates……… 2.3.4. Minerals………. 2.3.5. Animal performance………...…... 2.3.6. Anti-nutritional compounds and animal health problems…………. 2.4. Literature cited………...…... CHAPTER 3. AGRONOMIC STUDIES OF FULL-SEASON FORAGE BRASSICAS.
30 31 31 32 35 37 37 39 40 41 41 41 42 42 43 44 45 46 46 47 48 49 50 53 71
viii
3.1. Abstract……… 3.2. Introduction……….…... 3.3. Materials and methods………... 3.3.1. Experimental sites………... 3.3.2. Experimental design and management…………... 3.3.3. Evaluations……….…... 3.3.4. Statistical analysis……….……… 3.4. Results and discussion………... 3.4.1. Rainfall, temperature and soil test………. 3.4.2. Forage brassica species and cultivars performance……….. 3.4.3. Sowing date experiment……… 3.4.4. Forage brassica and plant density effect………... 3.4.5. Forage brassica N and S effect……….. 3.5. Conclusions………... 3.6. Literature cited………. CHAPTER 4. AGRONOMIC STUDIES OF BRASSICA COVER CROPS……… 4.1. Abstract……… 4.2. Introduction………... 4.3. Materials and methods………. 4.3.1. Experimental sites………. 4.3.2. Experimental design and management……….. 4.3.3 Evaluations………... 4.3.4. Statistical analysis………. 4.4. Results and discussion………... 4.4.1. Rainfall and temperature………...
71 72 75 75 76 80 82 82 82 85 110 126 145 154 155 162 162 163 166 166 166 169 170 171 171
ix
4.4.2. Brassica cover crops species and cultivars performance………….. 4.4.3. Sowing date effect on brassica cover crops forage yield and
quality………... 4.4.4. Plant density effect on forage yield and quality of forage
brassicas……… 4.5. Conclusions………... 4.6. Literature cited………... 173 183 197 213 214
x
LIST OF TABLES
Table Page
3.1. Species/cultivars, 1000 seeds weight and sowing rate of forage brassicas planted at Carrington, Fargo, Prosper, and Walcott, ND, in 2012, 2013, and
2014……… 77
3.2. Sowing and harvest dates and number of days from sowing to harvest for all forage brassica experiments at Fargo, Prosper, Carrington, and Walcott, ND, in
2012, 2013, and 2014……….… 79
3.3. Soil test at the experimental sites in Fargo, Prosper, Carrington, and Walcott,
ND, for different forage brassica experiments, in 2012, 2013, and 2014…….…. 86 3.4. Analysis of variance and mean squares for forage brassica leaf biomass yield
(first and second harvest), total biomass yield, and total N in two environments,
Carrington and Fargo, ND, in 2012……….….. 89
3.5. Analysis of variance and mean squares for forage brassica root/stem, leaf and root yield, total N, dead matter yield, and total biomass yield in the last harvest
in two environments, Carrington and Fargo, ND, in 2012……….... 89 3.6. Mean biomass leaf yield and total N of forage brassica of two harvests
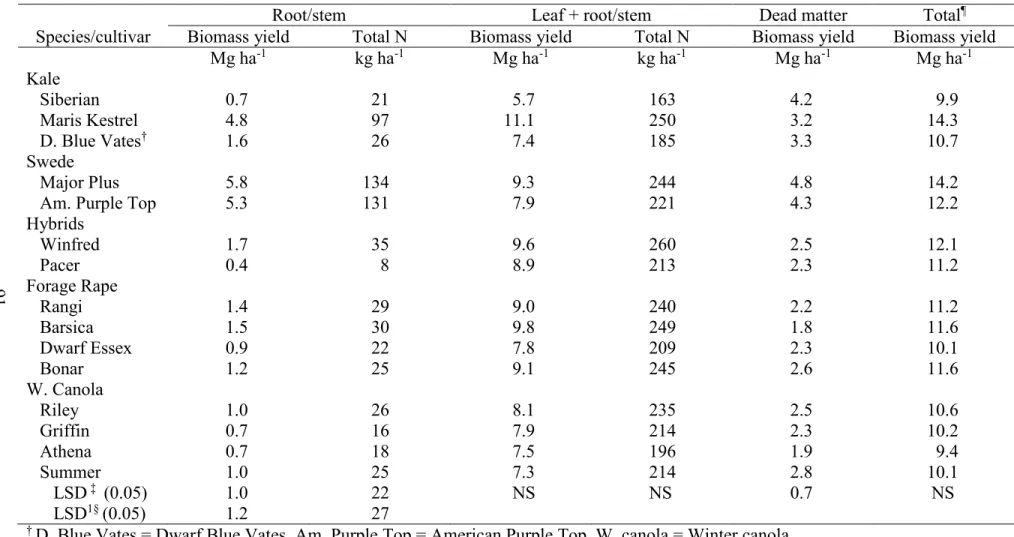
averaged across two environments, Carrington and Fargo, ND, in 2012……….. 90 3.7. Mean root and root +leaf yield, total N, biomass yield of dead matter, and total
biomass yield averaged across two environments, Carrington and Fargo, ND, in
2012……… 91
3.8. Analysis of variance and mean squares of leaf quality components in two harvests combined across two environments, Carrington and Fargo, ND, in
2012……… 94
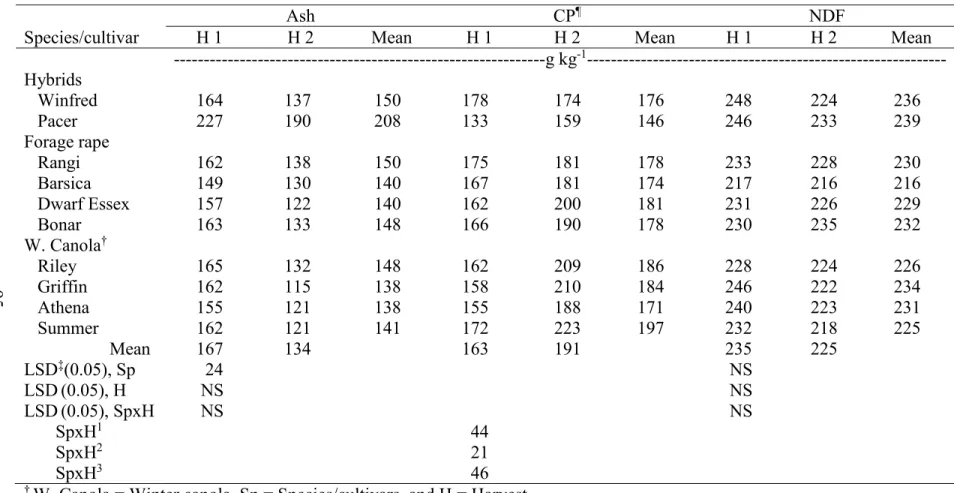
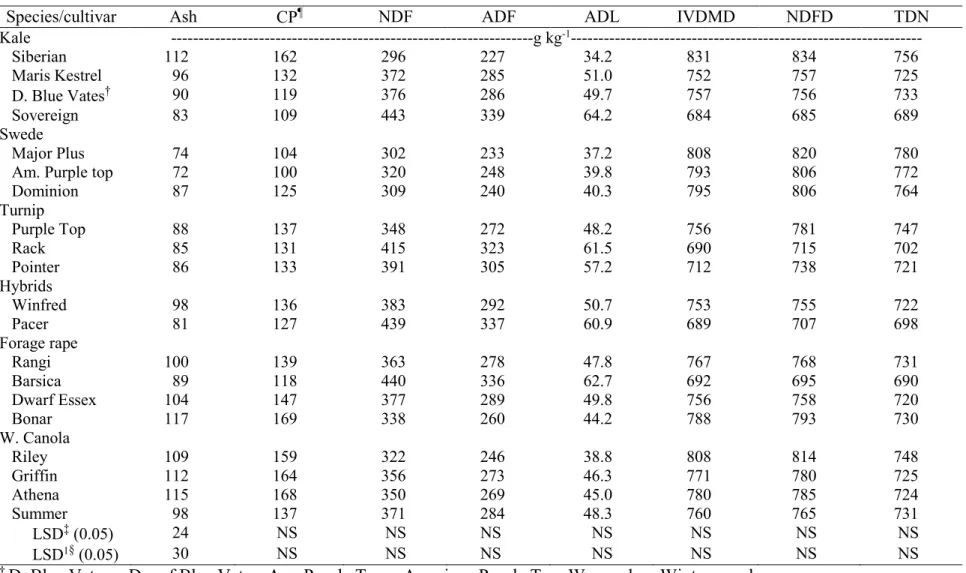
3.9. Mean forage quality of leaves (Ash, CP, and NDF) in two harvests combined
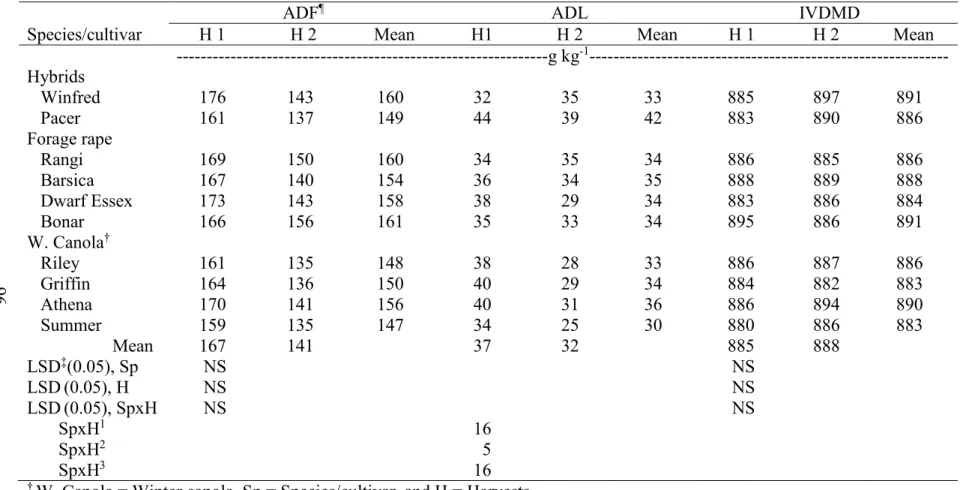
across two environments, Carrington and Fargo, ND, in 2012………. 95 3.10. Mean forage quality of leaves (ADF, ADL, and IVDMD) in two harvests
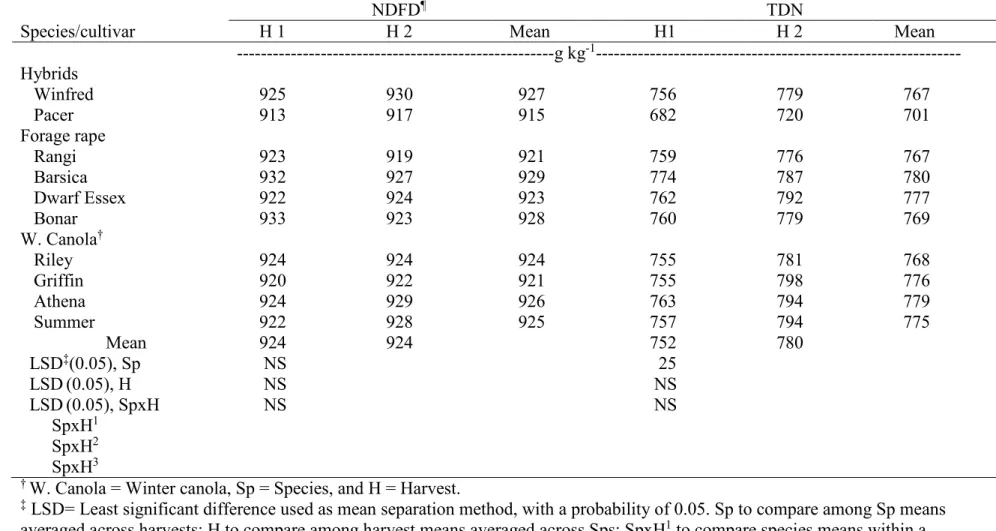
combined across two environments, Carrington and Fargo, ND, in 2012……… 96 3.11. Mean forage quality of leaves (NDFD and TDN) in two harvests combined
across two environments, Carrington and Fargo, ND, in 2012………. 97 3.12. Analysis of variance and mean squares of forage quality components of leaves
in two harvests combined across two environments, Carrington and Fargo, ND,
xi
3.13. Analysis of variance and mean squares of forage quality components of
root/stem in the last harvest combined across two environments, Carrington and
Fargo, ND, in 2012……… 100
3.14. Mean forage quality of root/stem in the last harvest combined across two
environments, Carrington and Fargo, ND, in 2012………... 101 3.15. Analysis of variance and mean squares for forage brassica leaf and root
biomass yield, total N, dead matter yield, and total biomass yield combined across two environments, Carrington and Fargo, ND, in 2013 and 2014,
respectively……… 104
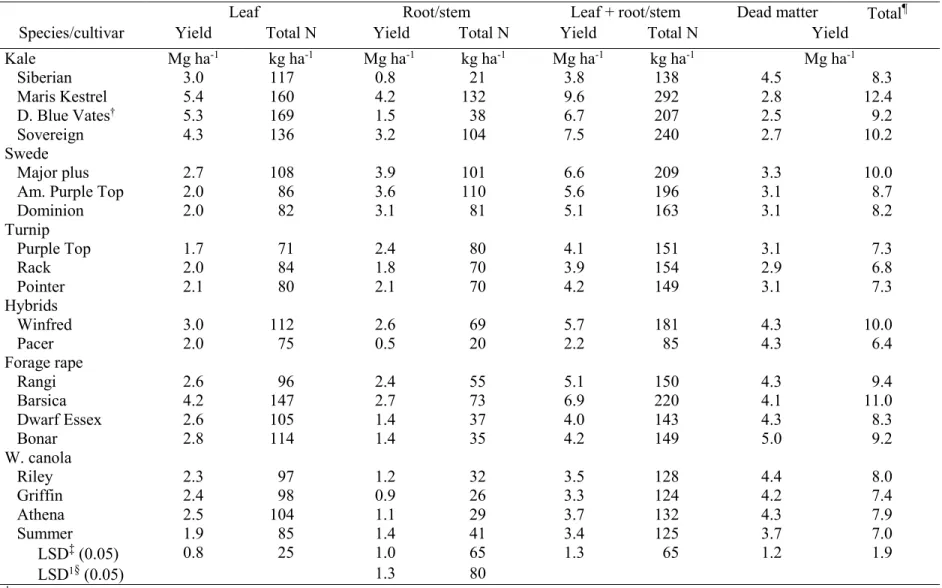
3.16. Mean biomass yield and total N of leaf, root/stem, and total biomass yield, dead matter, and total yield of different species/cultivars averaged across two
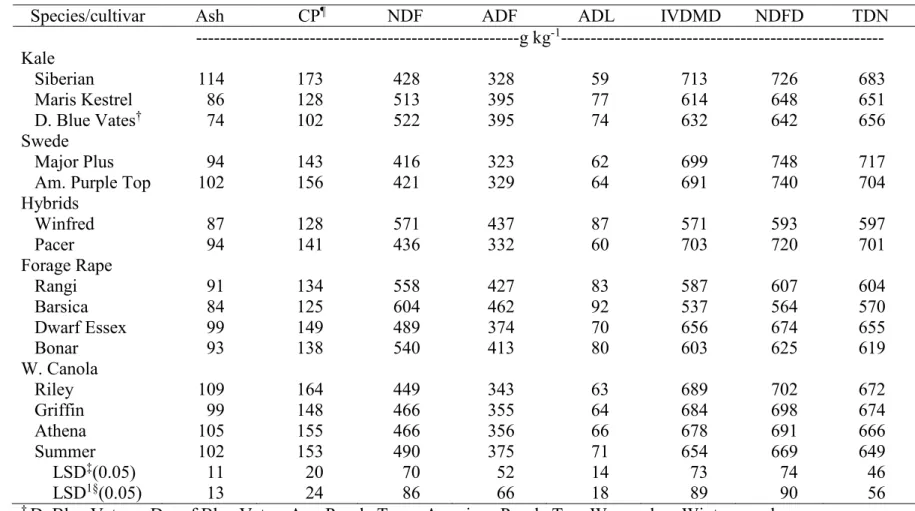
environments, Carrington and Fargo, ND, in 2013 and 2014, respectively…….. 105 3.17. Analysis of variance and mean squares of forage quality of leaves in Carrington
and Fargo ND, in 2013 and 2014, respectively………. 106 3.18. Mean forage quality of forage brassica leaves combined across two
environments, Carrington and Fargo ND, in 2013 and 2014, respectively……... 107 3.19. Analysis of variance and mean squares of quality variables of forage brassica
root/stem combined across two environments, Carrington and Fargo ND, in
2013 and 2014, respectively……….. 108
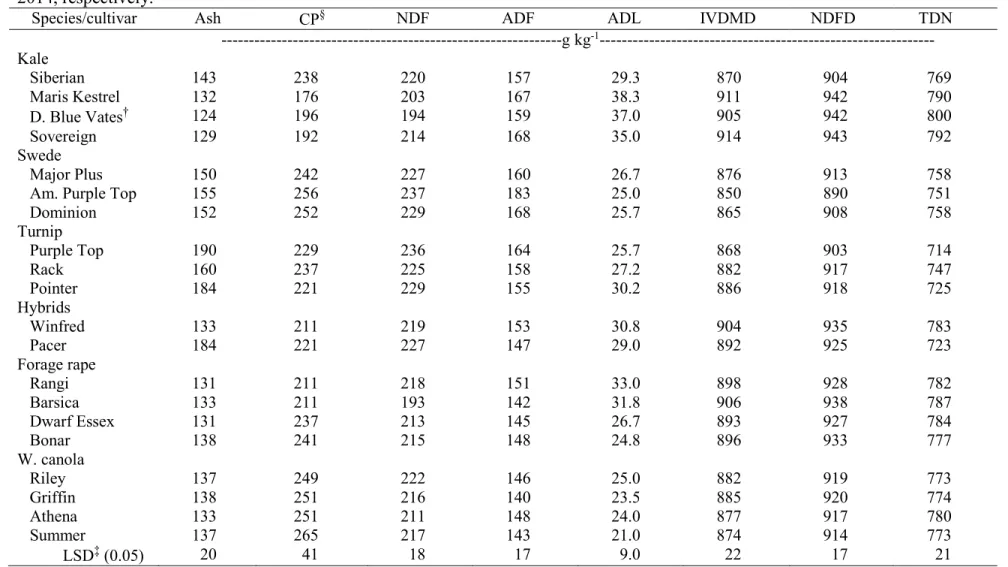
3.20. Mean forage quality of forage brassica root/stem combined across two
environments, Carrington and Fargo 2013-2014……….. 109 3.21. Analysis of variance and mean squares for forage brassica leaf, root/stem, leaf
+ root/stem, dead matter, and total biomass yield, and total N of forage biomass yield for forage brassica sowing date (SD) in four environments, Fargo and
Prosper ND, 2012 and 2014………... 114
3.22. Mean biomass yield of forage brassica leaf, root/stem and leaf + root/stem in four species and three sowing dates (SD) averaged across four environments,
Fargo and Prosper ND, in 2012 and 2014………. 115
3.23. Mean forage brassica leaf, root/stem, and leaf + root/stem yield and total N in four species and three sowing dates (SD) averaged across four environments,
Fargo and Prosper ND, in 2012 and 2014………. 116
3.24. Mean biomass yield of forage brassica dead matter and total biomass yield in four species and three sowing dates (SD) averaged across four environments,
Fargo and Prosper ND, in 2012 and 2014………. 117
xii
3.25. Analysis of variance and mean squares of forage quality components of leaves
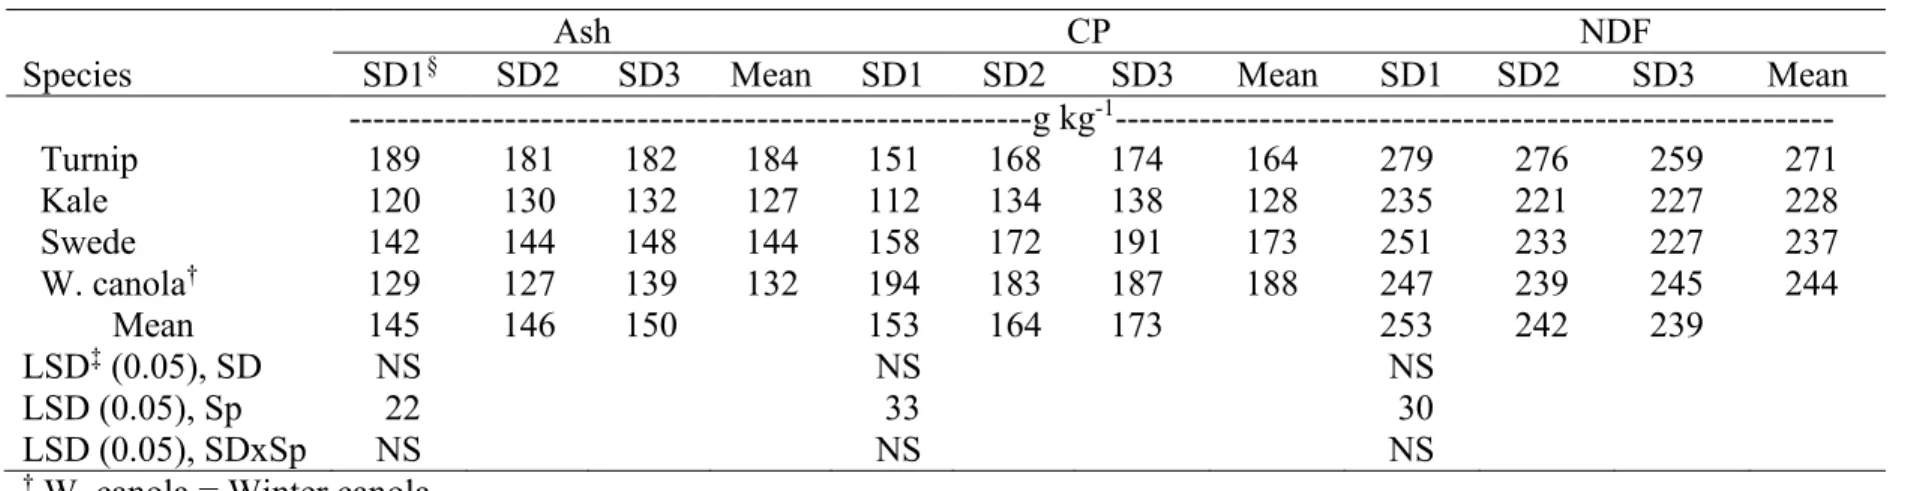
of forage brassica sowing date (SD) in Fargo and Prosper ND, 2012 and 2014... 118 3.26. Mean forage quality (Ash, CP and NDF) of forage brassica leaves with four
species and three sowing dates (SD) combined across all environments, Fargo
and Prosper ND, in 2012 and 2014……… 119
3.27. Mean forage quality (ADF, ADL, and IVDMD) of forage brassica leaves with four speciess and three sowing dates (SD) combined across all environments in
Fargo and Prosper ND, in 2012 and 2014………. 120
3.28. Mean forage quality (NDFD and TDN) of forage brassica leaves with four species and three sowing dates (SD) combined across all environments in Fargo
and Prosper ND, in 2012 and 2014……… 121
3.29. Analysis of variance and mean squares of forage quality components of brassica root/stem for forage brassica sowing date (SD) combined across four
environments, Fargo and Prosper ND, 2012 and 2014………. 122 3.30. Mean forage quality (Ash, CP, and NDF) of forage brassica root/stem with four
species and three sowing dates (SD) in Fargo and Prosper ND, in 2012 and
2014, and combined across all environments……… 123 3.31. Mean forage quality (ADF, ADL, and IVDMD) of forage brassica root/stem
with four speciess and three sowing dates (SD) in Fargo and Prosper ND, in
2012 and 2014, and combined across all environments……… 124 3.32. Mean forage quality (NDFD and TDN) of forage brassica root/stem with four
species and three sowing dates (SD) in Fargo and Prosper ND, in 2012 and
2014, and combined across all environments……… 125 3.33. Analysis of variance and mean squares for forage brassica leaf, root/stem, leaf
+ root/stem, dead matter, and total biomass yield, and total leaf, root/stem total N and total forage biomass yield for forage brassica plant density (PD) in Fargo
and Prosper ND, 2012 and 2014……… 128
3.34. Mean leaf biomass yield and total leaf N of forage brassica with three species and five plant densities (PD) averaged across four environments, Fargo and
Prosper ND, in 2012 and 2014……….. 129
3.35. Mean root/stem biomass yield and total root/stem N of forage brassica with three speciess and five plant densities (PD) averaged across four environments,
Fargo and Prosper ND, in 2012 and 2014………. 130
3.36. Mean leaf plus root/stem biomass yield and total forage N of forage brassica with three species and five plant densities (PD) averaged across four
xiii
3.37. Mean dead matter and total biomass yield of forage brassica with three species and five plant densities (PD) averaged across four environments, Fargo and
Prosper ND, in 2012 and 2014……….. 132
3.38. Final plant density of forage brassicas at harvest time at Fargo and Prosper,
ND, in 2012, and 2014………... 132
3.39. Analysis of variance and mean squares of forage quality components of leaves in three species and five plant densities (PD) combined across four
environments in Fargo and Prosper ND, in 2012 and 2014………... 134 3.40. Mean forage quality (Ash and CP) of forage brassica leaves in three species
and five plant densities (PD) combined across four environments in Fargo and
Prosper ND, in 2012 and 2014………... 135
3.41. Mean forage quality (NDF and ADF) of forage brassica leaves with three species and five plant densities (PD) combined across four environments in
Fargo and Prosper ND, in 2012 and 2014………. 136
3.42. Mean forage quality (ADL and IVDMD) of forage brassica leaves with three species and five plant densities (PD) combined across four environments in
Fargo and Prosper ND, in 2012 and 2014………. 137
3.43. Mean forage quality (NDFD and TDN) of forage brassica leaves with three speciess and five plant densities (PD) combined across four environments in
Fargo and Prosper ND, in 2012 and 2014……….. 138 3.44. Analysis of variance and mean squares of forage quality components of
brassica root/stem in three species and five plant densities (PD) in Fargo and
Prosper ND, 2012 and 2014………... 140
3.45. Mean forage quality (Ash and CP) of forage brassica root/stem in three species and five plant densities (PD) combined across four environments in Fargo and
Prosper ND, in 2012 and 2014………... 141
3.46. Mean forage quality (NDF and ADF) of forage brassica root/stem in three species and five plant densities (PD) combined across four environments in
Fargo and Prosper ND, in 2012 and 2014……….. 142 3.47. Mean forage quality (ADL and IVDMD) of forage brassica root/stem in three
species and five plant densities (PD) combined across four environments in
Fargo and Prosper ND, in 2012 and 2014……….. 143 3.48. Mean forage quality (NDFD and TDN) of forage brassica root/stem in three
species and five plant densities (PD) combined across four environments in
xiv
3.49. Analysis of variance and mean squares of relative values for brassica leaf, root/stem, leaf + root/stem, dead matter and total biomass yield, and total N for leaf, root/stem and total forage yield for N and S rates in Prosper 2012 and
2014 and Walcott, ND, in 2014………. 146
3.50. Analysis of variance and mean squares of absolute values for brassica leaf, root/stem, leaf + root/stem, dead matter and total biomass yield, and total N for leaf, root/stem and total forage yield for N and S rates in Prosper 2012 and
2014 and Walcott, ND, in 2014………. 147
3.51. Analysis of variance and mean squares of forage quality components of brassica leaves for N and S rates in Prosper 2012 and 2014, and in Walcott,
ND, in 2014……… 148
3.52. Analysis of variance and mean squares of forage quality components of brassica root/stem for N and S fertility in Prosper 2012 and 2014, and in
Walcott, ND, in 2014………. 149
4.1. Species/cultivars, 1000-seed weight and sowing rate of cover crops planted at
Fargo and Prosper, ND, in 2013 and 2014………. 167 4.2. Sowing and harvest dates and number of days from sowing to harvest in each
experiment at Fargo and Prosper, ND, in 2013 and 2014……….. 169 4.3. Analysis of variance and mean squares for tops, roots, top + root biomass yield
and total N of brassica cover crops in Fargo 2014 and Prosper 2013 and 2014,
ND……….. 177
4.4. Mean biomass yield of tops, roots, total forage, and total N of different species/cultivars of brassica cover crops averaged across three environments,
Fargo 2014 and Prosper 2013 and 2014, ND………. 178 4.5. Analysis of variance and mean squares of forage quality components of
brassica cover crop tops in three environments, Fargo 2014 and Prosper 2013
and 2014………. 179
4.6. Mean forage quality components of brassica cover crop tops averaged across
three environments, Fargo 2014 and Prosper 2013 and 2014……… 180 4.7. Analysis of variance and mean squares of forage quality components of
brassica cover crop roots in three environments, Fargo 2014 and Prosper 2013
and 2014………. 181
4.8. Mean forage quality of brassica cover crop roots averaged across three
environments, Fargo 2014 and Prosper 2013 and 2014………. 182
xv
4.9. Analysis of variance and mean squares for brassica cover crop tops, roots, top+root yield, and total N for sowing date (SD) in three environments, Fargo
2014 and Prosper 2013 and 2014………... 185
4.10. Mean biomass yield of brassica cover crop tops, roots, and top + root in four species and two sowing dates (SD) averaged across three environments, Fargo
2014 and Prosper 2013 and 2014………... 186
4.11. Mean total N of brassica cover crop tops, roots and tops + roots in four species and two sowing dates (SD) averaged across three environments, Fargo 2014
and Prosper 2013 and 2014……… 187
4.12. Analysis of variance and mean squares of forage quality components of brassica cover crops for two sowing dates (SD) in three environments, Fargo
2014 and Prosper 2013 and 2014………... 188
4.13. Mean forage quality (Ash, CP, and NDF) for brassica cover crop tops of four species and two sowing dates (SD) averaged across three environments, Fargo
2014 and Prosper 2013 and 2014………... 190
4.14. Mean forage quality (ADF, ADL, and IVDMD) for brassica cover crop tops of four species and two sowing dates (SD) combined across three environments,
Fargo 2014 and Prosper, ND, 2013 and 2014……… 191 4.15. Mean forage quality (NDFD and TDN) for brassica cover crop tops of four
species and two sowing dates (SD) combined across three environments, Fargo
2014 and Prosper, ND, 2013 and 2014……….. 192
4.16. Analysis of variance and mean squares of forage quality components of brassica cover crop roots of four species and two sowing date (SD) combined
across three environments, Fargo 2014 and Prosper 2013 and 2014………. 193 4.17. Mean forage quality (Ash, CP, and NDF) for brassica cover crop roots of four
species and two sowing dates (SD) averaged across three environments, Fargo
2014 and Prosper 2013 and 2014………... 194
4.18. Mean forage quality (ADF, ADL, and IVDMD) for brassica cover crop roots of four species and two sowing dates (SD) averaged across three environments,
Fargo 2014 and Prosper 2013 and 2014……… 195
4.19. Mean forage quality (NDFD and TDN) for brassica cover crop roots of four species and two sowing dates (SD) averaged across three environments, Fargo
2014 and Prosper 2013 and 2014………... 196
4.20. Analysis of variance and mean squares for root, tops+roots N total in a plant density (PD) study in three environments, Fargo, 2014 and Prosper, ND, in
xvi
4.21. Mean biomass yield and total N of tops of three species and four plant densities (PD) averaged across three environments, in Fargo 2014 and Prosper, ND, in
2013 and 2014……… 200
4.22. Mean biomass yield and total root N of three species and four plant densities (PD) averaged across three environments, in Fargo 2014 and Prosper, ND in
2013 and 2014……… 201
4.23. Mean biomass yield and total N of tops + roots of three species and four plant densities (PD) averaged across three environments in Fargo 2014 and Prosper
2013 and 2014……… 202
4.24. Species/cultivars and final plant density of cover crops at harvest time at Fargo
and Prosper, ND, in 2013 and 2014………... 202
4.25. Analysis of variance and mean squares of forage quality components of brassica cover crop tops for plant density (PD) in three environments, Fargo
2014 and Prosper 2013 and 2014………... 203
4.26. Mean forage quality (Ash and CP) for brassica cover crop tops of three species and four plant densities (PD), combined across three environments, Fargo 2014
and Prosper 2013 and 2014……… 204
4.27. Mean forage quality (NDF and ADF) for brassica cover crop tops of three species and four plant densities (PD), combined across three environments,
Fargo 2014 and Prosper 2013 and 2014……… 205
4.28. Mean forage quality (ADL and IVDMD) for brassica cover crop tops of three species and four plant densities (PD), combined across three environments,
Fargo 2014 and Prosper 2013 and 2014……… 206
4.29. Mean forage quality (NDFD and TDN) for brassica cover crop tops of three species and four plant densities (PD), combined across three environments,
Fargo 2014 and Prosper 2013 and 2014……… 207
4.30. Analysis of variance and mean squares of forage quality components of
brassica roots in a plant density (PD) study in Fargo 2014 and Prosper 2013 and
2014……… 208
4.31. Mean forage quality (Ash and CP) for brassica roots of three species and four plant densities (PD) combined across three environments, Fargo 2014 and
Prosper 2013 and 2014……….……….. 209
4.32. Mean forage quality (NDF and ADF) for brassica roots of three species and four plant densities (PD), combined across three environments, Fargo 2014 and
xvii
4.33. Mean forage quality (ADL and IVDMD) for brassica roots of three species and four plant densities (PD), combined across three environments, Fargo 2014 and
Prosper 2013 and 2014……….……….. 211
4.34. Mean forage quality (NDFD and TDN) for brassica roots of three species and four plant densities (PD), combined across three environments, Fargo 2014 and
xviii
LIST OF FIGURES
Figure Page
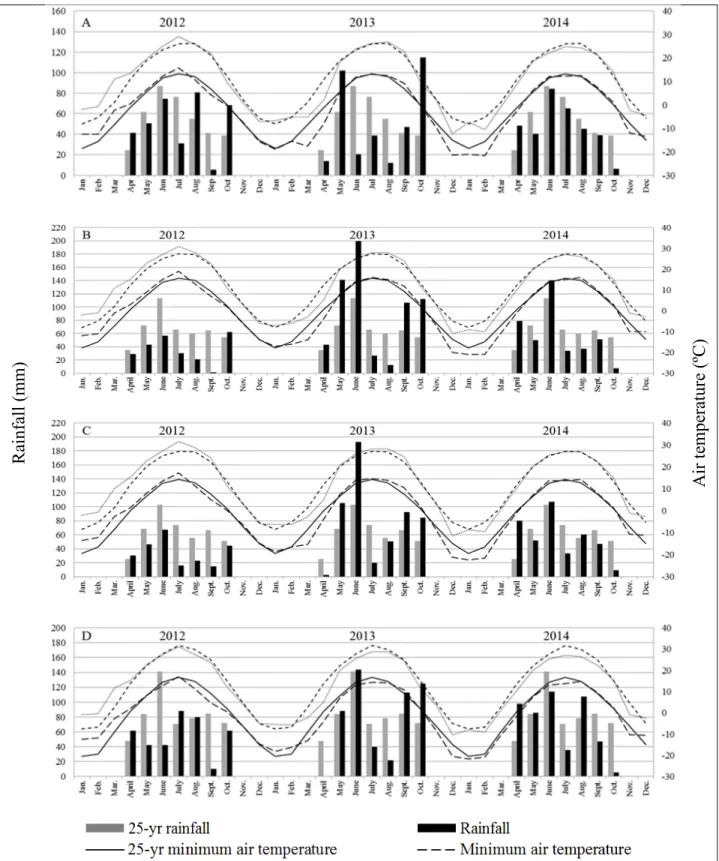
3.1. Monthly average minimum and maximum air temperatures and monthly total rainfall in 2012, 2013, and 2014 compared with the 25-yr (1990-2014) average
in Carrington (A), Fargo (B), Prosper (C), and Walcott (D)………. 84 3.2. Regression model for relative leaf (y1), root/stem (y2), and total forage yield
(leaf + root/stem, y3) of swede and kale averaged affected by different N rates averaged across three environments in Prosper and Walcott, ND, in 2012 and
2014……… 152
3.3. Regression model for relative dead matter (y1) and total biomass yield (leaf + root/stem + dead matter, y2) of swede and kale averaged, affected by different N rates averaged across three environments in Prosper and Walcott, ND, in
2012 and 2014……… 153
3.4. Regression model for relative leaf, root/stem, and leaf + root/stem total N of swede and kale averaged, affected by different N rates averaged across three
environments in Prosper and Walcott, ND, in 2012 and 2014……….. 153 4.1. Monthly average minimum and maximum air temperatures and monthly total
rainfall in 2013 and 2014 compared with the 25-yr (1990-2014) average at
1
CHAPTER 1. INTRODUCTION
Grassland and rangeland are widespread important ecosystems on the earth’s surface (White et al., 2000), compromising about 40% of the terrestrial area (FAO, 2005). In the Great Plains of North America, these ecosystems support many livestock operations and several ecosystem services (Allred et al., 2014). Unfortunately, the area of these natural ecosystems has declined due to their conversion to cropland, with a net loss of 9.3 million ha only between 1982 and 1997 (Samson et al., 2004). North Dakota reported 5.1 million ha grassland in 2012
(USDA-NRCS, 2015), about 1.8 million cows and calves (Bos taurus L.) and 65,000 sheep/lambs (Ovis aries L.), plus other minor animal species (USDA-NASS, 2012).
In North Dakota, forages are the third most important crop with 1.05 million ha in total and 165,457 ha of alfalfa (Medicago sativa L.) in 2015 (FSA, 2015). Although, annual forages are not extensively grown in the state, annual cereals such as oat (Avena sativa L.), barley (Hordeum vulgare L.), and oat/pea (Pisum sativum L.) mixtures are grown as emergency forage, after winter-killed alfalfa or just to increase forage availability early in the season. Annual forages represent a good feed resource to extend the grazing season into fall and winter, providing a good quality forage for the livestock (Neville et al., 2010), allowing more efficient use of rangeland, and at the same time improving soil properties (Sedivec et al., 2013).
Forage brassicas are annual forages species cultivated for livestock production (Najda, 1991; Smith and Collins, 2003), grown in New Zealand, Australia, North America (Jung et al., 1986; Jacobs et al., 2001; Nichol et al., 2003; Wilson et al., 2006, Neilsen et al., 2008; Keogh et al., 2011), Europe (Neilsen et al., 2008), and northern Asia (Bilgili et al., 2003). In the USA, forage brassicas were introduced between the 19th and 20th centuries but then almost abandoned in the 1950’s mainly due to lack of pest control methods and high production costs (Jung et al., 1984; Rao and Horn, 1986; Smith and Collins, 2003; McCartney et al., 2009).
2
Forage brassicas are characterized by high forage yield, with high nutritive value, low establishment and harvest cost (direct grazing), while providing many ecosystems services (Rao and Horn, 1986; Wiedenhoef and Barton, 1994; Ayres and Clements, 2002; Fulkerson, 2008; Neilsen et al, 2008; de Ruiter et al., 2009; Lemus, 2009; Rowe and Neilsen, 2010; Ward and Jacobs, 2013). Brassicas grow well with low temperature (0-5ºC) and they are tolerant to frost (-10ºC), extending the grazing season in the fall (McCartney et al., 2009; Ward and Jacobs, 2013). The extension of the grazing season reduces feeding costs, increasing the profitability of the operation (Penrose et al., 1996).
Brassicas have gained great importance as cover crops in cropping systems in the last decades, due to their many environmental and agronomic benefits (Weil and Kremen, 2007). Additionally, a cover crop can protect the soil during fallow periods, enhancing physical, chemical, and biological soil properties, affecting positively the next cash crop performance (Sainju et al., 2002; Fageria et al., 2005; Dagel et al., 2014).
Species in the Brassicaceae family (henceforth Brassicas) have been used as cover crops due to their fast growth in the fall and high biomass production (Chen et al., 2007; Geiske et al., 2016). Brassicas long, thick, and deep taproots can break the compacted soil layers, reducing subsoil compaction (Williams and Weil, 2004; Chen et al., 2007; Weil and Kremen 2007; Chen and Weil, 2011), increasing water infiltration (Dabney et al., 2001; Williams and Weil, 2004; Chen et al., 2007, Chen et al., 2014), and reducing soil erosion (Weil and Kremen, 2007; Stavi et al., 2012; Gruver et al., 2016). These species also can increase soil fertility remobilizing residual NO3-N, P, and other nutrients from deep in the soil (2 m or more) to upper soil layers, becoming
available for the next crop (Marschner et al., 2007; Chen et al., 2007; Dean and Weil, 2009; Liu et al., 2015; Gieske et al., 2016). Their deep root system allows them to extract water to 2-m
3
depth with high water use efficiency (WUE), even higher than 30 kg DM ha-1 mm-1 (de Ruiter et
al., 2009). Additionally, brassica cover crops have gained high interest to be used as biopesticides to control soilborne pests (Haramoto and Gallandt, 2005a; Chen et al., 2007; Ackroyd and Ngouajio, 2011; Bjorkman et al., 2015).
Determining the best management practices of brassicas used as forage and cover crops is necessary to obtain their benefits in cropping systems. These include species and cultivar
selection, sowing rate, plant density, and nutrient requirements. Sowing rate is important for plant growth because this may influence plant architecture, height, leaf to stem ratio, and forage production (Stefanski et al., 2010). Each forage brassica species has different nutrient
requirements, depending on soil fertility and the expected yield response (Wilson et al., 2006; de Ruiter et al., 2009). Brassicas, as forages or cover crops, production research in North Dakota is limited. Although a few new trials on forages brassicas grazing have been conducted with good results (Neville et al., 2007; 2010).
The general objective of this research was to determine the agronomic potential of several forage brassica species both as forage resource and as cover crops. The specific objectives of this study are:1) to identify brassicas species and cultivars with high biomass production and high forage quality when grown as full-season and as cover crops in North Dakota; 2) to determine their optimum sowing date and optimum plant density to maximize their yield and quality, and 3) to determine their response to different N and S fertilization rates.
4
CHAPTER 2. LITERATURE REVIEW 2.1. Forages brassicas
Forage is defined as “edible parts of plants, other than separated grain, that provide feed for animals, or can be harvested for feeding” (Barnes and Nelson, 2003). Even though grasses (Poaceae) and legumes (Fabaceae) are the most important forage resources, some forbs have been gaining importance. Forage brassicas are the most important forbs used as forages in animal production.
2.1.1. Botanical classification and species
The Brassicaceae (former Cruciferae) family includes many different genera. The genus Brassica is the most economically important within this family, which include different species with multiples uses (Branca and Cartea, 2011). Six centuries ago, some species of brassicas were used for livestock feed (Najda, 1991; Smith and Collins, 2003). Species such as turnip [Brassica rapa L. var. rapa (L.) Thell).], swede or rutabaga (B. napus L. var. napobrassica), forage rape (B.napus L.), kale [B. oleracea L. convar acephala (DC)] (Ayres and Clements 2002; McCartney et al., 2009; Gowers, 2010; Westwood and Mulcock, 2012), and some hybrids like B. rapa L. x B. pekinensis L. (Wiedenhoef and Barton, 1994) or B. rapa L. x B. oleracea L. (Frischke, 2011) have been widely used as a forage crops. Also, canola or rapeseed (B. napus L.) which is an oilseed, has foliage can be used as forage for grazing (MAFRI, 2004; Schroeder, 2008). In the last decades, some of these species, such as turnip, rape, and some hybrids, have become important cover crops.
Forage radish (Raphanus sativus L.) is widely used as cover crops in the USA but also has been reported as an excellent forage in Canada due to their high biomass yield and quick regrowth allowing several grazing events (McCartney et al., 2009). Ethiopian cabbage or
5
Ethiopian mustard (B. carinata L.), has the potential to be used both as cover crop, companion crop or forage (Hunter and Roth, 2010).
2.1.2. History and distribution of forage brassicas
Forage brassicas have been produced and used in different areas of the world, especially in Australia, New Zealand, and North America (Jung et al., 1986; Jacobs et al., 2001; Nichol et al., 2003; Wilson et al., 2006, Neilsen et al., 2008; Keogh et al., 2011). Also, historically these species have been utilized in Europe for more than six centuries, especially to feed sheep (Najda, 1991). In the USA, brassica forage crops were introduced by European immigrants (Jung et al., 1983) and have been studied as forage crops in humid zones of the USA and Canada (Jung et al., 1984). These species were commonly used in the last part of the 19th century and the beginning of the 20th century (Jung et al., 1984; Smith and Collins, 2003). The use of forage brassicas
began to decline since 1950’s due to high cost to produce them (Jung et al., 1984; Smith and Collins, 2003), high labor requirement, and diseases, and insect problems (Rao and Horn, 1986). However, in the last decades, these forage crops had a comeback, as full-season forage crops for grazing and also as cover crops. The recent developments in forage production technology and plant breeding have stimulated renewed interest on brassicas as potential forage crops for
livestock (Rao and Horn, 1986). In New Zealand, forage brassicas are the most important annual forage used for milk and beef production (Salmon and Dumbleton, 2006; de Ruiter et al, 2009). Also, some forage brassicas have wider geographical distribution than others. Forage turnip is widely grown in northern Europe, and is also distributed over much of northern Asia, northern North America, and southern Oceania (Bilgili et al., 2003). Turnip has been an important annual forage for livestock production in Europe, New Zealand, North America, and Australia (Neilsen et al., 2008). Swedes are the third most important vegetable crop in Scotland (Gowers, 2010),
6
and the second most grown forage brassica after turnips in New Zealand (Chakwizira et al., 2011).
2.1.3. Characteristics of brassicas as forage
Brassicas have several desirable characteristics that make them useful as forages. Most researchers working with forage brassicas agree that the most important characteristics are: i) abundant forage at the time when most warm- and cool-season grasses are not productive (winter), ii) higher forage yield and quality (energy, protein, digestibility, and minerals), iii) low establishment and harvest cost when using direct grazing, and iv) added environmental benefits when in crop rotations (Rao and Horn, 1986; Ayres and Clements, 2002; Fulkerson, 2008; Neilsen et al., 2008; de Ruiter et al., 2009; Lemus, 2009; Rowe and Neilsen, 2010, Undersander, 2013).
2.1.3.1. Phenology
The most representative forage brassicas have biennial growth cycle (turnip, rape, kale, swede and hybrids), but in livestock systems they are grown as annuals (Hall and Jung, 2008, Lemus, 2009). They grow vegetatively in the first season (storing yield in roots or stems) and produce seed in the second season (de Ruiter et al., 2009). However, in areas with harsh winters many forage brassicas grow as annuals because they get winter-killed (Stewart, 2002).
Knowing growth staging is useful in crop protection, in plant breeding and other disciplines where a proper definition of crop growth stages is essential (Theunissen and Sins, 1984). Developmental growth staging for brassicas was developed by Harper and Berkenkamp (1975) and Theunissen and Sins (1984). The first three stages are similar for all brassicas species. Stage zero (0) is a pre-emergence or seed stage. Stage 1 (1), seedling stage, starts with the germination of the seed, the elongation of the hypocotyl, and ends with the unfolding of the two
7
cotyledons. Stage 2 (2), rosette stage, starts with both cotyledons fully extended and ends with the first two true leaves fully expanded. At stage 3 (3), harvest or grazing stage, the internodes elongate, the plant increases in height, and growth rate is the fastest. The axillary buds become visible and the growth slows down gradually at the end of stage 3 (Harper and Berkenkamp, 1975; Theunissen and Sins, 1984).
In some species, the above ground biomass is mostly leaves and stems (kale, canola, forage rape, and some hybrids), others have part of the above ground biomass as enlarged hypocotyls (turnip and swede) or roots (radish) (Lemus and White, 2014). Both will be referred as ‘roots’ henceforth.
2.1.3.2. Physiology
Growing degree days (GDD) to maturity has a major effect on forage brassicas biomass yield potential (de Ruiter et al., 2009). A base temperature of 0°C has been used by some authors to calculate the GDD for brassicas (Darby et al., 2013; Björman et al., 2015). Other plants belonging to this family such as white or yellow mustard (Sinapis alba L. and brown or oriental mustard Brassica juncea (L.) Czern.), can accumulate biomass as long as the
temperature is above freezing (Björkman et al., 2015). However, de Ruiter et al. (2009) mentioned that thermal time above 4°C determines the rate of leaf appearance.
Brassicas are cold-hardy (Jost, 1998), and can tolerate freezing temperatures in the winter (Jung et al., 1983; Jung et al., 1986; Smith and Collins, 2003; Keogh et al., 2011). The ability to grow at temperatures near 0ºC gives them an advantage over most grasses and legumes during the winter (Smith and Collins, 2003). Brassicas, in general, can tolerate temperatures down to -5°C (Najda, 1991). Different species of brassicas have different winter hardiness which varies with cultivars and organs of the plant (Villalobos and Brummer, 2013). Turnip leaf can
8
generally survive temperatures between 6 and 10°C. Turnip root can tolerate temperatures of -13°C (Bartholomew and Underwood, 1992; Penrose et al., 1996; McCartney et al., 2009). Turnip can survive temperature of -9.4°C (Lemus and White, 2014), and they require several days below freezing to be killed (Rook, 1998; Jost, 1998). Kale is the most cold tolerant forage brassica surviving -12°C (Jost, 1998; Lemus, 2009; Lemus and White, 2014). However, Penrose et al. (1996) determined that kale cv. Premier survived an entire winter, with a minimum
temperature of -22°C air temperature. Turnip, swede, and hybrid cultivars evaluated in the same location and season survived temperatures of 11°C at the end of November, but they froze at -22°C (Penrose et al., 1996). Jung et al. (1986) observed that swede root cv. Calder remained alive in the 1981-1982 winter, whereas all other root crops were dead by mid-winter. That winter, the minimum air and soil (5-cm depth) temperature were -28°C and -17°C, respectively.
Conversely, forage brassicas also are tolerant to heat. High dry matter production with temperatures of about 32°C have been reported (Smith and Collins, 2003). This temperature was used by Darby et al. (2013) to determine the maximum temperature for GDD calculations. Forage brassicas accumulate about 1.1 Mg dry matter (DM) ha-1 per each 100 GDD, base temperature 0◦C and maximum temperature 32◦C, without soil water constraints nor fertility (de
Ruiter et al., 2009).
Brassicas species used as cover crops are fast-growing, cool-season annuals with some frost tolerance as well (Chen et al., 2007). Forage radish is sensitive to frost and winter-kills with prolonged exposure to temperatures below -4°C (Weil et al., 2009). In the Mid-Atlantic, forage radish leaves are first damaged by frost in late November or early December but shoots can resume growth. The growing point is often protected by surrounding foliage, until it is finally killed by temperatures below -4°C in January or February (Lawley et al., 2012).
9 2.1.4. Forage brassica biomass production
Most forage brassicas reach their maximum biomass yield between 80 to 150 days after planting (DAP) (Tiryakioglu and Turk, 2012). Turnip is a short-season, fast-growing annual crop, which requires 80 to 100 DAP to achieve maximum dry matter production (Jung et al., 1983; Smith and Collins, 2003; Albayrak et al., 2004; Lemus, 2009; Jacobs and Ward, 2011; Lemus and White, 2014). Swede has a longer vegetative period than turnip and grows slower requiring 120 to 180 DAP to achieve maximum biomass production (Jung et al., 1983;
Wiedenhoef and Barton 1994; Lemus, 2009; Lemus and White, 2014, Benedict et al., 2013). Narrow-stem kale is more productive than the other brassicas and require as much as 120 to 180 DAP to accumulate maximum biomass (Wiedenhoef and Barton, 1994; Jung et al., 1986; Jung et al., 1983). However, depending on the type of kale the growth period can be much shorter. Stemless kale cultivars require only 90 DAP for maximum yield, allowing a second harvest (Hall and Jung, 2008; Lemus, 2009; Lemus and White, 2014). Forage rape and hybrids need about 120 DAP to accumulate maximum biomass, although some maximize biomass at 82 DAP. Most cultivars are ready for grazing at 60 DAP, but need 30 additional days of regrowth for a second grazing (Wiedenhoef and Barton, 1994; Jung et al., 1983; Lemus 2009; Lemus and White, 2014; Judson et al., 2013). Kale hybrid cv. ‘Winfred’ can also be used for winter grazing and is ready for grazing about 75 DAP in the fall (Frischke, 2011).
The biomass production of forage brassicas differs depending on the species, cultivar, management, and environmental conditions. Maximum biomass yield is achieved at
physiological maturity (PM), when the basal leaves begin to senesce and the tops change in color (Ayres and Clements, 2002).
10
Forage brassicas biomass yield fluctuates between 4 and 12 Mg dry matter (DM) ha-1 in 5
to 6 months after planting, depending on species (Keogh et al., 2011). Swede and kale, generally have higher forage yield than other forage brassicas, because of their longer vegetative period. Forage yield fluctuates between 15 and 20 Mg DM ha-1 under optimal environmental and
management conditions (Wilson et al., 2006; Brown et al. 2007; Fletcher et al. 2007, Fletcher et al, 2010; Gowers et al., 2006; de Ruiter et al., 2009). Under irrigation and high N fertilization rates, kale was reported to achieve 25 Mg DM ha-1 of high quality forage (Chakwizira et al., 2015b).
Forage yield increased from 4 to 11 Mg DM ha-1 in swede and from 2.5 to14 Mg DM ha-1
in kale, harvesting at 60, 90, 120, and 150 DAP (Jung et al., 1986). Likewise, in Canada, swede forage yield increased from 7.4 to 9.4 Mg DM ha-1 when the harvest was delayed from 16
September to 6 December (Kunelius et al., 1989). In a survey of 49 commercial kale cultivars in New Zealand, the DM yield averaged 10.9 Mg DM ha-1 and varied from 5.3 to 17.0 Mg DM ha-1.
Kale type had a significant effect on total forage yield with the intermediate-stem type averaging 9.9 Mg DM ha-1 and giant types 13.6 Mg DM ha-1. Cultivar, fertility, sowing date and in-crop moisture were all factors that contributed to forage yield variation (Judson et al., 2010). Turnip can easily produce about 5 Mg DM ha-1, however, in fertile soil and with even rainfall distribution and temperatures below 25°C, they can yield 8 Mg DM ha-1 or more. Turnip
biomass yield between 5.9 and 8.1 Mg DM ha-1 were reported in Ohio (Penrose et al., 1996),
while similar yields were reported by Jung et al. (1986) 60 to 90 DAP, respectively. Other researchers have reported biomass yield average between 4 and 8 Mg DM ha-1 (Rao and Horn,
1986; Jung et al., 1983; Kalmbacher et al., 1982). The lowest biomass yield reported is 1.2 Mg DM ha-1 (Griffin et al., 1984). In North Dakota, a trial conducted at Carrington in 2003, with
11
four turnip cultivars had an average forage yield of 6.1 Mg DM ha-1 (NDSU, 2003). Although,
much lower biomass turnip yields were reported by Neville et al. (2007), in Streeter, ND. Forage rape usually has less biomass than kale, but under adequate conditions (management and environment), yield can be 10 Mg DM ha-1 or more. Biomass yield fluctuates with harvest date,
ranging between 4 and 7 Mg DM ha-1 harvested at 60 to150 DAP, but depending on the country and harvest dates biomass yield can vary between 7.6 to 10.2 Mg DM ha-1 (Garcia et al., 2008;
Fletcher and Chakwizira 2012b; Judson et al., 2013). In a trial conducted at Carrington, ND, in 2003, the average forage yield of three cultivars of rape was 3.5 Mg DM ha-1 (NDSU, 2003).
Hybrid forage brassicas had high yield fluctuation depending of the species. Penrose et al. (1996), reported a yield of 6.1 Mg DM ha-1 with the hybrid Tyfon, while Griffin et al. (1984) reported 6.7 Mg DM ha-1 with the same hybrid. Conversely, ‘Winfred’ biomass yield was 13.8
Mg DM ha-1 with above-normal rainfall, but with below-normal rainfall yield was only 3.5 Mg DM ha-1 (Ward and Jacobs, 2013). Winter canola also has been used as a double crop for winter
grazing and seed (Dove et al., 2012). 2.1.5. Forage brassicas management 2.1.5.1. Field selection and soil preparation
Brassicas can be grown in different kind of soils. Soil depth of 1 m or more is ideal for root development and water uptake (de Ruiter et al., 2009). Brassicas perform better on well drained soils, without waterlogging problems (Jung et al., 1983; de Ruiter et al., 2009; Keogh et al., 2011). Additionally, forages brassicas should be integrated in a crop sequence or rotation, to manage soil fertility, and weed and pest control (de Ruiter et al, 2009). The soil preparation must provide a firm seed bed in conventional tillage system (de Ruiter et al., 2009). No till or direct drilling has been used but the results have varied (Ayres and Clements, 2002). If no till is
12
chosen, higher amount of N should be applied to compensate the lower N mineralization (de Ruiter et al., 2009).
2.1.5.2. Sowing date and sowing depth
Emergence and establishment of forage brassicas depends on soil water content and temperature at the time of sowing. Available water content in the soil and warmer temperatures in a fall sowing resulted in early emergence and establishment, whereas spring emergence and seedling growth was delayed due to lower than optimum temperatures (Rao and Horn, 1996; Jung et al., 1983; Keogh et al, 2011). Brassica species germinate over a wide range of temperatures, but the optimum range is from 10 to 35°C (Smith and Collins, 2003). At these temperatures, the emergence may occur between 4 to 5 days. Under favorable conditions forage rape germinates rapidly (2-4 days) in late summer and early autumn (Fulkerson, 2008). Jung et al. (1986), using conservation tillage, determined that seed germination was 26% at 15°C and 80% at 21°C six DAP. With soil temperature less than 12°C, seedling emergence occurred 10 DAP.
The optimum sowing date depends on final crop use, brassica species, management, and environment. For summer grazing, most of the species must be planted early in spring
(March/April), to use soil water and catch enough spring rainfall (Ayres and Clements, 2002). Early sowing dates increase total GDD improving potential forage yield.
Studies have indicated that weed competition is a major problem in brassicas
establishment (Griffin et al., 1984). For that reason, sowing when soil temperature is optimum will allow faster germination and emergence. Studies conducted in the 1970's, determined that delaying the sowing date reduced forage yield of kale (Fulkerson and Tosell, 1972). End of May sowing resulted in higher DM yield of kale and swede than sowing on 16 June or 14 July (Dibb
13
and Brown, 1964). In the Atlantic region of Canada, forage rape, radish, and hybrid turnip forage yield did not differ when established in May, June, or July. However, kale yield declined when sown after June (Kunelius et al., 1987). Additionally, sowing and harvest dates affected length and diameter of turnip roots. The largest roots were obtained sowing in 20 June compared with 5 July and 20 July (Tiryakioglu and Turk, 2012). Also, Sprague et al. (2014) working with winter canola for grazing, determined that early sowing dates generated more biomass yield than those sown later. Forage brassicas quickly decline in forage yield as fall sowing is delayed from 1 August to 31 August, in Ireland. In this study, biomass yield decreased in 74.5% in forage rape, and in 55.5% in turnip (Keogh et al., 2011).
Brassica seeds are very small, thus to obtain maximum germination and good stand establishment, the sowing depth must be shallow (Ayres and Clements, 2002). ‘Barkant’ turnip sown at a depth of 10 mm emerged faster in 7 DAP, than at greater depths. However, 15 DAP emergence rates were similar between 10- and 25-mm depths. Lowest total emergence was observed at 0- (surface) and 50-mm depths (Salmon and Dumbleton, 2006). Recommended sowing depth ranges between 6.3 and 12.7 mm in soils with fine texture and between 12.7 and 19 mm in coarse-textured soils (Smith and Collins, 2003; Lemus and White, 2014; Ayres and
Clements, 2002; de Ruiter et al., 2009). 2.1.5.3. Sowing rate and plant density
Sowing rate is important for plant growth because it may influence plant architecture, height, and leaf to stem ratio (Stefanski et al., 2010). Also, differences in plant architecture may produce overgrazing of the growing point decreasing energy reserves and affecting plant
regrowth. Sowing rates between 2 and 5 kg ha-1 changed the consumption preference by the animals and the utilization of the crop, without changing the forage quality of rape. Forage
14
utilization decreased when the density increased (Stefanski et al., 2010). Cho et al. (1998) determined that the stem diameter decreased from 2.1 to 1.8 cm, and the leaf/stem ratio
decreased from 31.2 to 22.9%, when forage rape sowing rate was increased from 3 to 15 kg ha-1.
Recommended sowing rates vary between 3.4 and 5.0 kg ha-1 for forage rape and kale and
between 0.8 and 4.5 kg ha-1 for turnip and swede depending on the country and cultivar (Smith and Collins, 2003; Lemus, 2009; Lemus and White, 2014; Smart et al. 2004; Ayres and Clements 2002; de Ruiter et al., 2009). However, Cho et al. (1998), determined that the optimum sowing rate for forage rape ‘Sparta’ was 11 kg ha-1 which yielded 22.0 Mg DM ha-1.
In forage rape, plant density was 45% lower with 2 kg ha-1 than 5 kg ha-1 (Stefanski et al.,
2010). With low sowing rates, as the area available for plant growth increases, plant diameter also increases. High plant density limits nutrient uptake and photosynthetic activity, reducing translocation of nutrients to roots and leaves (Albayrak et al., 2004). Additionally, high sowing rates in turnip and swede will likely result in smaller roots which pose the risk of chocking cattle (Smith and Collins, 2003). Also, lower sowing rates may reduce waste during grazing as the apical growing point remains near the soil surface (Stefanski et al., 2010). Thus, cattle can graze to a lower residual level without removing the apical growing point and setting back regrowth. This will likely result in greater forage utilization, because plants are well spaced, minimizing waste by trampling. Conversely, higher sowing rates produce thinner stems and proportionally more leaf material, with higher protein content (Stefanski et al., 2010). Albayrak et al. (2004) determined that turnip root yield and weight increased when row spacing was increased. At 40-cm row spacing root and leaf yield was greater than at 20-, 30-, and 50-40-cm row spacing. The average turnip forage yield was 2.8, 4.5, 5.3, and 4.7 Mg DM ha-1 at 20-, 30-, 40-, and 50-cm
15
row spacing, respectively. Root diameter and length was greater at 50-cm row spacing. Leaf yield was greater at 40-cm row spacing.
2.1.5.4. Fertilization response
Each forage brassica species has different nutrient requirements, depending on soil fertility, intended use, and the expected yield response (Wilson et al., 2006; de Ruiter et al., 2009). The amount of fertilizer to maximize forage yield depends on the difference between crop nutrient demand and nutrient supply from the soil (de Ruiter et al., 2009). Management of soil and fertilization are key to profitable and sustainable crop production (Chakwizira et al., 2011; Fletcher and Chakwizira, 2012a). Nutrient supply needs to be closely matched to crop demand. Sub-optimal nutrient supply will result in lower yield, while excess nutrient application can lead to leaching and run-off of nutrients and potentially create nitrate toxicity to animals (Chakwizira et al., 2011). Grazing of forage kale can cause ground water pollution through nitrate leaching. To minimize N loading, N fertilization must match crop requirements (Chakwizira et al., 2015b).
The most important nutrients for forage brassicas are N, P, S, K, Mo, and B. Soil testing for nutrients such as Mg, Cu, and Co (Aymes and Clemets, 2002; de Ruiter et al., 2009) and Ca, Zn, Fe, and Mn might be necessary in certain locations (Guillard and Allinson, 1989).
According to Smith and Collins (2003), brassica production is highly dependent on available soil N. Nitrogen is required in large amounts in plant tissue, as a component of plant proteins, amino acids, nucleotides, nucleic acids, and chlorophyll (Grant and Bailey, 1993). Nitrogen application influences mainly crude protein (CP) content in forages, but also affects metabolizable energy (ME), neutral detergent fiber (NDF), and starch content of turnip roots
16
(Jacobs and Ward, 2011). Nitrogen is needed in higher quantity in forage brassicas than grasses, because of their higher CP content (Smith and Collins, 2003).
Leafy brassica species require large amounts of N, hence, N fertilizers are the most important production input (Keogh et al., 2011). Nitrogen is applied to increase forage yield, but the response depends on soil N and yield potential (Fletcher et al., 2012a; Chakwizira et al., 2011; Keogh et al., 2011; Fletcher and Chakwizira, 2012b). The N requirement in most brassica crops in New Zealand ranges from 250 to 500 kg N ha-1. They respond strongly to N
fertilization if the soil has less than 150 kg available N ha-1 (available N tested at 15 cm of soil
depth, according with Keeney and Bremmer (1966) procedure) (de Ruiter et al., 2009).
Forage kale Naccumulation was 22 kg N Mg-1 DM with 12 Mg DM ha-1 of biomass (Judson et al., 2010) and only 20 kg N Mg-1 DM when total biomass production was 18 Mg DM ha-1
(Wilson et al., 2006). The total N accumulation differed with N application (Fletcher and Chakwizira, 2012b). In a rain-fed condition and no N application, kale took up 13.5 kg N Mg-1
DM, but when fertilized with 300 kg N ha-1 the N accumulation increased to 32.7 kg N Mg-1
DM (Chakwizira et al., 2015b). Jacobs et al. (2006) reported that application of N fertilizer from 150 to 300 kg N ha-1 increased forage rape yield from 9.8 to 13.6 Mg DM ha-1. Chakwizira et al.
(2011), determined a yield increase from 7.0 Mg DM ha-1 with 0 kg N ha-1 to 9.7 and 10.5 Mg DM ha-1 with 120 to 300 kg N ha-1, respectively. These recommended N rates are similar to the
140 kg N ha-1 recommended for forage swede in Otago, New Zealand (Stevens and Carruthers,
2008).
Application of N fertilizer can lead to an accumulation of nitrate (NO3-N) in forage
brassicas, particularly when N application rates exceed the requirement (Fletcher and
17
content in grazeable plant tissues, leading to animal health issues and/or environmental pollution (Chakwizira et al., 2015b). Forage kale and rape, generally have higher NO3-N concentration
than turnip and swede. This is because roots, the major yield component of turnip and swede, have lower NO3-N content than stems, which make up the bulk of yield in kale and rape
(Fletcher and Chakwizira, 2012b). Additionally, Chakwizira et al. (2015a) reported that NO3-N
contents were higher in kale stems and petioles (which included the midrib of the leaf) than in leaves. Nitrate concentration was highest at the bottom of the kale stem and decreased towards the top. Also, NO3-N content on the whole-plant (kale and rape) increased with N supply, and
long periods of low rainfall in the summer (Chakwizira et al., 2015a). Rape and kale had nearly double of NO3-N content compared with turnip and swedes (5.5 mg g-1 DM and 2.9 mg g-1 DM,
respectively). Chakwizira et al. (2015a) determined that the NO3-N content increased from 0.1
mg g-1 to 2.3 mg g-1 from 0 to 500 kg N ha-1 in kale and 1.0 to 3.4 mg g-1 from 0 to 200 kg N ha-1 in forage rape. Fletcher and Chakwizira (2012b) recommended early application of N fertilizer to minimize NO3-N accumulation in forage brassicas.
Aymes and Clements (2002) recommended to apply only 20 kg N ha-1 at sowing, broadcasting the remaining rate 2 or 4 weeks after crop emergence. Nitrogen split-applications can have some advantages (Widdowson et al., 1960), such as early biomass production for grazing (Sprague et al., 2014). However, Pelletier et al. (1976) determined that forage brassicas had higher CP with full application of N at sowing than with split-application. In New Zealand, the recommendation is to split N fertilizer into two applications, 6 and 12 weeks after sowing (WAS) in forage kale and 4 and 8 WAS in forage rape. This limits NO3-N accumulation in the
soil and the risk of leaching losses during the season. Late N applications almost doubled NO3
18
Where there is adequate soil water content, N application can improve forage yield and CP content in most summer forages (Jacobs and Ward, 2011). However, studies on N fertilization in turnip and other forage brassica species have indicated that under dryland conditions, forage yield response is variable (Jacobs and Ward, 2011).
Sulfur is the fourth major nutrient in crop production, ranked immediately behind N, P, and K in importance to crop productivity (Jamal et al., 2010; Piri et al., 2012). Although S is one of the essential nutrients for plant growth, this element has received little attention for many years because fertilizers and atmospheric SO2 and H2S inputs supplied the soil with adequate
amounts of S for many years (Jamal et al., 2010; Aghajanzadeh et al., 2015). Industrial burning of high-S content coal released high amount of S-compounds to the atmosphere, however new regulations to reduce greenhouse gases emissions (GHG) and acidifying compounds reduced the S input to soils from the atmosphere (Aghajanzadeh et al., 2015).
Some crops require as much S as P, especially brassicas species (Grant and Bailey, 1993; Manaf and Ul-Hassan, 2006; Chen et al., 2007; Piri et al., 2012). However, S fertilization has erratic results. Forage brassicas respond strongly to N fertilizer but seldom to S (Wilson et al., 2006; Fletcher et al., 2010). Nitrogen and S requirements of crops are closely related because both nutrients are required for S-containing aminoacids (cysteine and methionine), protein synthesis, and various other cellular components, including thiol and secondary S-containing compounds, which have a significant role on protection of plants against stress and pests (Grant and Bailey, 1993; Piri et al., 2012; Anjum et al., 2011). Sulfur is contained in the biologically active compounds biotin, glutathione, thiamine, and coenzyme A, playing an important role in energy transfer and protein structure. This nutrient is involved in the synthesis of chlorophyll
19
and is also required in plants of the Brassicaceae family for the synthesis of volatile oils, accumulating as glucosinolates (Grant and Bailey, 1993).
In general, N/S ratios from 4:1 to 8:1 are ideal for brassicas. A 7:1 N/S ratio in the soil is required for optimum growth of rape (Janzen and Bettany, 1984; Chen et al., 2007). However, Janzen and Bettany (1984)indicated that ratios below 7:1 reduced seed yield. Fazili et al. (2008) reported that S deficiency limits the N use efficiency,therefore, S addition becomes necessary to achieve maximumN use efficiency from applied fertilizer. An example of S and N interaction was reported by Fazili et al. (2008), in this study rapeseedand brown mustard (B. juncea L.) had S accumulation of 27 to 31% oftheadded S with no N fertilization and 37 to 38% when 60 kg N ha-1 was applied. Wilson et al. (2006) reported that kale’s S extraction was 100 kg S ha-1 while application of 45 kg S ha-1 recorded significantly higher forage yield than 30 kg S ha-1 in
forage rape (Piri et al., 2012).
The desirable method and timing of S fertilization depends on whether the fertilizer contains SO4-S which is available to the plant or elemental S which must be oxidized before it
becomes available to the plant. Sulfate-containing fertilizers are water soluble and leach easily (Grant and Bailey, 1993). Fertilizers containing SO4-S should be preferred to those with
elemental S which is released slower and causes soil acidification (Ayres and Clements, 2002). In soils with sufficient soil water for crop planting, spring broadcast or broadcast-incorporated application of SO4-S is recommended. In soils with lower than average soil water content, side
banding or presowing banding may be superior, because bands will be less subject to drying than the soil surface. In coarse-textured soils, leaching losses of SO42- may occur during heavy rains
20
Phosphorus is an essential element that plays a key role in plant growth and metabolism and it is the major limiting nutrient for plant growth after N (Afshar et al., 2012). Phosphorus availability is associated with root development and hence crop establishment. The plant responds to P fertilization by either diverting resources to root production or increasing root proliferation in the high P regions with subsequent yield increase. A larger root volume will result in improved nutrient and water uptake (Chakwizira et al., 2011).
Forage brassica biomass yield responds strongly to P fertilization particularly where soil P is less than 15 mg kg-1 soil (White et al., 1999). For example, a 12 Mg DM ha-1 of kale
biomass contained 34 kg P ha-1 (Judson et al., 2010) and 18 Mg ha-1 of kale contained 50 kg P
ha-1 (Wilson et al., 2006). General recommendations for maximum forage yield of brassicas fluctuate between 25 to 50 kg P2O5 ha-1 rates (Wilson et al., 2006; Chakwizira et al., 2010;
Chakwizira et al., 2011). Lemus (2009) recommended that kale should be fertilized with 100 to 112 kg P2O5 ha-1, forage rape with 50 to 78 P2O5 ha-1, and swede/turnip with 95 to123 P2O5 ha-1.
Banded P fertilizer (as opposed to broadcast) and applied at planting time may increase
availability of P early in the season allowing the plants to establish a more effective root system early in the season and thereby increasing water use efficiency (Ayres and Clements, 2002; Lemus, 2009; Chakwizira et al., 2011).
Potassium is an activator of a number of enzymes, most notably those involved in
photosynthesis and respiration. Potassium serves an important function in regulating the osmotic potential of cells and it is a principal factor in opening and closure of stomatal guard cells, and phototropisms (Hopkins and Huner, 2008).
Although not common, K deficiency can be corrected by adding a potash fertilizer (Ayres and Clements, 2002). Potassium requirement is high in all brassica forages (Smith and Collins,
21
2003). Fulkerson et al. (2008) reported that 8 Mg DM ha-1 of brassica biomass can uptake 144
kg K ha-1, and the recommended fertilization should be 150 kg K2O ha-1. Lemus (2009)
recommended kale should be fertilized with 100 to 112 kg K2O ha-1, forage rape with 50 to 78
K2O ha-1, and swede/turnip with 95 to 123 K2O ha-1.
The requirements of micronutrients in forage brassicas are not substantially different from those of other forage species (Smith and Collins, 2003). Molybdenum deficiency is common in acidic soils (pH < 5.5). It can be applied as Mo superphosphate or could be applied with seed treatment (Fulkerson et al. 2008). Additionally, liming to increase soil pH may also overcome Mo deficiency (Ayres and Clements, 2002; Fulkerson et al., 2008). Boron deficiency is relatively rare, but has been detected in recently limed soils or high pH alkaline soils. The deficiency can be overcome applying boron fertilizer in rates of 2 kg ha-1 (Ayres and Clements,
2002).
2.1.5.5. Other managements
Water availability is the main environmental source of forage yield variation in brassica forages (de Ruiter et al., 2009). Irrigation increases turnip biomass yield substantially, and water deficits during the growing season reduce forage yield (Rowe and Neilsen, 2010). Swede needs 38 mm H2O wk-1 during the season to maximize root yield (Benedict et al., 2013). Kale and rape
have more vigorous root systems than swede and turnip, and therefore they can utilize stored water more efficiently (de Ruiter et al., 2009). Eckard et al. (2001) reported that irrigation increased yields in turnip from 7.9 to 13.5 Mg DM ha-1 while similarly, Neilsen et al. (2000) reported increases from 6.1 to 12.6 Mg DM ha-1. Other researchers also have reported that