How dangerous is driving with a mobile
phone? Benchmarking the impairment
to alcohol
P C Burns, A Parkes, S Burton, R K Smith (TRL Limited)
and D Burch (Direct Line Group)
First Published 2002 ISSN 0968-4107
Copyright TRL Limited 2002.
The information contained herein is the property of TRL Limited and does not necessarily reflect the views or policies of the customer for whom this report was prepared. Whilst every effort has been made to ensure that the matter presented in this report is relevant, accurate and up-to-date at the time of publication, TRL Limited cannot accept any liability for any error or omission.
TRL is committed to optimising energy efficiency, reducing waste and promoting recycling and re-use. In support of these environmental goals, this report has been printed on recycled paper, comprising 100% post-consumer waste, manufactured using a TCF (totally chlorine free) process.
CONTENTS
Page Executive Summary 1 1 Introduction 3 2 Method 3 2.1 Subjects 3 2.2 Driving simulator 32.3 Route and traffic scenarios 3
2.4 Procedure 4 2.5 Phone conversations 5 2.6 Performance measures 5 2.7 Equipment 5 2.8 Questionnaires 6 2.9 Analysis 6
2.9.1 Analysis of driving performance 6
2.9.2 Analysis of conversations 6
3 Results 6
3.1 Driving performance 6
3.1.1 Mean speed 6
3.1.2 Standard deviation of speed 7
3.1.3 Error from 60 mph on curves 7
3.1.4 Headway during car following 7
3.1.5 Lane keeping performance 7
3.1.6 Reactions to road signs 7
3.2 Subjective workload 8
3.3 Conversation performance 8
3.4 Phone use questionnaire 10
4 Discussion 13
4.1 Summary of results 13
4.1.1 Driving performance 13
4.1.2 Subjective ratings 14
4.1.3 Conversation performance 14
4.1.4 Phone use questionnaire 14
4.2 Interpretations and implications 14
4.3 Strengths and weaknesses 15
4.4 Future research 15
iv Page 5 Conclusions 16 6 Acknowledgements 16 7 References 16 Appendix A: Instructions 18
Appendix B: Conversation tasks 19
Appendix C: Sample subject case report form 22
Abstract 56
Executive Summary
Research has demonstrated that phone conversations while driving impair performance. It is difficult to quantify the extent of this impairment because the comparison is usually made to normal driving without using a phone. Worse than ‘normal driving’ does not equate to dangerous. There is a need to benchmark performance while using a mobile phone to a clearly dangerous level of driving performance. Driving with a blood alcohol level over the UK legal limit (80mg / 100ml) is an established danger.
This study aimed to quantify the impairment from Hands-free and Hand-held phone conversations in relation to the decline in driving performance caused by alcohol impairment. The TRL Driving Simulator was used to provide a realistic driving task in a safe and controlled environment. Twenty healthy experienced drivers were tested in a balanced order on two separate occasions. The drivers were aged 21 to 45 years (mean = 32, SD = 7.8) and were split evenly by gender. Before starting the test drive, participants consumed a drink, which either contained alcohol or a similar looking and tasting placebo drink. The quantity of alcohol was determined from the participant’s age and body mass using the adjusted Widmark Formula (the UK legal alcohol limit 80mg / 100ml).
There were four conditions on the test route: 1) motorway with moderate traffic, 2) car following, 3) curving road 4) and dual carriageway with traffic lights. During each condition the drivers answered a standard set of questions and conversed with the experimenter over a mobile phone. The independent variables in this repeated measures study were normal driving, alcohol impaired driving, and driving while talking on Hands-free or Hand-held phone.
Results showed a tendency for drivers to slow down when talking on Hand-held or Hands-free phones, even when they were specifically instructed to maintain a set speed. Alcohol tended to have the opposite effect such that drivers drove faster than normal when under the influence of alcohol. The standard deviation of speed and speed error measures indicated that drivers’ had significantly poorer speed control when using the Hand-held phone than during the other three conditions. When drivers were under the influence of alcohol, they were significantly worse at driving smoothly (standard deviation of lane position) than during the other three conditions.
Reaction times were significantly slower for drivers using phones in comparison to when they had alcohol. Drivers were significantly slower when they had alcohol then when they had no distractions (i.e., control condition). Also, the drivers missed significantly more warnings when they were using a phone. There was also significantly fewer warnings missed by the drivers when they were on alcohol in
comparison to when they were using the Hands-free phones. The phone drivers were also responding to the wrong warnings more often than the alcohol drivers (false alarms).
From the subjective mental effort ratings participants made immediately after driving each route, it was clear that they found driving while using a Hand-held phone to be the most difficult. The easiest task was the normal driving
without any phone conversations. Hands-free was easier than Hand-held. Drivers found it easier to drive drunk than to drive while using a phone, even when it was Hands-free. Conversation performance comparisons between Hand-held and Hands-free phones were mixed. Hands-free phones were worse than Hand-held phones for the repeating sentence tasks (time and number of pauses). Hand-held phones were worse than Hands-free phones for the verbal puzzles (errors) and monologues (number of pauses).
Driving while intoxicated is clearly dangerous and this study further confirmed that alcohol impairs driving performance. However, this study also found that certain aspects of driving performance are impaired more by using a phone than by having a blood alcohol level at the legal limit (80mg/ 100ml). It is concluded that driving behaviour while talking on a phone is not only worse than normal driving, it can also be described as dangerous. Although using phones while driving is illegal in many countries and can be considered as irresponsible and dangerous, this behaviour is common. Drivers need to be strongly
discouraged from engaging in any phone use while behind the wheel.
1 Introduction
The use of mobile telephones in motor vehicles has been associated with a significant increase in the risk of crashing (Redelmeier and Tibshirani, 1997). This has been supported by a body of experimental research that has clearly shown mobile phone use impairs driving performance (see McKnight and McKnight, 1991; Goodman et al., 1997; and the Stewart Report, 2000 for comprehensive reviews of the research literature). The danger of phone use while driving is that it distracts the driver by taking their attention away from the task of driving. The driver’s primary task is to monitor and control the vehicle’s lateral and longitudinal position along a safe path. Distracted drivers become dangerous when they are unable to properly monitor and control the vehicle’s safe path while using the phone. The typical objective consequence of phone use while driving is poorer lane keeping, more variable speed and a slower reaction time to hazards (e.g., Brookhuis et al., 1991; Fairclough et al., 1991).
Although experimental research has convincingly shown that phone conversations impair driving performance, it is difficult to quantify the risk of this impairment because the reference is usually to normal driving without using a phone. ‘Worse than normal driving’ does not necessarily mean dangerous. There is a need to benchmark driving performance while using a mobile phone to a clearly dangerous level of performance. Society considers driving with a blood alcohol level over the legal limit to be too dangerous. It makes intuitive sense that alcohol impairs driving performance and this was established scientifically nearly 40 years ago (Borkenstein
et al. Grand Rapids Study, 1964).
Stevens and Paulo (1999), in a TRL report reviewing the research on phone use in cars, recommended that
consideration be given to relating Hands-free phone use to alcohol consumption. Although it is an established approach to use drunk driving as a reference to quantify the risks of driving while drowsy (Fairclough and Graham, 1999), no direct comparison has been made to investigate the
impairment in driving from phone use. There have been some indirect comparisons to the risks of phone use while driving to drunk driving. Lamble et al. (1999) found that engaging in a demanding phone conversation while driving slowed brake reaction times significantly. They found reaction times to be approximately three times that of drivers with a blood alcohol level of 0.05% (less than the UK limit of 0.08%). Redelmeier and Tibshirani (1997) also mention how the relative risk of motor vehicle collision associated to mobile phone use compared to the hazards associated with driving with a blood alcohol level over the legal limit.
The aim of the proposed study is to quantify the distraction from Hands-free and Hand-held phone conversations in relation to the decline in driving performance caused by alcohol impairment. It is hypothesised that driving performance decreases more with Hand-held phones than Hands-free phones. It is also hypothesised that some measures of driving performance while talking on a Hand-held phone will be significantly worse than driving performance while impaired by alcohol.
2 Method
2.1 Subjects
Twenty experienced drivers, aged between 21 and 45 years (mean = 32, SD = 7.8), participated in this study. The sample was split evenly by gender. All were healthy and regular mobile phone users. Participants were randomly selected from the TRL volunteer database, a pool of 1300 drivers representing a cross-section of the driving population. Drivers were paid 70 pounds for their participation in this experiment.
The participants were informed in writing about the study’s treatment conditions as well as their right to withdraw at any time. They were reminded that
participation was voluntary and based on their informed consent. Upon completing the whole experiment, the participants were debriefed as to the aims of the study, and any questions they had about the study were answered. Ethical approval was obtained from an Ethics Review Committee prior to the start of this study.
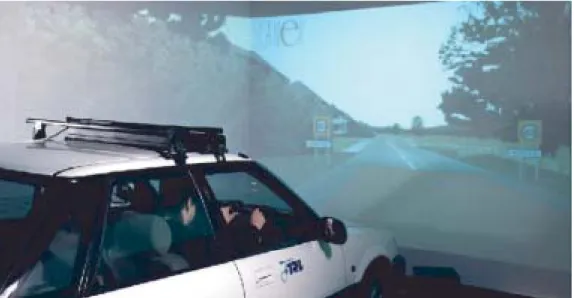
2.2 Driving simulator
The TRL Driving Simulator consists of a medium sized saloon car surrounded by large projection screens giving 210-degree horizontal and 40-degree vertical front vision, and 60-degree horizontal and up to 40-degree vertical rear vision, enabling the normal use of all vehicle mirrors (see Figure 1). The road images are generated by advanced graphic workstations and projected at life size onto the screens. The car body shell incorporates hydraulic rams that supply motion to simulate the heave, pitch and roll
experienced in normal braking, accelerating and cornering. Also, when negotiating curves, the simulator provides realistic forces experienced by the driver through the steering wheel. The realism of the driving experience is further enhanced by the provision of car engine noise, external road noise, and traffic sounds.
2.3 Route and traffic scenarios
Participants drove a 15 km route that was composed of four different segments. The route started with a car following task on a motorway. Drivers were instructed to maintain their present distance from the lead vehicle (54 m), that is the distance between vehicles at the start of the scenario when they were stationary. The car following task lasted for 3.5 km. The lead vehicle oscillated its speed between 50 and 70 mph. The list of instructions is in Appendix A.
After completing the car-following task, drivers were instructed to drive as they would normally on a motorway. The motorway had 3 lanes and a speed limit of 70 mph (113 km/h), the standard speed for motorways in the UK. There was a moderate amount of traffic on the motorway. The traffic was programmed to vary their speeds in relation to the subject’s vehicle and could overtake or be overtaken depending on how the subject drove. The motorway continued for 4.7 km.
A section of curved road was used to measure the driver’s ability to control the vehicle on a more demanding type of rural road. The curves forming two loops and full length of
3.6 km including the straight segments connecting the loops. The loops were modelled after the TRL research track and each had a changing radius. Drivers were instructed to maintain a speed of 60 mph (96.6 km/h).
This was followed by a 3.3 km section of dual carriageway (2 lane road), which ended in a traffic light. During this section drivers had to respond to 12 warning signs at various points along the dual carriageway. They were instructed to flash their headlights whenever a target sign appeared. There were 4 different warning signs in this choice reaction time task: Elderly pedestrians, Pedestrian crossing, Cyclists and Roadworks. The warning signs were spaced approximately 225 metres apart on average.
2.4 Procedure
The participants were invited to the laboratory for a pre-trial session. During this session they were asked to provide background information on their driving history and health. They were given a brief description of the experiment, their height and weight was measured and they were asked to sign a consent form. This description did not mention the specific aims of the experiment, only the treatment
conditions. Participants were introduced to the simulator and given a test drive to allow them to become more familiar and comfortable with the environment.
The next trial was scheduled within a week of their familiarisation drive, and the second and final trial was run one week later. Both test trials started off with a
familiarisation drive in the simulator where they had a chance to practice the driving tasks.
During the test trials, participants were asked to drive as they normally would and to converse with the
experimenter whenever prompted to do so. The routes were driven three times for each visit to the simulator. During the phone visit, drivers were asked to drive the route as they would normally (Control), drive while talking on a Hand-held phone (Hand held), and drive while talking on a Hands-free phone (Hands free). The order of these conditions was randomised. Before driving, participants
also had a similar conversation with the experimenter while seated at a table. This was used as a control condition to evaluate conversation performance while driving. On the alcohol visit, they drove the route three times without using the phone.
All participants were breath-tested when they arrived for both sessions and before undertaking the each of the test drives. Before starting with the test drive, participants consumed a drink, which either contained a measured amount of alcohol with a disguising mixer or a similar looking and tasting placebo drink. They were given 10 minutes to consume their drink, during which time they were supervised by a researcher. The drink consisted of cream soda either with or without the alcohol (Vodka at 40% alcohol).
The quantity of alcohol within the treatments was determined from the participant’s age and body mass using the adjusted Widmark Formula, to achieve the dosing level (Watson et al, 1980). The participant’s height and weight was measured to ensure that the participants body mass index (BMI) is within the normal range, and in order to calculate the amount of alcohol required for their dose levels. The drivers were moderately impaired at the UK legal alcohol limit (80mg / 100ml). The average dosage of alcohol for the male drivers was 118 ml, approximately 5 units of alcohol. The average dosage of alcohol was 82 ml for the female drivers, approximately 3 units of alcohol. Participants were
breathalysed before each of the three drives to confirm their breath alcohol levels were at or over the limit.
Although the quantity of alcohol dosage varied, the volume of the carbonated mix was adjusted to maintain a constant strength of 20% alcohol by volume. Following the 10 minutes of drinking, the participants waited a further 20 minutes before starting their three test drives. On average, it took approximately 45 minutes to complete the driving. This meant they were driving from between 20 to 65 minutes after dosing. The effects of alcohol may appear within 10 minutes after consumption and peak at approximately 40 to 60 minutes.
Video and audio recordings were taken of the conversations and tasks. The computer running the simulation automatically captured and logged all of the driving behaviour. Subjective workload measures were also taken using the rating scale for mental effort at the end of each of the conditions. Upon completing the whole experiment, the participants completed a questionnaire about their phone usage and attitudes towards phone use while driving (see case report form in Appendix C).
2.5 Phone conversations
It was difficult to design a conversation task that has a consistent level of difficulty within and between drivers. The conversation materials that have been used in car phone research often involve intelligence test type materials (e.g., mathematical computations; Brown, Tickner and
Simmonds, 1969) that may represent both extreme and different cognitive loads in relation to normal cellular telephone communications (Goodman et al., 1997). The relevance of this research to normal cellular telephone communications is unclear. Goodman and his colleagues also point out that these studies have used conversations that were free of emotional content (e.g., an argument with a spouse). Discourse that involves substantial degrees of personal involvement may be even more disruptive to driving than the cognitively challenging materials typically included in mobile phone research.
Goodman et al., (1997) identified the need for research to better understand naturalistic driver behaviour while using a cellular telephone. Information on the circumstances of call initiation, call frequency, call length, and call content would help to formulate more realistic test protocols for cellular telephone research. Given that this information is not available, it is difficult to replicate the ‘typical’ passenger or carphone conversations. Several options are available. One option would be to have drivers speak to a person they would normally call (e.g., a friend), however this more natural approach would introduce excessive variability. The same problem of variability could be said about using a negotiation task over the phone (e.g., Parkes, 1991).
Another option would be to have loosely defined
conversations of varying levels of complexity. For example: demanding spatial memory question: ‘how do you get to Heathrow from here’, or ‘describe the waiting room in
detail’? Moderate: ‘what has been in the news lately’? Light: ‘described your last vacation’, or ‘describe your house’? Although these conversations might be more naturalistic, some work would need to be done to quantify the distraction and make them consistent within and between the drivers.
It was decided to use a script to facilitate the
conversation between the subject and driver. This included questions from the Rosenbaum Verbal Cognitive Test Battery (RVCB: Waugh et al., 2000). The RVCB measures judgement, flexible thinking and response times. This has a 30 item remembering sentences task (e.g., repeat the sentence: ‘Undetected by the sleeping dog, the thief broke into Jane’s apartment) and 30 verbal puzzle tasks (e.g., Answer the question: ‘Felix is darker than Antoine. Who is the lighter of the two’). The test battery has five levels of difficulty with six items within each level of both tests. These questions were split across the conditions and included with lighter and more casual discussions (e.g., a 40 second monologue about a recent holiday). See Appendix B for a list of the conversation questions.
This approach was considered best for the present study because the script was more like a conversation than the mathematical computations used in previous work. Also, with its many questions rated at the same level of difficulty, comparisons could be readily made across the different mediums (Hands-free/ Hand-held) and between drivers. As an additional check, participants were asked to rate the subjective mental effort required to perform the various conditions in this study. This would provide a relative index of their experience of difficulty.
2.6 Performance measures
A selection of dependent measures was used to capture the impact the different tasks have on performance (Table 1).
2.7 Equipment
The TRL driving simulator was used in the proposed study (see previous). An after market Hands-free phone kit was professionally fitted in the driving simulator. The same phone was used for both Hands-free and Hand-held conversations. A Nokia 3310 was used for this study based on evidence that the Nokia 3310/30 range was the most popular/widely chosen handset on the UK market at the
Table 1 The performance measures
Variable - source
Driving behaviour – simulator data
Metric
l Lane departures, standard deviation of lane position and root mean square error (RMSE) from lane centre.
l Mean speed, standard deviation of speed, RMSE speed.
l Standard deviation of following time headway, RMSE of time headway, minimum time headway.
l Reaction time to warning signs, missed warning signs and false alarms to warning signs.
l Self-reported mental effort.
l Errors, duration, pauses and failures. Subjective workload – rating scale for mental effort
time of this study (February, 2002). The 3310 and 3330 are essentially the same phone. They look the same and have the same software. The only difference is that the 3330 has an extra menu option for Wireless Application Protocol (WAP) based services on the internet.
2.8 Questionnaires
The mobile phone questionnaire consisted of 28 questions designed to investigate all aspects of participant’s mobile phone use (see Appendix C). The questionnaire is divided into four main sections. The first section is general questions looking at type of phone owned, typical type of phone conversations and frequency of phone use. The second section looked at phone user attitudes towards penalties for being caught whilst driving and using a mobile phone. The third section examined their own experiences of driving whilst using a mobile. The forth presented the participants with a list of tasks that people do typically while driving and they were asked to rate how distracting they thought each of these tasks would be on a Likert scale.
Task mental load was measured using a subjective rating scale: the Rating Scale Mental Effort (Zijlstra, 1993). Ratings of invested effort are indicated by a cross on a continuous 150 mm line (see Appendix C). Along the line, at several anchor points, statements related to invested effort are given, e.g., ‘almost no effort’ or ‘extreme effort’. It is scored by measuring the distance from the origin to the mark in mm. With the Mental Effort Scale the amount of invested effort into the task has to be indicated, and not the more abstract aspects of mental workload (e.g., mental demand, as is in the NASA- TLX). These properties make the Mental Effort Scale ideal for self-report workload measurement (de Waard, 1996).
2.9 Analysis
2.9.1 Analysis of driving performance
The data from the simulator experiment was analysed to clarify the principal hazards of phone use while driving (e.g., poor vehicle control, slow reaction time). All of the data had a common time stamp allowing precise measures of performance across each of the tasks. Descriptive analyses were performed on all of the data from the experiment (i.e., central tendencies and distributions). The data was screened for anomalies (e.g., implausible values) and violations of parametric assumptions. This was followed by the inferential analyses. The principal analysis was a one-way repeated measures Analysis of Variance (ANOVA) to identify differences among the means of the four conditions (Control, Hand-held, Hands-free and Alcohol). Specific post-hoc comparisons were made where appropriate. All p-values were 2-tailed. The median scores of the three alcohol conditions were always used for the analyses. Graphical representations of the analyses, effect sizes and statistical significance levels were used to interpret the results.
2.9.2 Analysis of conversations
Participants had three different tasks as part of their conversation, verbal puzzles, remembering sentences and
monologues. They were asked to answer as accurately as possible and they were not to just guess the answers. Verbal puzzles were recorded as either correct or incorrect, the time that it took for them to respond was also recorded as a measure of the workload.
Sentences were scored on a scale of 0-3; zero if the participant could not remember the sentence that they had to repeat at all. They were awarded one point if they remembered a part of the sentence, two points if they remembered most of the sentence and were almost correct, and three points if they got the sentence 100% correct. The length of time it took for the participants to repeat back the sentence was also recorded along with the number of pauses that the participants made.
For the monologues, participants were given a topic which they had to talk about until they were asked to stop. Topics ranged from giving directions to describing a friend or relative. The number of words were recorded and divided by the length of the monologue to give the rate of words per second. Number of pauses and ums/ers were counted per monologue again as a measure of workload.
A tally of conversation failures was also recorded during this analysis. These were incidents where the driver completely failed to respond.
3 Results
3.1 Driving performance
3.1.1 Mean speed
A one-way repeated measures ANOVA was calculated for mean speed on the motorway across the four conditions (Control, Hand-held, Hands-free and Alcohol). There was a significant main effect by condition for mean speed on the motorway [F(3, 54) = 3.18, p < 0.05, η2 = 0.15]. On the
motorway, drivers with Hand-held phones drove significantly slower than during the Alcohol drive (p = 0.003). The other comparisons were not significantly different.
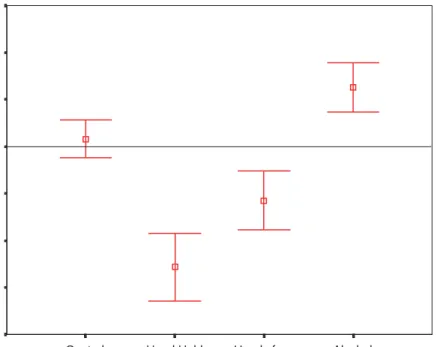
On the curves, where drivers were instructed to maintain a speed of 60mph, drivers drove closest to the specified limit in the control condition (see Figure 2). They
exceeded the limit in the Alcohol drive. They went slower than the limit in the Hands-free drive and they drove the slowest in the Hand-held drive. There was a significant difference in speed across the conditions {F(3, 54) = 10.41,
p < 0.001, η2 = 0.37}. When using Hand-held phones, they
drove significantly slower than during the Control (p < 0.001), Alcohol (p = 0.002) and Hands-free drive (p = 0.03).
The same pattern of mean speed behaviour was
observed for the dual-carriageway section as was observed on the previous sections. There was a significant main effect by condition for mean speed on the motorway {F(2.1, 38) = 9.69, p < 0.001, η2 = 0.35}. There were problems
of sphericity with the data so a Huynh-Feldt correction was used. When using Hand-held phones, they drove significantly slower than during the Control (p < 0.001), Alcohol (p < 0.001) and Hands-free drive (p < 0.001).
3.1.2 Standard deviation of speed
There was no significant difference in the standard deviation of speed on the motorway drive. On the curves, there was a significant difference in standard deviation of speed across the conditions {F(3, 51) = 4.66, p < 0.01, η2 = 0.22}. When
using Hand-held phones, speed was significantly more variable than during the Control (p = 0.012), Alcohol (p = 0.001) and Hands-free drive (p = 0.014).
3.1.3 Error from 60 mph on curves
The root mean square error (RMSE) from 60 mph was calculated for the curved section of the route where drivers were instructed to maintain a speed as close to 60 mph as possible. The speed performance data was significantly skewed so a nonparametric Friedman’s test was used to compare conditions. Speed keeping performance (Error from 60 mph on curves) was significantly different across the four conditions {Chi-Square = 17.8, p < 0.001}. Post-hoc comparisons were made using the Wilcoxon test. Speed keeping performance was significantly poorer in the Hand-held condition in comparison to Normal driving {Z(19) = 2.80, p < 0.005}, Alcohol {Z(19) = 2.48, p < 0.01} and Hands-free {Z(19) = 2.38, p < 0.05}. There were no significant differences among the other conditions.
3.1.4 Headway during car following
The amount of time the drivers were following the lead vehicle at a time-headway of less than 1 second was calculated. This measure was significantly skewed. A Friedman’s test indicated no significant main effect for this measure. The RMSE for time and distance headway from the target following distance were also calculated. No significant differences were observed. Nothing was found for the standard deviation of time headway either.
3.1.5 Lane keeping performance
There were no differences among the chosen measures of lane keeping (standard deviation of lane keeping, lane departures, RMSE lane centre) for most of the route. The exception was there was a significant difference in the standard deviation of lane keeping on the
dual-carriageway across the four conditions {F(1.6, 29) = 5.99,
p < 0.01, η2 = 0.25}. There were problems of sphericity
with the data so a Huynh-Feldt correction was used. When under the influence of alcohol, lane keeping was significantly less steady than during the Control (p = 0.05), Hand-held (p = 0.025) and Hands-free drive (p = 0.025).
3.1.6 Reactions to road signs
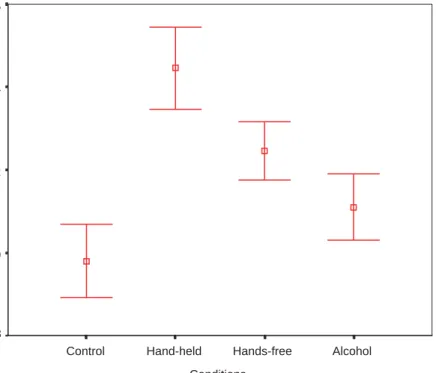
There were 12 signs that appeared and 3 of these were target signs. Reaction times were calculated as the average response time of the hits. The road sign reaction time data was significantly skewed and kurtotic so a Friedman’s test was used to compare conditions. Reaction time performance was significantly different across the four conditions {Chi-Square = 26.6, p < 0.001}. Post-hoc comparisons were made using the Wilcoxon test. Reaction times were significantly slower for the Hand-held condition in
comparison to normal driving {Z(19) = 3.59, p < 0.001} and Alcohol {Z(19) = 3.29, p < 0.001}. Hands-free were also significantly slower in comparison to normal driving {Z(19) = 3.41, p < 0.001} and alcohol {Z(19) = 2.64,
p < 0.01}. The drivers were significantly slower when they
had alcohol than in the control condition {Z(19) = 2.56,
p < 0.01}. Hand-held was slower than Hands-free but the
difference was not significant, (see Figure 3).
The misses and false alarms for the road signs were also analysed. Ideally the drivers should have had no misses or false alarms and three hits. This response data
Condition
Alcohol Hands free
Hand Held Control
Mean Speed (mph +/- 1 Standard Error)
63 62 61 60 59 58 57 56
was significantly skewed and kurtotic so a Friedman’s test was used to compare conditions. The number of missed signs was significantly different across the four conditions {Chi-Square = 20.6, p < 0.001}. Post-hoc comparisons were made using the Wilcoxon test. There were significantly more missed for the Hands-free {Z(19) = 2.91, p < 0.005} and Hand-held {Z(19) = 2.07, p < 0.05} condition in comparison to normal driving. Hands-free also had significantly more misses than alcohol {Z(19) = 2.86,
p < 0.005}. The number of false alarms signs was also
significantly different across the four conditions {Chi-Square = 9.3, p < 0.05}. Post-hoc comparisons found significantly more false alarms for the Hands-free {Z(19) = 2.06, p < 0.05} in comparison to normal driving. Hands-free {Z(19) = 2.41,
p < 0.05} and Hand-held {Z(19) = 2.06, p < 0.005} also had
significantly more false alarms than alcohol.
There were no gender differences observed among the performance data across any of the route sections or treatment conditions.
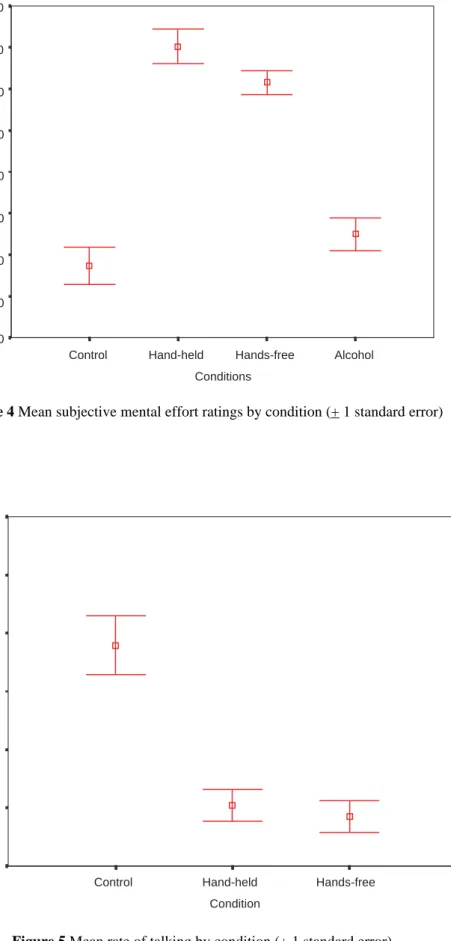
3.2 Subjective workload
A one-way repeated measures ANOVA was calculated for the subjective mental effort ratings across the four conditions (see Figure 4). There was a significant main effect by condition for mental effort {F(3, 57) = 66.62,
p < 0.001, η2 = 0.78}. Post hoc tests were run to compare the
mean mental effort ratings by condition. Mental effort was rated highest for the Hand-held drive and lowest for the Control drive. The Control required significantly less mental effort than the Hand-held (p < 0.001) and Hands-free (p < 0.001) conditions. The Alcohol was also rated significantly less demanding than the Hand-held (p < 0.001) and Hands-free (p < 0.001) conditions. Also, Hands-Hands-free required significantly more mental effort than Hand-held (p = 0.008).
The Alcohol drive was rated more demanding than the Control drive, however this difference was not significant.
3.3 Conversation performance
There were three conversation conditions (Hands-free, Hand-held and Control). The phone conversations were performed while driving and the conversations in the control condition were done while seated in a waiting area. Participants were asked how did the conversations
compare in complexity to their normal phone conversation while driving? All drivers rated the conversations as being more difficult.
The rate of talking was calculated for the conversations by counting the words and dividing it by the duration of that segment of conversation. A one-way repeated measure ANOVA was calculated for the rate of talking across the three conversation conditions (see Figure 5). There was a significant main effect for condition {F(1.3, 25) = 45.44,
p < 0.001, η2 = 0.71}. There was a significant problem of
sphericity with the data so a Huynh-Feldt correction was used. Post hoc tests were run to identify the differences. The rate of talking was significantly faster in the control conversations than in either the Hand-held (p < 0.001) or Hands-free conversations (p < 0.001). There were no differences between the two phone conditions.
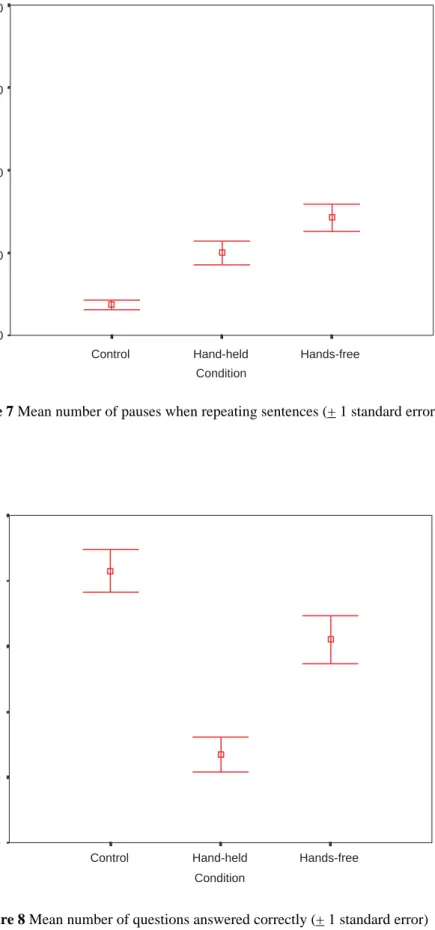
The number of pauses during the monologue portion of the conversations was calculated. A one-way repeated measure ANOVA was calculated for the number of pauses across the three conversation conditions (see Figure 6). There was a significant main effect for the number of pauses by condition {F(2, 38) = 35.31, p < 0.001, η2 =
0.65}. Post hoc tests were run to compare the conditions. The number of pauses was significantly less in the control conversations than in either the Hand-held (p < 0.001) or
Conditions Alcohol Hands-free Hand-held Control Mean Response Time (s) 1.6 1.4 1.2 1.0 .8
Conditions Alcohol Hands-free Hand-held Control Subjectiv e Mental Eff or t 110 100 90 80 70 60 50 40 30 Condition Hands-free Hand-held Control Rate of T a lking (w ords/ second) 3.0 2.8 2.5 2.3 2.0 1.8 1.5
Figure 4 Mean subjective mental effort ratings by condition (+ 1 standard error)
Hands-free conversations (p < 0.001). There were also significantly fewer pauses when using the Hands-free phones than when using Hand-held (p = 0.05).
A one-way repeated measure ANOVA was also
calculated for the number of pauses during the remembering sentences part of the conversations (see Figure 7). There was a significant main effect for the number of pauses by condition {F(2, 38) = 42.29, p < 0.001, η2 = 0.69}. The
number of pauses was significantly less in the control conversations than in either the Hand-held (p < 0.001) or Hands-free conversations (p < 0.001). Contrary to the monologues, there were also significantly fewer pauses when using the Hand-held phones than when using Hands-free (p = 0.001).
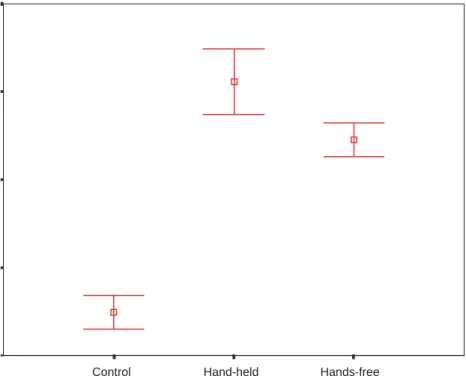
The same analysis was done for the number of correct responses by condition (see Figure 8). There was a
significant main effect for the number of correct answers by condition {F(2, 38) = 21.53, p < 0.001, η2 = 0.53}. The
number of correct answers was significantly greater in the control conversations than in either the Hand-held (p < 0.001) or Hands-free conversations (p = 0.039). There were also significantly more correct answers when using the Hands-free phones than when using hand-held (p = 0.001).
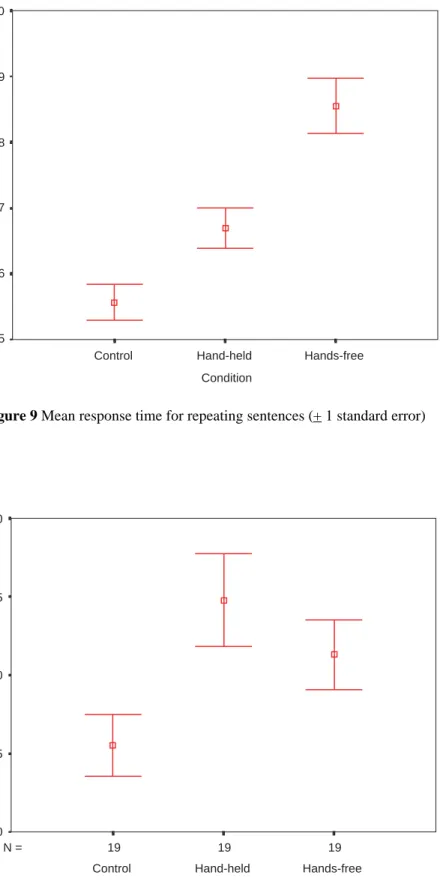
A one-way repeated measure ANOVA was also
calculated for the mean response time of repeating sentences (see Figure 9). There was a significant main effect for the time by condition {F(2, 38) = 111.75, p < 0.001, η2 = 0.86}.
The time to answer was significantly less in the control conversations than in either the Hand-held (p < 0.001) or Hands-free conversations (p < 0.001). The time was also significantly less when using the Hand-held phones than when using Hands-free (p < 0.001).
A one-way repeated measure ANOVA was also calculated for the mean response time of verbal puzzles (see Figure 10).
There was a significant main effect for the time by condition {F(2, 36) = 6.93, p < 0.005, η2 = 0.28}. The time to answer
was significantly less in the control conversations than in either the Hand-held (p = 0.002) or Hands-free conversations (p = 0.014). There was no significant difference in the response times between the phone conditions.
The number of conversation failures was also recorded. These were incidents where the driver completely failed to respond. The data was skewed and kurtotic so a Wilcoxon test was used to compare the two conditions. Although there was twice as many failed conversations with the Hand-held (19) than with the Hands-free phones (10), this difference was not statistically significant {Z(19) = 1.65, p = 0.098}.
3.4 Phone use questionnaire
All subjects owned their own mobile phone. Nokia was the most common brand (n = 8). Most respondents used their phones for personal reasons (n = 15) rather than business (n = 3). Two respondents only used their phones for emergencies. More than half (n = 14) used their phone every day or more often. Only seven respondents used Hands-free equipment for their phones.
Five respondents said they would make phone calls while driving and seven would not. Others said it would depend on the caller or the traffic situation. Eight
respondents said they would answer their phone if it rings while they were driving and four would not. Others said it would depend on the caller or the traffic situation. For incoming text messages, three respondents said they would read them while driving and eight said never. Others said it would depend on the caller or the traffic situation. Most respondents would never send a text message while
Condition Hands-free Hand-held Control Mean Number of P auses in Monologue 6 5 4 3 2
Condition
Hands-free Hand-held
Control
Mean Number of P
auses in Repeating Sentences
4.0 3.0 2.0 1.0 0.0 Condition Hands-free Hand-held Control Mean T o
tal Number of Correct Ans
w e rs 10 9 8 7 6 5
Figure 7 Mean number of pauses when repeating sentences (+ 1 standard error)
Condition Hands-free Hand-held Control Mean Response Time f or Repeating Sentences (s) 10 9 8 7 6 5 19 19 19 N = Condition Hands-free Hand-held Control Mean Response Time f or V erbal Puzzles (s) 4.0 3.5 3.0 2.5 2.0
Figure 9 Mean response time for repeating sentences (+ 1 standard error)
driving (n = 16). One driver did send text messages and three said it depended on the traffic situation.
In terms of frequency, most respondents would not normally use their phones while driving (n = 12). Six respondents would often use their phone while driving. Respondents were also asked to estimate the duration of their typical carphone conversation. Estimates were between 1 and 2 minutes on average. People spoke on the phone for up to 80% of their driving time, with most only being on the phone for around 1% of driving time. The majority of respondents used their phone for short and simple conversations (n = 6) or to exchange brief messages (n = 9). It was believed that business people were most likely to use their phones while driving (n = 16).
In the questionnaire, respondents were asked to provide some opinions about using phones while driving. All but one respondent believed that using Hand-held mobile phones while driving should be banned. A majority of respondents said there should not be a ban on Hands-free phones (n = 11). Only two thought there should also be a ban on Hands-free phones. The remaining seven said it depends.
In terms of penalties, a majority of respondents said there should be a fine for using Hands-held phones while driving (n = 11). Five believed that drivers should have points taken off their licence and 3 thought the penalty should be a written warning. Most respondents felt there should be not penalty for using a Hands-free phone while driving (n = 13).
Most respondents thought that drivers should pull over at a safe place along their route and stop before using their phone (n = 16). All respondents would not use their phones during difficult driving conditions. These included bad weather, heavy traffic, motorways and in city centres. Some respondents stated that they would not use their phones when there was a police car in sight.
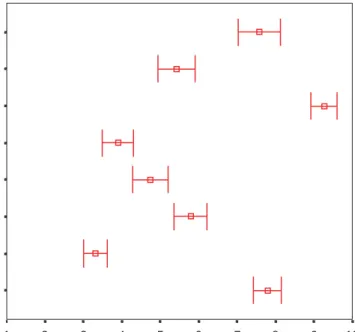
A repeated measures ANOVA was calculated on the eight different driver distraction ratings (see Figure 11). There was a significant main effect for type of distraction {F(5, 93) = 29.10, p < 0.001, η2 = 0.62}. There was a
significant problem of sphericity with the data so a Huynh-Feldt correction was used. Post hoc tests were run to compare the distraction ratings by condition. Sending a text message was considered to be the most distracting activity to perform while driving. From the list, the least distracting activity was having a conversation with a passenger. The subjects rated talking with a passenger as being significantly less distracting than talking on a Hands-free phone (p < 0.001). Tuning a radio was believed to be significantly less distracting than using a Hand-held phone (p = 0.001) and reading a map (p < 0.001), but not a Hands-free phone. Reading a map was rated as being more difficult than talking Hands-free (p = 0.002). Talking Hand-held was rated as being more difficult than talking Hands-free (p = 0.001).
4 Discussion
4.1 Summary of results
4.1.1 Driving performance
There was a tendency for drivers to slow down when talking on Hand-held or Hands-free phones, even when they were specifically instructed to maintain a set speed. Alcohol tended to have the opposite effect such that drivers drove faster than normal when under the influence of alcohol. The standard deviation of speed and speed error measures indicated that drivers’ had significantly poorer speed control when using the Hand-held phone than during the other three conditions. When drivers were under the influence of alcohol, they were significantly worse at
Hand-Held Hands-Free Text Messaging Eating Tuning radio Information System Talking to Passenger Reading a map
Not Distracting Very Distracting 10 9 8 7 6 5 4 3 2 1
driving smoothly (standard deviation of lane position) than during the other three conditions.
Towards the end of their route, drivers were instructed to flash their lights whenever a particular warning sign appeared at the roadside (e.g., pedestrians crossing). Reaction times were significantly slower for drivers using phones in comparison to when they had alcohol. Drivers were significantly slower when they had alcohol then when they had no distractions (i.e., control condition). Also, the drivers missed significantly more of these target signs when they were using a phone. There was also significantly fewer signs missed by the drivers when they were on alcohol in comparison to when they were using the Hands-free phones. The phone drivers were also responding to the wrong warnings more often than the alcohol drivers (false alarms).
4.1.2 Subjective ratings
From the subjective mental effort ratings participants made immediately after driving each route, it was clear that they found driving while using a Hand-held phone to be the most difficult. The easiest task was the normal driving without any phone conversations. Hands-free was easier than Hand-held. Drivers found it easier to drive drunk than to drive while using a phone, even when it was Hands-free.
4.1.3 Conversation performance
Conversations on the phones while driving were uniformly worse than conversations in the waiting room.
Conversation performance comparisons between Hand-held and Hands-free phones were mixed. Hands-free phones were worse than Hand-held phones for the repeating sentence tasks (time and number of pauses). Hand-held phones were worse than Hands-free phones for the verbal puzzles (errors) and monologues (number of pauses). Although there was twice as many failed
conversations with the Hand-held than with the Hands-free phones, this difference was not statistically significant. The conversations in this study were rated as being more difficult than the conversations participants would normally have on a phone while driving.
4.1.4 Phone use questionnaire
Sending a text message was considered to be the most distracting activity to perform while driving. From the list the least distracting activity was having a conversation with a passenger. The subjects rated talking with passengers as being significantly less distracting than talking Hands-free. Tuning a radio was believed to be significantly less distracting than using a Hand-held phone, but not a Hands-free phone. Reading a map was rated as being more difficult than talking Hands-free. Talking Hand-held was rated as being more difficult than talking Hands-free.
4.2 Interpretations and implications
Research has convincingly shown that phone
conversations impair driving performance. Until now, it has been difficult to quantify the risk of this impairment
because the comparison was to normal driving without using a phone. The aim of this study was to benchmark driving performance while using a mobile phone to a level of performance that is accepted by society as dangerous, i.e., driving with a blood alcohol level over the legal limit.
Results from this study showed a clear trend for significantly poorer driving performance (speed control, warning detection and response) when using a Hand-held phone in comparison to the other conditions. The best performance was for normal driving without phone conversations. Hands-free was better than Hand-held. Driving performance under the influence of alcohol was significantly worse than normal driving, yet tended to be better than driving while using a phone. Drivers also reported that it was easier to drive drunk than to drive while using a phone. The exception was with lateral control, where alcohol impaired lane-keeping performance more than the phones.
Alcohol is a central nervous system depressant that impairs the ability to perform complex tasks. Of relevance to driving, alcohol impairs the skills associated perception, divided attention, attentional shift, working memory, motor co-ordination, reaction time and rate of information processing (e.g., Moskowitz and Burns, 1990). The consequence of this impairment is that drivers with a 0.08% BAC have a four to five times greater risk of being involved in crash (e.g., Vinson, Mabe and Leonard, 1995). From the results of the present study, it could be argued that drivers would be exposed to an equivalent risk while using a phone.
The critical finding in this study was that phone use impaired drivers’ abilities to respond to warnings more so than alcohol. As Mcknight and Mcknight (1991) point out, the number of missed warnings has more significance for safety than the slowing of response times. The road traffic environment may have some tolerance for a delay in responding to a hazard. There is no tolerance for missed hazards.
The effect of phone use on speed has been observed in previous research on driver distraction (e.g., Alm and Nilsson, 1994). In fact it appears to be one of the more consistent finding in the research on driving with phones. One explanation is that drivers slow the vehicle in order to make the driving task easier. It is essentially a strategy they use to cope with the competing demands of multiple tasks. Another explanation is that drivers fail to monitor their speed and are unable to maintain their normal speed.
Although performance when using Hands-free phones was worse than Hand-held phones, Hands-free phones still impaired reaction times more than alcohol. Thus, even though Hands-free may be slightly less dangerous than Hand-held phones, the safest approach would be to turn phones off while driving.
Researchers have attempted economic rationalism to defend the risk of death and injury from using mobile phones while driving (Lissy et al., 2000). Baring the ethical issues of accepting the loss of human life and health, this work is flawed because it does not fully consider the context of phone use in cars. Of course there are benefits to having mobile phones in cars. However the major benefits are not
lost if the phone is turned off and a messaging service is used. In the event of a crash or a breakdown, the phone is still available to call emergency services.
4.3 Strengths and weaknesses
It is important to discuss the potential problems of comparing the impairment in driving performance caused by alcohol to the impairment caused by distraction from a phone conversation. The motivation for this comparison was the need to provide a benchmark of driving performance while using a mobile phone to a proven danger. However, alcohol may impair driving performance differently than driver distraction. As described above, alcohol is a central nervous system depressant whereas using a phone while driving divides drivers’ attentional resources. Divided attention through timesharing or multitasking tends to impair performance on one or more of the separate tasks (Wickens, 1992). The present study found that performance on both the conversation and driving tasks was impaired. During the alcohol condition, the drivers had no distractions and could concentrate fully on the driving tasks.
Also, the driver may have some control over their divided attention. A phone user can pause their
conversation in order to deal with a change in the traffic situation (e.g., to watch for a changing traffic light). Once a drunk driver is behind the wheel there may not be that much he or she can do to control their performance. Drivers will also stay drunk for the duration of their drive while the distraction from phones may only occur for a small portion of driving. Thus, on a trip by trip basis, drunk driving would be much more dangerous because the exposure to risk is greater. This risk would change when looking at a population level. At any given moment the amount of drivers using their phones would greatly exceed the number drunk drivers.
It is difficult to draw any straightforward conclusions about crash risk and severity from the present study. This is because the situations when drunken driving and phone use occur may be different. Drink driving tends to occur late at night on weekends whereas phone use can happen at any time. For example, drivers can use their phones when driving in town centres or on motorways during busy rush hour traffic. This difference would lead to differences in crash type and severity. Alcohol crashes are more likely to involve younger male drivers in a single vehicle road departure late at night and result in serious injury to the occupants (e.g., Johnston, 1982; Maycock, 1997). Although there is insufficient data on mobile phone crashes, one might expect them to involve lower speeds, other road users and less severe injuries.
Another issue with alcohol is that it impairs driver judgement. For example, a drunk driver might think they are driving well and that they are capable of driving faster. Phone use might delay or remove judgement, but it does not impair it as such.
One criticism of this work might be that only a small sample of drivers was used. The sample consisted of phone users and experienced drivers. It was not a sample of convenience and they were representative of the
population of English drivers that use phones. If anything, the small sample size should emphasise the magnitude of the results. Statistically significant differences were found among the conditions despite the low statistical power of the inferential tests. Furthermore, the size of effect tended to indicate moderate to large differences in performance among the conditions.
There may be some concern that the phone
conversations in this study were harder than typical in-car conversations. The material was difficult and the
conversations, although not continuous, lasted for the duration of the test drive. However, this study made it much easier for drivers by only considering the distraction from talking, thinking and listening. No other phone tasks were examined. The phone was answered before driving and was hung-up when the trial was completed. The task of using a mobile phone in a vehicle has many task elements that vary in the amount and way they distract the driver. Detailed hierarchical task analyses of Hand-held and Hands-free mobile phones have been conducted (Kersloot and Lansdown, 1999). Some of these task elements would be more or less distracting. Fuse et al. (2001), in a small simulator study, identified that driver reaction times were slower when making and receiving calls than during the conversation. They supported these findings with Japanese police reported crash data from 1997 that found the majority (69%) of crashes caused by phones were attributed to making and receiving calls. A much smaller amount occurred during the phone conversations (16%). Also, this only includes the direct task elements and does not include other distractions associated with making a call. Callers also need to plan the call, remember numbers, take notes, find information to support the conversation (e.g., a calendar), and reflect on the conversation afterwards (de Waard, et al, 2001). Furthermore, there is the distraction cause by the
interference and interruptions of poor phone connections. Other functions offered by phones might also be a
dangerous distraction, for example reading and composing text messages. Therefore, it is more likely that the phone tasks in this study were less complex than ‘real’ use. Consequently, driving performance when making and receiving calls can be expected to be even more impaired.
4.4 Future research
Nearly all road safety research (99%) is based on crash records that do not contain essential information about manoeuvres, immediate circumstances, indirectly involved road users and road features (Oppe, 2002). Because of this lack of fundamental information, we are unable to
determine the contribution of such things as mobile phones to causing crashes. It is essential that crash data include information on the presence of mobile phones in the vehicle. With improved accident reporting, the effects of mobile telephones on crash involvement can be
investigated and the precise hazards of phone use in cars will become even clearer.
Research is also needed to replicate the results of the present study in other countries and on a larger sample of drivers.
The Mobile Telecommunications Research Programme (MTHR) has funded TRL to conduct a study to compare the hazards of Hands-free conversations with more
conventional in-vehicle distractions like talking with passengers and operating the radio. This MTHR research is currently underway and the results will be available early in 2003.
5 Conclusions
Driving while intoxicated is clearly dangerous and this study further confirmed that alcohol impairs driving performance. However, this study also found that certain aspects of driving performance are impaired more by using a phone than by having a blood alcohol level at the legal limit (80mg/100ml). It is concluded that driving behaviour while talking on a phone is not only worse than normal driving, it can also be described as dangerous.
Although using a Hand-held phone while driving is illegal in many countries and can be considered as irresponsible and dangerous, this behaviour is common. Drivers should be strongly discouraged from engaging in any phone use while behind the wheel. It is hoped that this research will contribute to the growing evidence on the hazards of phone use and convince people to turn off their phones while driving.
6 Acknowledgements
The authors would like to thank Direct Line Insurance for commissioning this research.
7 References
Alm H and Nilsson L (1994). Changes in driver
behaviour as a function of hands-free mobile phones.
Accident Analysis and Prevention, 26, 441-451.
Borkenstein R F, Crowther F R, Shumate R P, Ziel W B and Zylman R (1964). The role of the drinking driver in
traffic accidents. Indiana University: Department of Police
Administration.
Brookhuis K A, de Vries G and de Waard D (1991). The
effects of mobile telephoning on driving performance.
Accident Analysis and Prevention, 23, 309.
Brown I D, Tickner A H and Simmonds D C (1969).
Interference between concurrent tasks of driving and telephoning. Journal of Applied Psychology, 53, 419-424.
de Waard D (1996). The measurement of drivers’ mental
workload. PhD thesis, University of Groningen. Haren,
The Netherlands: University of Groningen, Traffic Research Centre.
de Waard D, Brookhuis K and Hernandez-Gress N (2001). The feasibility of detecting phone-use related
driver distraction. International Journal of Vehicle Design,
26 (1), 85-95.
Fairclough S H, M Ashby, T Ross and Parkes A M (1991). Effects of hands-free telephone use on driving
behaviour. Proceedings of the ISATA International
Symposium on Automotive Technology and Automation, Florence, May, 403-409.
Fairclough S H and Graham R (1999). Impairment of
driving performance caused by sleep deprivation or alcohol: a comparative study. Human Factors, 41 (1), 118-128.
Fuse T, Matsunaga K, Shidoji K, Matsuki Y and Umezaki K (2001). The cause of traffic accidents when
drivers use car phones and the functional requirements of car phones for safe driving. International Journal of
Vehicle Design, 26 (1), 48-56.
Goodman M J, Bents F D Tijerina L, Wierwille W Lerner N and Benel D (1997). An investigation of the
safety implications of wireless communications in vehicles.
Washington DC: United States Department of Transportation, National Highway Traffic Safety Administration.
Johnston I R (1982). The role of alcohol in road crashes.
Ergonomics, 25 (10), 941-946.
Kersloot T and Lansdown T C (1999). In-vehicle
telephone task analysis. Presented at the Intelligent
Transport Systems (ITS) World Congress, Toronto.
Lamble D, Kauranen T, Laakso M and Summala H (1999). Cognitive load and detection in thresholds in car
following situations: safety implications for using mobile (cellular) telephones while driving. Accident Analysis and
Prevention, 31, 617.
Lissy K S, Cohen I T, Park M Y, Graham J (2000).
Cellular phone use while driving: Risks and benefits.
Boston, MA: Harvard Center for Risk Analysis, Harvard School of Public Health.
Maycock G (1997). Drinking and driving in Great Britain
– A review. TRL Report TRL232. Crowthorne: TRL
Limited.
McKnight A J and McKnight A S (1991). The effect of
cellular phone use upon driver attention. Washington DC:
National Public Services Research Institute. Funded by AAA Foundation for Traffic Safety.
Moskowitz H and Burns M (1990). Effects of alcohol on
driving performance. Alcohol Health & Research World,
National Police Agency Traffic Bureau (1998). Annual
Traffic Facts for 1997. Japan.
Oppe S (2002). Siem Oppe Colloquium. SWOV Institute
for Road Safety Research Newsletter, www.swov.nl, June 2002.
Parkes A (1991). The effects of hands-free telephone use
on conversation structure and style. Paper presented at the
24th Annual Conference of the Human Factors Association of Canada, HFAC/ACE, Vancouver, BC. 141-146.
Redelmeir D A and Tibshirani R J (1997). Association
between cellular-telephone calls and motor vehicle collisions. New England Journal of Medicine, 336 (7),
453-458.
Stewart Report (2000). Mobile phones and health. The
Independent Expert Group on Mobile Phones, Sir W. Stewart (Chairman), (www.iegmp.org.uk).
Stevens A and Minton R (2001). In-vehicle distraction
and fatal accidents in England and Wales. Accident
Analysis and Prevention. 33, 539-545.
Stevens A and Paulo D (1999). The use of mobile phones
while driving. TRL Report TRL318. Crowthorne: TRL
Limited.
Watson P E, Watson I D and Batt R D (1980).
Prediction of blood alcohol concentration in human subjects. Journal of Alcohol Studies, 40(7), 547-556.
Vinson D C, Mabe N and Leonard L L (1995). Alcohol
and injury: A case-crossover study. Archives of Family
Medicine, 4, 505-11.
Waugh J D, Glumm M M, Kilduff P W, Tauson R A, Smyth C C and Pillalamarri R S (2000). Cognitive
workload while driving and talking on a cellular phone or to a passenger. International Ergonomics Association
Conference, San Diego, USA.
Wickens C D (1992). Engineering psychology and human
performance, 2nd Edition. New York: Harper-Collins.
Zijlstra F R H (1993). Efficiency in work behaviour. A
design approach for modem tools. The Netherlands: PhD
Appendix A: Instructions
PLEASE ANSWER IN HANDHELD MODE THE MOBILE PHONE THAT IS RINGING BESIDE YOU. YOUR INSTRUCTIONS FOR THIS TRIAL SESSION AND SOME VERBAL TASKS WILL BE RELAYED THROUGH THIS PHONE
REACTION TIME TASK
Please look at image on the seat beside you: CYCLIST
at stages during the course of your drive various warning triangle signs will appear. For this drive you are looking for the CYCLIST sign only. As soon as you see it please respond by flashing the headlights, so that we can measure your reaction time. Please practice now.
FOLLOWING TASK
Please study the distance between you and the vehicle ahead. As this vehicle travels along the motorway it will vary its speed. Please start the engine, and follow it maintaining the current DISTANCE, no more no less.
NORMAL TRAFFIC
Your following exercise is over. Now please drive as you would normally on the motorway LINK - END MOTORWAY
Please move over to the inside lane. CURVES
As you go under the bridge I would like you to be travelling at 60mph. Please maintain a speed of 60mph and at the same time keep a line as close to the centre of this left-hand lane as you can
CHOICE REACTION END
Thank you that is the end of your session. Please stop the vehicle and then apply the handbrake, take it out of gear and switch the engine off.
Appendix B: Conversation tasks
Conversation A
RS – Repeat sentence VP – Verbal puzzle M – Monologue
RS1 Felix is darker than Antoine. Who is the lighter of the two?
VP1 The action of the brave cyclist kept the small boy from being hit by the 10-ton truck M1 YOUR SITTING ROOM
VP2 If you see a circle and it has a rectangle to the right of it and if there is a cross directly below the rectangle. Is the rectangle:
a. Below the cross? b. To the left of the Circle? c. Below the circle
RS2 It was raining this morning so the children wore their boots to school.
VP3 If Daphne walks twice as fast as Margaret and they are the only two people in a race, who is most likely to finish last?
RS3 Annie’s dog ran to her for help after it was attacked by a racoon in the woods. M2 A MEMORABLE HOLIDAY
VP4 If three chocolate bars cost 93 pence, what is the cost of one chocolate bar? RS4 The team was playing well until the third quarter, when snow made visibility poor.
VP5 Horse number seven entered the home stretch before Tom, number eight’s jockey, could get his horse out of the gate.
a. Which horse was Tom riding? b. Where was horse seven?
RS5 Police protection was given to Mary after her apartment was broken into by a daring thief.
M3 A FRIEND
VP6 Jack, who was working in Tim’s garage, found an old MG that belonged to his father. a. Who did the car belong to?
b. Where was Jack?
RS6 The car lost power trying to accelerate on the slippery hill during a storm in March. VP7 If a car drove 360 miles in six hours, how fast was the car going in miles per hour RS7 The train crept up the mountain slowly as it wended its way through the Rockies. M4 ROUTE TRL TO BRACKNELL
VP8 Who is sicker if Jane is less ill than Sam?
RS8 Jane started dancing at age eight, but didn’t give her first recital until she was twenty-three. VP9 If you see a picture with a cross beneath a rectangle, but to the right of a circle, is the rectangle:
a. Above the Circle? b. To the left of the Circle? c. Right of the cross?
RS9 The perfume was strong, but Jane liked the exotic scent of Jasmine. M5 ANIMALS BEGINNING B
Conversations B
VP1 If I say Jack stole Ann’s ball who is the thief?
RS1 The driver was stopped for driving 67 miles per hour in a 20 mile per hour zone. M1 THE INTERIOR OF YOUR CAR
VP2 If you see a picture with a diamond, a rectangle and a circle, and the circle is to the right of the rectangle and directly above the diamond, is the rectangle:
a. Right of the diamond? b. Above the circle? c. Left of the circle?
RS2 Undetected by the sleeping dog, the thief broke into Jane’s apartment. VP3 Which girl is taller if Jane is shorter than Kim?
RS3 Mike walked around the block three times before he had the nerve to knock on Carol’s door M2 YOUR DAILY WORK / ACTIVITIES
VP4 If Jane runs 6 miles in 54 minutes, how long does it take her to run one mile? RS4 The train left Cleveland an hour early, leaving Sam stranded at the station
VP5 The man who was an engineer came to the store where Alice worked to buy pastries. a. Who bought the pastries?
b. Where was Alice
RS5 The shorter the chapter, the easier it is for students to complete the difficult exercises. M3 A PAST / PRESENT BOSS
VP6 Because he was working late, Jack left a dinner in his microwave for Jim to heat up when he got home. a. Who was the dinner for?
b. Who did the Microwave belong to?
RS6 The warm humid weather that occurs in the tropics makes people sleepy by midday VP7 A chocolate bar costs 24 pence. What will 3 chocolate bars cost?
RS7 Old houses are more difficult to maintain, but worth the extra time and effort. M4 ROUTE FROM YOUR HOME TO M3 OR M4 MOTORWAY
VP8 Which house is smaller if Jim’s house is half again as big as Brian’s?
RS8 The students needed to complete chapters 9 and 11 and answer the question on page twenty. VP9 If you see a picture with a circle to the left of a square but on top of a cross, is the cross:
a. Above the square b. To the left of the circle? c. Below the circle?
RS9 The weather in March is snowy and cold in many parts of Canada. M5 NAMES BEGINNING A
Conversations C
VP1 If I say Jane is wearing Alison’s coat, who does the coat belong to?
RS1 The boat developed engine problems as it left port, leaving passengers wondering how long they would be delayed.
M1 YOUR LOCAL SUPERMARKET
VP2 If you see a picture with a circle and the cross is to the left of it and a rectangle is directly above the cross, is the cross:
a. Below the rectangle b. Left of the rectangle? c. Right of the Circle?
RS2 Chased by an angry cat, the mouse burrowed deeply into the woodpile. VP3 If Charles beats David in a sprint, which man is the faster running?
RS3 If you have occasion to visit the tropics try and go when ocean breezes make sailing fun. M2 LAST CHRISTMAS
VP4 If one pair of Jeans cost £21, how much will fours pairs cost?
RS4 Due to foresight and planning the family was able to realise their dream vacation. VP5 Janice, the head librarian, walked to the seventh floor, where John was shelving books.
a. Where was John? b. What did Janice do?
RS5 The video camera captured the bank robber’s daring daylight robbery of the First Avenue Bank. M3 A RELATIVE
VP6 In the backyard of Joe’s house, Alice and Frank’s dog played Frisbee a. Who did the dog belong to?
b. Where were they playing?
RS6 The car was clearly out of control as it careened across the median and into ongoing traffic. VP7 How many hours will it take to run 21 miles at a rate of three miles per hour?
RS7 Because he ripped his shirt on the nail, Sam had to mend the pocket. M4 ROUTE TRL TO WOKINGHAM
VP8 Eric is one and a half times as big as Allen. Who is the smaller?
RS8 The old house had cedar shingles and the floor sagged from five generations of scrambling children. VP9 If you see a picture with a diamond to the right of a circle and a square below the circle, is the circle:
a. Above the square? b. Below the diamond? c. Left of the square?
RS9 The wild flowers bloomed in profusion in the high meadows in August. M5 TOWNS BEGINNING R