The Patterns of Inter-firm and Inter-industry
Knowledge Flows in the Netherlands
Joseph Plasmans
Ruslan Lukach
CES
IFO
W
ORKING
P
APER
N
O
.
3057
C
ATEGORY11:
I
NDUSTRIALO
RGANISATIONM
AY2010
An electronic version of the paper may be downloaded
• from the SSRN website: www.SSRN.com
• from the RePEc website: www.RePEc.org
Knowledge Flows in the Netherlands
Abstract
This paper presents a study of backward and forward patent citations in patents granted to firms and institutions in the Netherlands by the United States Patent and Trademark Office (USPTO). The study establishes different patterns of patent citation in recent Dutch patents belonging to different industrial classes. We run our model in the set of backward citations made in Dutch applicants’ patents during 1996-2006 and in the set of forward citations to patents issued to firms and organizations in the Netherlands during 1993-2006. We compare the patterns of knowledge utilization (represented by backward patent citations) and knowledge dissemination (represented by forward patent citations) and obtain evidence of inter- or intra-firm and inter- or intra-industry knowledge spillovers. In the context of effective competition and innovation policies we advocate for paying special attention to industry specifics when designing policy programs and measures directed at stimulating R&D cooperation and knowledge spillovers. We present evidence that policies for promoting better knowledge exchange among firms should also distinguish between the measures for promoting the inward and the outward knowledge flows for companies in the Netherlands. JEL-Code: Z19.
Keywords: knowledge flows, R&D spillovers, backward and forward patent citations.
Joseph Plasmans Department of Economics University of Antwerp Belgium [email protected] Ruslan Lukach Department of Economics University of Antwerp Belgium [email protected]
Revised Version December 2009
The authors thank participants at the International AEA Conference on “Innovation and Patents” at the Hitotsubashi University inTokyo in December 2008 for fruitful discussions.
1. Introduction
The present research aims at investigating knowledge spillovers in firms and institutions in the Netherlands by examining their patent citation behavior. There are no doubts about the importance of knowledge spillovers for economic growth. Driven by this consideration, governments and public policy institutions show a considerable interest in developing effective policy measures to stimulate technological change, and to give an extra impulse for the development of the economy. An active technology policy in developed economies usually contains different policy instruments. For example: public R&D funding, intellectual property rights protection mechanisms, fiscal policy measures to stimulate R&D, etc.
In the contemporary knowledge and technology driven economy, the role of knowledge exchange and dissemination is often as important as, for example, the role of direct investment. First, knowledge spillovers allow a better penetration and diffusion of innovation among economic agents increasing their competitiveness through lower costs of obtaining a new technology. Second, knowledge spillovers stimulate cooperation in R&D by creating additional incentives for innovators to try to internalize knowledge flows and to pool the resources in joint research efforts. Both of these types of effects eventually result in faster technological progress and economic growth in the country.
The innovating firms rely on their intangible assets as a source of their market value and competitive position. Therefore, the flow of knowledge among such firms is not only a process of pure information sharing, but also contributes to the
increase/decrease of their market value, competitive and economic efficiency. In the contemporary knowledge and technology driven economy, the role of knowledge exchange and dissemination is often as important as, for example, the role of direct investment.
We can consider the notion of knowledge spillovers in several ways. According to De Bondt (1996), the concept of a „knowledge spillover‟ is specified as an
„involuntary leakage or voluntary exchange‟ of technological knowledge. In the study of Nieuwenhuijsen and van Stel (2003), knowledge spillovers are described as
a process in which one economic agent benefits from R&D efforts of another economic agent without any tangible remuneration.
When the firm decides to apply for a patent, it recognizes the potential value of the invention (Jaffe et al., 1993). Of course, this does not mean that non-patented knowledge is worthless, but we should advocate that the patented knowledge is the one most likely to be commercialized. Furthermore, a patent contains the
information verified and submitted afterwards to a controlling body. Thus, a patent citation is certified evidence of previous knowledge used by the inventor(s), who obtain(s) a given patent. This previous knowledge, eventually, comes from the same patented domain. Hence, we conclude that a patent citation determines a spillover of one protected (i.e., recognized as potentially valuable) knowledge pool to another. Gandal and Scotchmer (1993) advocate that it is more efficient to delegate research efforts to the agent with the highest ability by means of a Research Joint Venture (RJV) and this will lead to better private and social results. In the framework of d‟Aspremont and Jacquemin (1988), the study of Lukach and Plasmans (2000) investigated the optimal R&D and production strategies of firms that have different capabilities in research and production, which is very often the case in international markets. It concludes that in RJVs the firm with a lower marginal cost of R&D conducts by far the larger part of joint R&D. This finding provides additional evidence of delegation, initially described by Gandal and Scotchmer. Moreover, under conditions of greater knowledge spillovers, the creation of an RJV leads to an improved social welfare position.
Bernstein and Nadiri (1988) state that the existence of significant knowledge spillovers plays an important role in determining the effectiveness of fiscal policy measures on R&D investment, also for competition policy regarding RJVs. By stimulating firms to cooperate in R&D, the regulator shifts the mode of their R&D and production behavior from a competitive to a less competitive position with a higher value of the welfare function. For example, the profit maximizing firms in industries with weak knowledge spillovers tend to compete in R&D, rather than to cooperate. Thus, if the regulator wants to induce R&D cooperation, it should come up with some tangible way to stimulate these firms‟ cooperation. On the other hand, in conditions with strong knowledge spillovers, market forces provide a
certain stimulus for companies to cooperate in research and thus the regulator can save resources by letting „nature do its job‟. If we consider the regulator‟s task in stimulating the economic growth by inducing R&D cooperation, it becomes clear that the correct assessment of the knowledge spillovers‟ environment can be one of the important elements for the success of such regulating policy.
The study of patent citations has its own limitations. Advantages and disadvantages of using patent citations data are extensively discussed by Griliches (1990) and Jaffe et al. (1993). Patent citations are linked to the patenting procedure itself. They capture only the knowledge flows, which occur between patented „pieces‟ of innovation, thus underestimating the actual extent of knowledge spillovers. Other means of knowledge transfer are not captured by patent citations, such as: purchase of capital goods with embodied technologies, employment of engineers and other creative staff from other firms and institutions, voluntary knowledge exchange at conferences and in scientific publications. Although we admit the importance of other non-patent-citation ways of knowledge exchange, only a patent citation can be considered as the representation of such an exchange. Patent information is better protected than other forms of innovative information, because it clearly indicates the ownership over a particular piece of knowledge, which is protected by law.
Tijssen (2001) investigated the citations of granted USPTO patents relating to Dutch-authored research papers in order to ascertain the impact of Dutch-authored innovations on other patented knowledge. An extensive study of Verspagen (1997) analyses patent citations data in relation to the productivity growth analysis for a cross-country, cross-sectional sample. He advocates that patent citations provide a measure for knowledge spillovers, which is different from other conventional measures. In addition, Verspagen (1999) investigated the impact of large Dutch companies on domestic knowledge diffusion in the Netherlands by studying patent-to-patent citations data, provided by the EPO. This study employed a network analysis to analyze the place of Dutch multinationals in the domestic technology infrastructure.
In their contribution to the publication of The National Innovation System of Belgium, Capron and Cincera (2000) studied the technological performance of Belgian companies using international patent and scientific-publication information as output indicators of technological and innovation activity from 1980 to 1996.
This study aimed to determine the areas of comparative technological advantage and the regional distribution of innovative efforts in Belgium.
The study of Duguet and MacGarvie (2003), based on the results of a Community Innovation Survey (CIS) in France, shows that backward citations are correlated with firms‟ R&D and innovation activities, while forward citations are correlated with firms‟ answers on questions about their actions in disseminating their knowledge. Thus, even though backward and forward knowledge citations contribute to knowledge spillovers in a similar manner, the underlying economic rationales of these two processes differ.
In this paper we consider two different types of citations: backward (patent) citations and forward (patent) citations. Backward citations are citations listed in a particular patent and represent the technological knowledge acquired by the
inventor. Forward citations occur when a particular patent gets cited representing in this way the diffusion of knowledge encapsulated in this patent.
We construct two separate datasets for backward and forward citations that give us an opportunity to compare the industrial patterns of knowledge utilization
(represented by backward citations) and knowledge dissemination (represented by forward citations). The backward citations data yield a finally time-invariant picture of knowledge flows into the Netherlands via patent citations made by the innovating firms in the Netherlands between 1996 and 2006. The forward citations data contain all citations received by the patents of the firms in the Netherlands granted between 1993 and 2006.
Here we should point out one important assumption we made in order to analyze the forward citations data. Patents granted to firms in the Netherlands between 1993 and 2006 continue to receive citations as we speak. The forward citations dataset in this study is a snap-shot picture of a dynamic process as it was by the end of 2006. Therefore we do not attempt to derive any time-related implications for knowledge dissemination patterns in this paper. Yet it is rational to assume that the industrial structure of citations is persistent. Thus, we depart from the assumption that the probability that a particular patent will become cited by a patent from a particular industry remains the same over time. Therefore, we can then analyze the industrial structure of knowledge dissemination using the forward citations dataset.
In this paper we build upon the studies of Lukach and Plasmans (2003) and (2005), which estimated the likelihood of a citation appearing in a particular industry using the data contained in the patents issued to corporate applicants in Belgium. Their method relies on a comparative analysis of the data and a qualitative response variable analysis.
The main goal of this study is to uncover different patterns of backward and forward citations in recent patents belonging to different industrial classes in the
Netherlands. We observe that knowledge utilization (backward citation patterns) in patents obtained in, for example, the Electric Machines excl. Electronics industry can be described as primarily closed intra-firm exchange. Yet when looking at knowledge dissemination (being cited in forward citations), we see that knowledge exchange tends to be more inter-firm, thus indicating the relative strategic
importance of knowledge generated by the firms in this sector in the Netherlands. The opposite picture is observed in the Computers and Office Machines industry. Dutch firms in this sector tend to rely more on the knowledge created by other firms, while own innovations are more likely to be further disseminated inside the same company.
Thus, the citations data in our study provide evidence of inter- or intra-firm and inter- or intra-industry knowledge spillovers which are very industry specific and are different for processes of knowledge utilization and knowledge dissemination. Hence, the market environment factors originating in knowledge spillovers play their role in determining firms‟ incentives to cooperate in innovation. This asks for adopting differentiated approaches by the regulator.
In the context of developing effective competition and innovation policies we advocate for taking industry specifics of knowledge utilization and dissemination into account. This in particular concerns designing policy measures directed at stimulating R&D cooperation and knowledge spillovers. From the industrial economic literature we know that knowledge flows among firms and industries create natural incentives which induce firms‟ cooperation. If such incentives are strong, it is possible to consider a less intrusive approach to STI policy and rely on the „natural‟ tendencies towards cooperation and maybe stimulate only the most interesting joint R&D projects and/or alliances. Therefore, using the market
incentives in combination with policy interventions can be a more efficient way to achieve the policy objectives whether it is the higher R&D investment or better knowledge diffusion in the economy.
2. The Data
Our primary source of information lies in „patent citation pairs‟. This kind of data supplies a good opportunity to study knowledge flows, indicated by the citation references in the patent application. For example, Jaffe and Trajtenberg (1998) and Verspagen (1999) conducted analyses of different patent citation datasets using different methodologies: econometric probit(logit)-type models, technological proximity matrices, and network analysis.
We run our model in the set of backward citations made in applicants‟ patents in the Netherlands during 1996-2006 and the set of forward citations received by the patents of firms and organizations in the Netherlands granted during 1993-2006. In the primary dataset each line represents a single patent citation accompanied by several descriptive characteristics, which are: the patent number, the applicant‟s name, the applicant‟s country, the year in which the patent was granted, and the patent‟s class according to the International Patent Classification (IPC).
In addition to that, we use the IPC-ISIC (ISIC – the International Standard Industrial Classification of all economic activities of the United Nations) concordance table compiled by Verspagen et al. (1994) to transform the IPC classes into more
business-oriented groups indicated in the ISIC (compatible with the familiar NACE classification).
The source for the backward citations dataset is a collection of all patents granted by the USPTO to USPTO-applicants in the Netherlands during the period between 1996 and 2006. It contains 16228 patents, which produce 104262 initial backward patent-to-patent citations. For the forward citations analysis we depart from the collection of 91040 forward citations referring to the USPTO-patents in the Netherlands granted during 1993-2006.
-0.01 0 0.01 0.02 0.03 0.04 0.05 0.06 0.07 0.08 0.09 -2 0 2 4 6 8 10 12 14 16 18 20 22 24 26 28 30 32 34 Years Fre qu e nc y USPTO
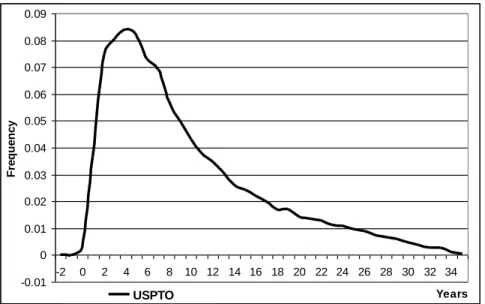
Figure 1. The Backward Citations Time Lag Structure.
We start by considering the time-related features of the backward citation data. Based on the time lag between citing and cited patents, we can derive the
implications about the time structure of knowledge spillovers. Figure 1 illustrates the distribution of patents cited by firms in the Netherlands across different years. The basic shape of the distribution is very much like the shape of the estimated citation frequency functions obtained by Jaffe and Trajtenberg (1998). The figure shows that recent patents (relative to the date of the citing patent) are more likely to be cited than the older ones. As we already mentioned above, the time-related features of forward citations are not relevant for this study and thus omitted. Table 1 presents all industries according to their ISIC, accompanied by the corresponding percentages of backward citations calculated in the pooled sample.
Code Industry % of backward citations 3850 Instruments 13.83 3832 Electronics 12.36
3510+3520 Chemistry, except pharmacy 12.36
3820 Other machinery 12.04
3825 Computers & office machines 9.53
3522 Pharmacy 7.84
3810 Metal products, ex. machines 7.09
3830 Electric mach., ex. electronics 5.25
3400 Paper, printing and publishing 5.17
3100 Food, beverages, tobacco 3.65
3900 Other industrial products 3.07
3600 Stone, clay and glass products 1.83
3843 Motor vehicles 1.14
5000 Building and construction 1.03
3200 Textiles, clothes, etc. 1.00
3300 Wood and furniture 0.69
3720 Non ferrous basic metals 0.39
3530+3540 Oil refining 0.33
3550+3560 Rubber and plastic products 0.31
3710 Ferrous basic metals 0.31
3840 Other transport 0.30
1000 Agriculture 0.26
3841 Shipbuilding 0.15
3845 Aerospace 0.06
4000 Utilities 0.01
Table 1. Backward Citation Percentages in Dutch Patents in different Industries. There are nine major industries which account for the largest part (85%) of all citations considered: 3850 (Instruments), 3832 (Electronics), 3510+3520
Office Machines), 3522 (Pharmacy), 3810 (Metal Products excluding Machines), 3830 (Electronic Machines, excluding Electronics), and 3400 (Paper, Printing and Publishing). Code Industry % of forward citations 3820 Other machinery 14,75
3510+3520 Chemistry, except pharmacy 14,53
3522 Pharmacy 12,65
3850 Instruments 11,90
3832 Electronics 11,56
3810 Metal products, ex. machines 7,03
3100 Food, beverages, tobacco 5,32
3825 Computers & office machines 4,92
3400 Paper, printing and publishing 4,17
3830 Electric mach., ex. electronics 3,86
3900 Other industrial products 2,87
3600 Stone, clay and glass products 1,61
3300 Wood and furniture 0,88
3843 Motor vehicles 0,85
3200 Textiles, clothes, etc. 0,70
5000 Building and construction 0,69
3840 Other transport 0,48
3550+3560 Rubber and plastic products 0,36
3710 Ferrous basic metals 0,30
3720 Non ferrous basic metals 0,25
3530+3540 Oil refining 0,10
1000 Agriculture 0,09
3841 Shipbuilding 0,07
3845 Aerospace 0,04
4000 Utilities 0,02
Correspondingly, Table 2 presents the forward patent citation frequencies in different industries from the pooled sample. As we can see all but one „top-ten‟ industries from the backward citations table are also occupying the top-ten positions in the forward citations frequency ranking. Only sector 3400 (Paper, Printing and Publishing) is now well below 5%, so that this industry will not be considered further and, for further modeling, we choose the same lists of eight key industries for the backward and forward citations datasets (since also sector 3100 (Food, beverages, and tobacco) remains well below 5% in the backward citations set in Table 1 so that the eight sectors represent 80.3 % of backward USPTO citations of and 81.2 % of forward USPTO citations to firms and organizations in the
Netherlands).2
3. Model and Estimations
Previous researchers‟ experience (Jaffe and Trajtenberg, 1998) shows that patent citations data are best to be analyzed using a binary choice qualitative response model. The occurrence of a citation with particular attributes represents a binary event (occurrence or not), of which it is possible to estimate the probability of occurrence.
We analyze one particular kind of event, which takes place as a patent citation occurs. The event is „the citation occurs in the citing patent belonging to the particular industry class‟. We study the estimated probability of this event and its relationship with a set of independent variables in order to derive analytical implications about the inter- and intra-industry/firm structure of knowledge
spillovers. Our dependent variable is an indicator, which has value 1 if the citation (either backward or forward) occurs in the patent of a given particular industry, and equals 0 otherwise. We have chosen patents from the eight major industries
(occupying the first eight places in Table 1) to be analyzed by the model.
2
Note that industry 3830 (Electronic Machines, excluding Electronics) is well below the 5% ceiling in the forward citations Table 2, but since the eight sectors including Electronic Machines, excluding Electronics are more representative for the forward citations than for the backward citations we leave this sector in the list of eight industries.
The list of explanatory variables consists of:
- an indicator that the patent citation has occurred between patents, owned by the same firm or institution (equals 1 if both citing and cited patents belong to the same firm, and equals 0 otherwise); it is represented by the dummy variable SameFirm; - a „concordance weighted‟ indicator that the citation has occurred between patents, belonging to the same ISIC-industry class (real number between 0 and 1 inclusive); it is represented by the variable SameIndustry;
- the year when the citing patent was issued represented by the variable Year; - the value of a citation lag (i.e. the time difference between citing and cited patents, expressed in years); it is represented by the variable CitationLag.
We use the concordance percentage from the MERIT Concordance Table (the share of the patents in each IPC class assigned to the corresponding ISIC category; see Verspagen et al. (1994) to weigh the indicator variable for the citation occurred. For example, if two patents belong to the same industry, we calculate the product of their concordance percentages, obtaining in this way the measure of the „citation occurrence‟ in this particular industry. The concordance percentage is the relative frequency of patents in the particular IPC class falling into a given ISIC class, thus their product in the citation pair represents a certain likelihood measure of the patent citation itself to fall into this ISIC class. Moreover, the usage of concordance
percentages leads to the expansion of the sample due to the fact that one IPC class may fall into several industries with different weights.
It is possible to estimate several different specifications of the binary choice model: probit, logit or log-log and complementary log-log (Long, 1997). Based on our experience of the Belgian study and the fact that in each estimate the dependent variable much more often takes up zero values than ones, we have chosen the complementary log-log distribution as the basis for our model (see Appendix). The complementary log-log distribution is asymmetric. The distribution of our
dependent variable is also likely to be asymmetric, because the number of citations occurring in a certain industry (corresponding to non-zero elements in the sample) is certainly expected to be much smaller than the number of citations in other
Distributions of the independent variables are asymmetric too. As we return to the graph (Figure 1) for the time lag variable, we see that it is quite asymmetric with more weight falling on the more recently granted cited patents. In our binary variables (such as the event indicator and the variable SameFirm) too, we see that zero values are more numerous than zero ones. This is also true for the non-binary variable SameIndustry in both backward and forward citations datasets. There are several notes to be made about interpretation of the results. Among the explanatory variables in our model we have one binary variable, two integer
variables, and one coming from the real numbers set. We immediately substitute the estimated coefficients by the corresponding slopes or marginal effects (see
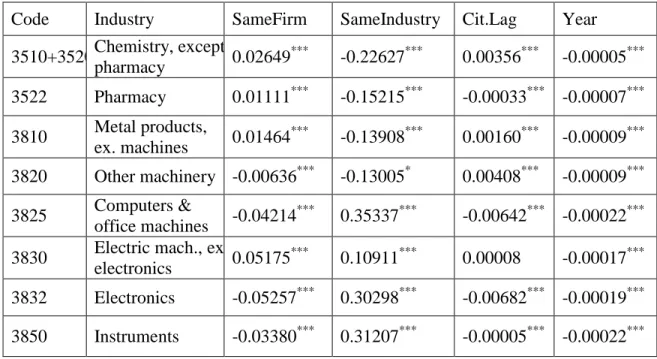
Appendix). The estimation results from the backward citations dataset are presented in Table 3 and from the forward citations dataset in Table 4 correspondingly.
Code Industry SameFirm SameIndustry Cit.Lag Year
3510+3520 Chemistry, except pharmacy 0.02649 *** -0.22627*** 0.00356*** -0.00005*** 3522 Pharmacy 0.01111*** -0.15215*** -0.00033*** -0.00007*** 3810 Metal products, ex. machines 0.01464 *** -0.13908*** 0.00160*** -0.00009*** 3820 Other machinery -0.00636*** -0.13005* 0.00408*** -0.00009*** 3825 Computers & office machines -0.04214 *** 0.35337*** -0.00642*** -0.00022*** 3830 Electric mach., ex.
electronics 0.05175
***
0.10911*** 0.00008 -0.00017*** 3832 Electronics -0.05257*** 0.30298*** -0.00682*** -0.00019*** 3850 Instruments -0.03380*** 0.31207*** -0.00005*** -0.00022***
Table 3. Estimated complementary log-log Marginal Effects in the Backward Citations
Dataset (*** indicates 1% statistical significance, ** corresponds to 5 %, and * to 10%) .
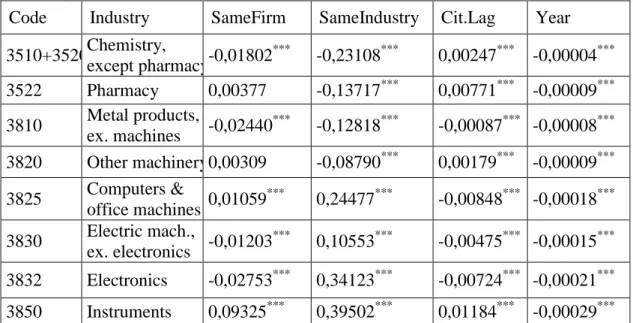
As we can see from Tables 3 and 4 both the backward and forward citation probability regressions provide the majority of slopes with a high degree of
statistical significance. The slopes of variables SameFirm and SameIndustry will be discussed further below, while here we will concentrate our attention on the time-related independent variables (only backward citation regressions are analyzed). The estimated slopes in the backward citations dataset show that older patents are more likely to be cited in the „Chemistry, excl. Pharmacy‟, „Pharmacy‟, „Other Machinery‟, and the „Metal Products, excl. Machines‟ industries. In the
„Instruments‟, „Computers and Office Machines‟, „Electronics‟, and „Electric Machines excl. Electronics‟ industries it is more likely that a more recent patent receives a citation.
Remarkably, all of the industries studied do not show a tendency towards making more citations in the patents granted in later years. Indeed, we expect that as more patent information resources become available to inventors and applicants, the number of citations made in a new patent application will increase. Our estimation does not provide support for this assumption. In all industries considered we observe negative slope coefficients indicating that newer patents are not likely to make more citations than older ones.
Code Industry SameFirm SameIndustry Cit.Lag Year
3510+3520 Chemistry, except pharmacy -0,01802 *** -0,23108*** 0,00247*** -0,00004*** 3522 Pharmacy 0,00377 -0,13717*** 0,00771*** -0,00009*** 3810 Metal products, ex. machines -0,02440 *** -0,12818*** -0,00087*** -0,00008*** 3820 Other machinery 0,00309 -0,08790*** 0,00179*** -0,00009*** 3825 Computers & office machines 0,01059 *** 0,24477*** -0,00848*** -0,00018*** 3830 Electric mach., ex. electronics -0,01203 *** 0,10553*** -0,00475*** -0,00015*** 3832 Electronics -0,02753*** 0,34123*** -0,00724*** -0,00021*** 3850 Instruments 0,09325*** 0,39502*** 0,01184*** -0,00029***
Table 4. Estimated complementary log-log Marginal Effects in the Forward Citations
Electronics
Pharmacy Other Machinery
Computers and office machines
Electric mach., ex. electronics Instruments
Chemistry ex. Pharmacy Metal products, ex.
Machines -0.40 0.00 0.40 -0.10 0.10 More Interfir More Intrafir More Interindustr More Intraindustr 'CLOSED' 'OPEN'
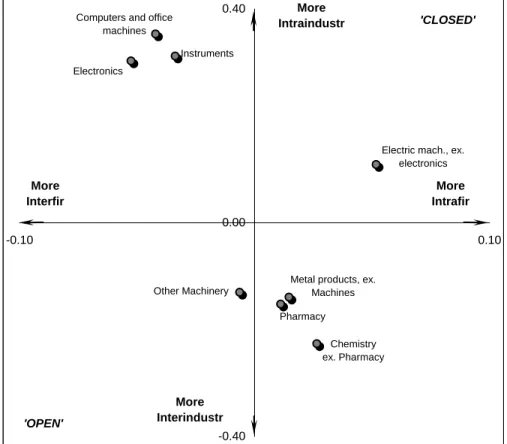
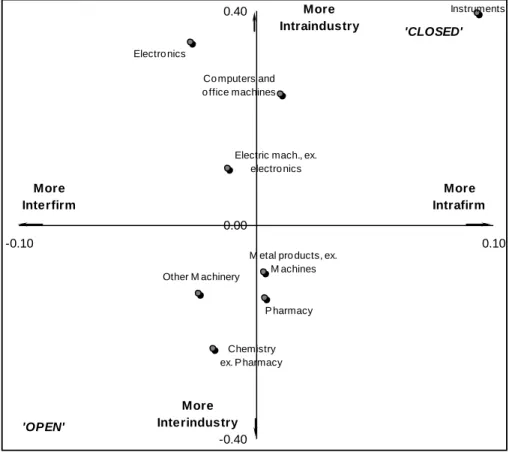
Figure 2. Positioning of Industries with Relation to Intra-firm and Intra-industry Knowledge Utilization Flows (Backward Citations Data).
To obtain a better view on general results of modeling the knowledge spillovers in the knowledge utilization and the knowledge dissemination contexts, we use a map of relative positions for particular industries with relation to the likelihood of intra-firm and intra-industry citation. Figures 2 and 3 are constructed in two dimensions, where on the horizontal axis we plot the slope coefficient for the SameFirm dummy and on the vertical axis is the slope coefficient for the SameIndustry variable. Such an arrangement is based on the interpretation of the obtained slope coefficients. A slope coefficient in our model describes the change in the probability of a patent citation at the means of the regressors (Greene, 1993, p. 879; see also Appendix).
Electro nics
P harmacy Other M achinery
Co mputers and o ffice machines
Electric mach., ex. electro nics
Instruments
Chemistry ex. P harmacy
M etal pro ducts, ex. M achines -0.40 0.00 0.40 -0.10 0.10 More Interfirm More Intrafirm More Interindustry More Intraindustry 'CLOSED' 'OPEN'
Figure 3. Positioning of Industries with Relation to Intra-firm and Intra-industry Knowledge Dissemination Flows (Forward Citations Data).
Thus, a pair of such coefficients for a particular industry points at its unique position on the map relative to other industries and the origin, which can be interpreted in the following manner. The bottom-left quadrant of the map contains industries, which are more inclined towards inter-firm and inter-industry knowledge spillovers (the probability of citation decreases for patents belonging to the same firm and industry class). We can call such industries „open‟. On the opposite, the top-right quadrant of the map contains more „closed‟ industries, which favor intra-firm and intra-industry citation (the citation is more likely if the patent pair comes from the same industry and is owned by the same firm). The bottom-right quadrant combines a higher likelihood of inter-industry, but intra-firm spillovers. And the top-left quadrant combines intra-industry and inter-firm spillovers correspondingly.
Following the discussion in Section 2 on specifics of Dutch patent citations data, we can also interpret the industry‟s openness towards inter-firm spillovers as openness towards more international knowledge flows. In Figures 2 and 3 we see that
different major industries occupy positions in different quadrants.
Now we consider each industry‟s position in both knowledge utilization and knowledge dissemination maps. The quadrant for „open‟ industries in terms of knowledge utilization contains only one industry, the „Other Machinery‟. This industry is also open when it comes to knowledge dissemination patterns. The „Other Machinery‟ sector seems likely to show more inter-firm (although the coefficient is not statistically significant) and definitely more inter-industry knowledge flows.
If we observe results further, we see that the „Electric Machines excluding
Electronics‟ industry exhibits the closed industry‟s knowledge utilization patterns. This implies that the knowledge utilization processes in this industry favors more intra-firm and intra-industry patterns. Yet the knowledge created in this industry is likely to be used differently. In the knowledge dissemination map we see that patents in the „Electric Machines excluding Electronics‟ industry are more likely to be patented by other firms, which makes this industry more open and also makes it similar to the „Electronics‟ industry. In the „Electronics‟ industry the patterns of backward and forward citations are similar and favor inter-firm but intra-industry knowledge flows.
The „Computers and Office Machines‟ and „Instruments‟ industries are open for inter-firm knowledge flows, and less inclined towards using the knowledge from other industries. They also both exhibit the same change in patent citation behavior when it comes to knowledge dissemination. The knowledge generated by the firms in these sectors is more likely to be used inside the same company and still inside the same industry.
The „Chemistry, excluding Pharmacy‟, „Pharmacy‟, and the „Metal Products excluding Machines‟ industries exhibit greater openness for inter-industry
knowledge spillovers, but are less inclined to cite the knowledge of other firms. The same patterns of knowledge flows persist in the forward citations data for
„Pharmacy‟ (although the SameFirm coefficient is not statistically significant) and „Metal Products excluding Machines‟. The „Chemistry excluding Pharmacy‟ industry shows different patterns for outbound knowledge flows (by the means of forward citations) by being more open towards inter-firm knowledge flows.
4. Conclusions and Policy Discussion
The objective of this study was to investigate the patenting and patent citation behavior of firms and institutions in a small open economy. We based the study on patent behavior of firms and institutions in the Netherlands using the 1996-2006 backward and 1993-2006 forward patent citations data from the USPTO. The attention of this study was concentrated on the patent citations of patent applicants related to firms and organizations in the Netherlands using binary response variable models. The results of the data analysis and estimations can be summarized as follows.
A preliminary analysis has shown that the majority of USPTO patent citations occur in a limited number of main industries.
The estimated probability of a patent citation calculated given a particular set of factors (SameFirm dummy and SameIndustry variable, time lag between the citing and the cited patents, the year in which the citing patent was issued) can be used as an efficient measure of strength of knowledge spillovers in a certain industry, and can be applied for various competitive behavioral models.
The industrial sectors analyzed exhibit different patterns of patent citation and the knowledge spillovers associated with them. These patterns are very industry-specific; we did not study however their possible correlation with the degree of foreign participation and/or ownership.
We observe that the patented knowledge utilization (backward citation patterns) in the „Electronics‟ industry is characterized by primarily closed intra-firm flows. At the same time the knowledge dissemination (being cited in forward citations) processes tend to be more inter-firm, which points at the relative strategic
Just the opposite situation can be seen in the „Chemistry excluding Pharmacy‟, „Instruments‟, and in the „Computers and Office Machines‟ industries. Firms in the Netherlands in these industries tend to use much of the knowledge created by other firms, while own recent innovative knowledge is more likely to be disseminated inside the same company.
Analyzing the relative positioning of different industries depending on their attitude towards inter-firm knowledge spillovers allows us to make certain implications about the necessity of measures to stimulate R&D cooperation, as well as better knowledge dissemination and utilization. For example, it is preferred that the
regulator proposes more R&D cooperation stimulating policy towards the industries with less intensive inter-firm knowledge spillovers, and employs less regulation in the industries where such spillovers are stronger and create more natural incentives for firms to cooperate in R&D.
We consider knowledge spillovers as a source of the positive externalities
determining the firms‟ incentives to cooperate in research and development. From the social planner‟s point of view, it is desirable to promote R&D cooperation, since it increases the efficiency of R&D, output and social welfare (d‟Aspremont and Jacquemin, 1988). Under conditions of stronger knowledge spillovers, innovative firms have more incentives to engage in R&D cooperation. For a policymaker whose goal is to induce R&D cooperation, it is important to balance the market incentives, created by stronger knowledge spillovers, and the regulative incentives. Once the special feature of the industry is determined, such as the likelihood of inter- or intra-firm spillovers and the likelihood of inter-industry knowledge
exchange, we obtain an understanding of the general knowledge spillovers intensity. The general guidelines for the regulator, derived from our study, can be summarized by observing the relative positioning maps along the horizontal axis. The industries in the right quadrants appear to be more oriented towards intra-firm knowledge spillovers, thus there are rationales for stimulating the R&D cooperation among the firms in these industries. On the other hand, the industries situated in the left quadrants, operate under conditions of stronger knowledge spillovers, and there are market incentives which drive the companies towards more cooperation. The regulator in this case can stand on less intrusive positions, observing the „natural‟
tendencies towards cooperation and maybe stimulating only the most interesting joint R&D projects and/or alliances.
Steurs (1995) and Bernstein and Nadiri (1988) point out that inter-industry
cooperation is more favorable for increasing the R&D investment and welfare than intra-industry cooperation. Hence, stimulating the inter-industry R&D cooperation among the firms gives a better positive effect than stimulating the intra-industry alliances. Such regulating measures will bring their best results if applied in the industrial sectors located in the upper quadrants of our maps, because knowledge spillovers and the corresponding natural incentives to cooperate in those industries are weaker.
Concluding this discussion, we bring up an argument that public authorities should use a differentiated approach to the regulation of R&D activities by firms in
different industries. There are market-driven incentives which induce firms‟
cooperation; thus it is possible for a regulator to use these incentives in combination with particular regulatory measures to achieve desired effects whether it is the higher R&D investment or better knowledge diffusion in the economy. The major outcome of such a successful policy will eventually surface in faster economic growth.
Finally, in the ideal scenario it is desirable to have a balanced picture of knowledge utilization and knowledge dissemination. The regulatory measures, which stimulate R&D cooperation, should take into account the type of knowledge flows prevailing in a particular industry. In industries with weak outward knowledge flows it is preferable to favor the joint R&D efforts, which are directed at better dissemination of knowledge produced by firms in the Netherlands. In the opposite situation (weak inward knowledge spillovers) attention should be paid to stimulating better
knowledge utilization and improving the absorption capacity of enterprises in the Netherlands.
5. Appendix: Complementary log-log Model for Patent Citations
The pooled dataset contains a list of citation pairs, which were made in the granted patents. Thus, if we consider the probability of a citation to occur in patent pairs from our dataset, it is equal to 1. Within this population, we select several other sub-events, for example „the citation is made in the citing patent coming from industry A‟. The complementary log-log model is specified as:
' '
P(yi 1) F( xi) 1 exp( exp( xi)),i = 1, 2,..,n,
where n is the number of observations (for details see Plasmans, 2006). In our case we have:
1 2 3 4
'xi Consti SameFirmi SameIndustryi Year CitationLagi i
.
The dependent variable Yi is an indicator that the patent citation is made in the patent belonging to a particular industry. It is also known that the estimated
coefficients of this type of model do not give the value of the marginal effect of the independent variable. The marginal effect for an independent variable is calculated as the product of the corresponding equation coefficient and the value of the density function calculated at the means of regressors:
' ' ˆ ( ) ˆ ˆ ( ) i i i i j ij x x F x f x x , i1, 2,..,n, j1, 2,.,k,
where f x( i'ˆ)exp(xi'ˆexp(xi'ˆ)) is the complementary log-log density function calculated at the mean of the estimated structural part of the model. For a binary independent variable b, the marginal effect (also called slope) is calculated as: P Y{ 1|x b*, 1} P Y{ 1|x b*, 0}. However, Greene (1993, p. 878) indicates that „simply taking the derivative with respect to the binary variable as if it were continuous provides an approximation that is often surprisingly
accurate‟. Thus, we calculate the slopes for the binary independent variables in our model in the same way as we do this for non-binary variables.
References
d‟Aspremont, C. & Jacquemin, A. (1988). Cooperative and Noncooperative R&D in Duopoly with Spillovers. The American Economic Review, 78, 1133-1137. Bernstein, J. & Nadiri, M. (1988). Inter-industry R&D Spillovers, Rates of
Return, and Production in High-Tech Industries. The American Economic Review, 78, 429-434.
Capron, H. & Cincera, M. (2000). Technological Performance. The National Innovation System of Belgium, ed. by H. Capron and W. Meeusen, Physica-Verlag.
De Bondt, R. (1996). Spillovers and innovative activities.International Journal of Industrial Organization, 15, 1-28.
Duguet, E. & MacGarvie, M. (2003). How well do patent citations measure flows of technology? Evidence from French innovation surveys. CNRS Cahiers de la Maison des Sciences Economiques 2003/99, Centre National de la Recherche Scientifique, Université Paris 1.
Gandal N. & Scotchmer, S. (1993). Coordinating Research Through Research Joint Ventures. Journal of Public Economics, 51, 173-193.
Greene, W. (1993). Econometric Analysis. Prentice Hall International, Inc., New York.
Griliches, Z. (1990). Patent Statistics as Economic Indicators: a Survey. Journal of Economic Literature, 92, 630-635.
Jaffe, A., Trajtenberg, M. & Henderson, R. (1993). Geographic Localization of Knowledge Spillovers as Evidenced by Patent Citations. Quarterly Journal of Economics, 108, 577-598.
Jaffe, A. & Trajtenberg, M. (1998). International Knowledge Flows: Evidence from Patent Citations. Working Paper 6507, National Bureau of Economic Research, Cambridge, Massachusetts.
Long, J. (1997). Regression Models for Categorical and Limited Dependent Variables. SAGE Publications, London.
Lukach, R. & Plasmans, J. (2000). R&D and Production Behavior of Asymmetric Duopoly Subject to Knowledge Spillovers. CESifo Working Paper No. 287, CESifo, Munich.
Lukach, R. and J. Plasmans (2003), Measuring Knowledge Spillovers in the New Economy Firms in Belgium Using Patent Citations, Global Business and Economics Review, 5, 75-99.
Lukach, R. and J. Plasmans (2005), International Knowledge Flows from and into a Small Open Economy: Patent Citation Analysis, Chapter 13 in A. Spithoven and P. Teirlinck (eds.), Beyond Borders, Elsevier, Amsterdam, 331-357. Nieuwenhuijsen, H.R. and A.J. van Stel (2003). Knowledge Spillovers and
Economic Growth. EIM Report, Rotterdam.
Plasmans, J. (2006), Modern Linear and Nonlinear Econometrics, Springer Verlag, New York.
Plasmans, J., Pauwels, W. & Thewys, T. (1999). Strategic R&D and Patent Behavior in some EU-countries. TEW Research Paper 99/042, UFSIA – University of Antwerp.
Steurs, G. (1995). Inter-industry R&D Spillovers: What Difference Do They Make? International Journal of Industrial Organization, 13, 249-276. Tijssen R.J.W. (2001), Global and Domestic Utilization of Industrial Relevant
Science: Patent Citation Analysis of Science-Technology Interactions and Knowledge Flows, Research Policy, No. 30, pp. 35-54.
Verspagen, B. (1997). Measuring Intersectoral Technology Spillovers: Estimates from the European and US Patent Office Databases. Economic Systems Research, 9, 47- 65.
Verspagen, B. (1999). The Role of Large Multinationals in the Dutch Technology Infrastructure. A Patent Citation Analysis. Working Paper, Eindhoven Center for Innovation Studies (ECIS), Maastricht Economic Research Institute on Innovation and Technology (MERIT).
Verspagen, B., van Moergastel, T. & Slabbers M. (1994). MERIT concordance table: IPC - ISIC (rev.2). MERIT Research Memorandum 94-004, MERIT. Vonortas, N. (1997). Cooperation in Research and Development. Kluwer
Favoritism: Is Politically-driven Aid less Effective?, March 2010
2994 Sven Neelsen and Thomas Stratmann, Effects of Prenatal and Early Life Malnutrition: Evidence from the Greek Famine, March 2010
2995 Claude Hillinger and Bernd Süssmuth, The Quantity Theory of Money: An Assessment of its Real Linchpin Prediction, March 2010
2996 Matthew M. Chingos and Martin R. West, Do More Effective Teachers Earn More Outside of the Classroom?, March 2010
2997 Laurence Jacquet and Dirk Van de gaer, A Comparison of Optimal Tax Policies when Compensation or Responsibility Matter, March 2010
2998 Valentina Bosetti, Carlo Carraro, Romain Duval and Massimo Tavoni, What Should we Expect from Innovation? A Model-Based Assessment of the Environmental and Mitigation Cost Implications of Climate-Related R&D, March 2010
2999 Scott Alan Carson, Nineteenth Century Stature and Family Size: Binding Constraint or Productive Labor Force?, March 2010
3000 Jukka Pirttilä and Ilpo Suoniemi, Public Provision, Commodity Demand and Hours of Work: An Empirical Analysis, March 2010
3001 Bertrand Candelon and Franz C. Palm, Banking and Debt Crises in Europe: The Dangerous Liaisons?, March 2010
3002 Joan Costa-i-Font and Marin Gemmill-Toyama, Does Cost Sharing really Reduce Inappropriate Prescriptions?, March 2010
3003 Scott Barrett, Climate Treaties and Backstop Technologies, March 2010
3004 Hans Jarle Kind, Tore Nilssen and Lars Sørgard, Price Coordination in Two-Sided Markets: Competition in the TV Industry, March 2010
3005 Jay Pil Choi and Heiko Gerlach, Global Cartels, Leniency Programs and International Antitrust Cooperation, March 2010
3006 Aneta Hryckiewicz and Oskar Kowalewski, Why do Foreign Banks Withdraw from other Countries? A Panel Data Analysis, March 2010
3007 Eric A. Hanushek and Ludger Woessmann, Sample Selectivity and the Validity of International Student Achievement Tests in Economic Research, March 2010
3010 Michel Beine and Sara Salomone, Migration and Networks: Does Education Matter more than Gender?, April 2010
3011 Friedrich Schneider, Tilman Brück and Daniel Meierrieks, The Economics of Terrorism and Counter-Terrorism: A Survey (Part I), April 2010
3012 Friedrich Schneider, Tilman Brück and Daniel Meierrieks, The Economics of Terrorism and Counter-Terrorism: A Survey (Part II), April 2010
3013 Frederick van der Ploeg and Steven Poelhekke, The Pungent Smell of “Red Herrings”: Subsoil Assets, Rents, Volatility and the Resource Curse, April 2010
3014 Vjollca Sadiraj, Jan Tuinstra and Frans van Winden, Identification of Voters with Interest Groups Improves the Electoral Chances of the Challenger, April 2010
3015 Guglielmo Maria Caporale, Davide Ciferri and Alessandro Girardi, Time-Varying Spot and Futures Oil Price Dynamics, April 2010
3016 Scott Alan Carson, Racial Differences in Body-Mass Indices for Men Imprisoned in 19th Century US Prisons: A Multinomial Approach, April 2010
3017 Alessandro Fedele, Paolo M. Panteghini and Sergio Vergalli, Optimal Investment and Financial Strategies under Tax Rate Uncertainty, April 2010
3018 Laurence Jacquet, Take it or Leave it: Take-up, Optimal Transfer Programs, and Monitoring, April 2010
3019 Wilhelm Kohler and Jens Wrona, Offshoring Tasks, yet Creating Jobs?, April 2010 3020 Paul De Grauwe, Top-Down versus Bottom-Up Macroeconomics, April 2010 3021 Karl Ove Aarbu, Demand Patterns for Treatment Insurance in Norway, April 2010 3022 Toke S. Aidt and Jayasri Dutta, Fiscal Federalism and Electoral Accountability, April
2010
3023 Bahram Pesaran and M. Hashem Pesaran, Conditional Volatility and Correlations of Weekly Returns and the VaR Analysis of 2008 Stock Market Crash, April 2010
3024 Stefan Buehler and Dennis L. Gärtner, Making Sense of Non-Binding Retail-Price Recommendations, April 2010
3025 Leonid V. Azarnert, Immigration, Fertility, and Human Capital: A Model of Economic Decline of the West, April 2010
3028 Clara Graziano and Annalisa Luporini, Optimal Delegation when the Large Shareholder has Multiple Tasks, April 2010
3029 Erik Snowberg and Justin Wolfers, Explaining the Favorite-Longshot Bias: Is it Risk-Love or Misperceptions?, April 2010
3030 Doina Radulescu, The Effects of a Bonus Tax on Manager Compensation and Welfare, April 2010
3031 Helmut Lütkepohl, Forecasting Nonlinear Aggregates and Aggregates with Time-varying Weights, April 2010
3032 Silvia Rocha-Akis and Ronnie Schöb, Welfare Policy in the Presence of Unionised Labour and Internationally Mobile Firms, April 2010
3033 Steven Brakman, Robert Inklaar and Charles van Marrewijk, Structural Change in OECD Comparative Advantage, April 2010
3034 Dirk Schindler and Guttorm Schjelderup, Multinationals, Minority Ownership and Tax-Efficient Financing Structures, April 2010
3035 Christian Lessmann and Gunther Markwardt, Decentralization and Foreign Aid Effectiveness: Do Aid Modality and Federal Design Matter in Poverty Alleviation?, April 2010
3036 Eva Deuchert and Conny Wunsch, Evaluating Nationwide Health Interventions when Standard Before-After Doesn’t Work: Malawi’s ITN Distribution Program, April 2010 3037 Eric A. Hanushek and Ludger Woessmann, The Economics of International Differences
in Educational Achievement, April 2010
3038 Frederick van der Ploeg, Aggressive Oil Extraction and Precautionary Saving: Coping with Volatility, April 2010
3039 Ainura Uzagalieva, Evžen Kočenda and Antonio Menezes, Technological Imitation and Innovation in New European Union Markets, April 2010
3040 Nicolas Sauter, Jan Walliser and Joachim Winter, Tax Incentives, Bequest Motives, and the Demand for Life Insurance: Evidence from two Natural Experiments in Germany, April 2010
3044 Matthias Kalkuhl and Ottmar Edenhofer, Prices vs. Quantities and the Intertemporal Dynamics of the Climate Rent, May 2010
3045 Bruno S. Frey and Lasse Steiner, Pay as you Go: A New Proposal for Museum Pricing, May 2010
3046 Henning Bohn and Charles Stuart, Population under a Cap on Greenhouse Gas Emissions, May 2010
3047 Balázs Égert and Rafal Kierzenkowski, Exports and Property Prices in France: Are they Connected?, May 2010
3048 Thomas Eichner and Thorsten Upmann, Tax-Competition with Involuntary
Unemployment, May 2010
3049 Taiji Furusawa, Kazumi Hori and Ian Wooton, A Race beyond the Bottom: The Nature of Bidding for a Firm, May 2010
3050 Xavier Vives, Competition and Stability in Banking, May 2010
3051 Thomas Aronsson and Erkki Koskela, Redistributive Income Taxation under Outsourcing and Foreign Direct Investment, May 2010
3052 Michael Melvin and Duncan Shand, Active Currency Investing and Performance Benchmarks, May 2010
3053 Sören Blomquist and Laurent Simula, Marginal Deadweight Loss when the Income Tax is Nonlinear, May 2010
3054 Lukas Menkhoff, Carol L. Osler and Maik Schmeling, Limit-Order Submission Strategies under Asymmetric Information, May 2010
3055 M. Hashem Pesaran and Alexander Chudik, Econometric Analysis of High Dimensional VARs Featuring a Dominant Unit, May 2010
3056 Rabah Arezki and Frederick van der Ploeg, Do Natural Resources Depress Income Per Capita?, May 2010
3057 Joseph Plasmans and Ruslan Lukach, The Patterns of Inter-firm and Inter-industry Knowledge Flows in the Netherlands, May 2010