Mapping the Value of an Innovation:
An Analytical Framework
Greg Linden, Kenneth L. Kraemer and Jason Dedrick
[email protected], [email protected], [email protected]
Personal Computing Industry Center, UC Irvine 5251 California Ave, Suite 250
Irvine, California 92697
May 2007
The Personal Computing Industry Center is supported by grants from the Alfred P. Sloan Foundation, the U.S. National Science Foundation, industry sponsors, and University of California, Irvine (California Institute of Information Technology and Telecommunications, The Paul Merage School of Business, and the Vice Chancellor for Research). Online at http://pcic.merage.uci.edu. For information, contact Jason Dedrick (949/824-2863) or Kenneth L. Kraemer (949/824-5246).
Introduction
Innovation is held to be a key to U.S. competitiveness, but there is little understanding of who captures the value from a successful innovation. This paper is a preliminary report on a study that will answer the question for specific examples of innovation. Here, we begin by looking at Apple’s iPod, a successful innovation whose thriving ecosystem has upended business models across the consumer electronics, computer, and entertainment industries.
Up through the 1980s, innovative electronics companies retained much of the benefits of their innovations which were manufactured within their vertically integrated operations. Since then, supply chains in the global electronics industry have steadily disaggregated across separate companies and across oceans (Sturgeon, 2002). Although some
companies, particularly in Japan and Korea, still pursue a vertically integrated business model, most companies that formerly manufactured most products in-house, such as IBM and HP – as well as recent start-ups who never had manufacturing capabilities – have outsourced production to global networks of contract manufacturers (CMs).
Today the creation of a successful product in the vertically-disaggregated electronics industry spreads wealth far beyond the lead firm, i.e. the company whose brand appears on the product, and who bears primary responsibility for conceiving, coordinating, and marketing new products. While the lead firm and its shareholders are the focal
beneficiaries of the firm’s strategic planning, other beneficiaries include partners in the firm’s supply chain and firms that offer complementary products or services, each of which will have its own chain of input and service providers. This web of distributed value spans much of the globe.
Lead firms recognize how their products create potential value and they negotiate over its division with their partners. A successful lead firm understands that the creation of value through innovation is not a zero sum game, and profits are needed all along the supply chain for a business model to be sustainable.
In this paper, we build a framework for measuring and mapping the value created along a supply chain and show preliminary results from an analysis of one model of the Apple iPod. Data issues and theoretical extensions are also discussed.
Quantifying the value created by a hugely successful innovation like the iPod – and measuring how much of that value is captured by the lead firm, Apple – provides an example of the potential benefits from innovation. The analysis, which requires numerous estimates, yields a noisy approximation of the true value, but is sufficiently accurate to shed light on questions of policy and strategy, such as
• How much of the value is created and captured by the innovating or lead company versus its suppliers or business partners?
The results will be of interest to managers, academics, and policy makers confronted with issues such as (1) the extent to which firms capture the benefits from investing in
innovation when they rely on other firms for most of the inputs to their products, and (2) whether innovation in global supply chains yields domestic benefits. The preliminary results reported here suggest that a runaway success like the iPod yields large financial benefits for Apple and leads to significant U.S. domestic value capture despite the disaggregated and global nature of the product’s value chain. This is an important preliminary finding in the context of current public debates about globalization and the balance of trade. It suggests that international trade statistics, which show a negative trade balance for computers and electronics, tell an incomplete story about innovation and the capture of value.
Conceptual framework
A lead firm in the electronics industry is embedded in a network of organizations interconnected by flows of products, services, and payments. At each node, inputs are purchased and converted, then revenue is realized. The difference between revenue and the cost of externally-sourced inputs is a node’s value added.3
Value added differs from netprofit by the amount of the wage bill, depreciation, and corporate overhead, including marketing expense, interest, and taxes. Value added is the primary building block of the “production” method of calculation gross national product (GNP), which is the sum of the value contributed by each sector of the economy. This differs from the “income” approach to national accounting, which totals the net profits of firms and the wages of individuals to arrive at GNP.4
In mathematical terms, let p be the wholesale price of the final product and i(n) be externally sourced input n, which must be a product-specific component or service and not an apportioned general expense. Product-level value added (V) can then be expressed as:
V =p− i(n) n
∑
At the firm level, value added equals total revenue minus externally acquired inputs. By the logic of income accounting, it is also roughly equal to the wages, profits, depreciation and interest expense of the firm. At the national level, the aggregation of within-border value added across all companies equals Gross Domestic Product, which, by a logic
3
In addition to value added, each node also represents jobs, which will be considered in a later stage of this project.
4
Gross National Product tells what companies headquartered in country A earn, regardless of where their manufacturing occurs, whereas Gross Domestic Product tells what companies earned from operations in country A regardless of where they are headquartered.
similar to the firm level, equals the sum of wages and profits earned by workers and firms located there.
The distribution of value added across organizational and national boundaries thus directly concerns variables of importance to policy makers. An analysis of value added at the industry, firm, or product level can help to answer important policy questions such as: To what extent does successful product development translate into national economic and employment growth? To what extent are local fortunes tied to those of other countries? For a concrete example, consider a Dell notebook computer. For each model, Dell performs the conceptual design and delivers the specifications to one of its Taiwanese original design manufacturers (ODMs), such as Quanta Computer, the world’s largest assembler of notebook computers, which builds the computers at its plant in Shanghai, China. Dell’s Taiwan Design Center works with Quanta headquarters on physical engineering of the product, and its office in Shanghai works with the Quanta factory on engineering for quality and cost control in manufacturing. The nearly complete notebooks are shipped to Dell’s final assembly plant in Penang, Malaysia, where high value
components such as microprocessors, hard drives, optical drives, batteries and memory are added by Dell along with downloads of customer software, and each notebook undergoes burn-in and testing before direct shipment to the final customer. If the Dell notebook is purchased with third-party components such as a Canon printer, the notebook will be sent to a distributor who brings the full order together for shipment to the end customer.
It would be easy to think that because all the manufacturing and some of the design and support activities have moved to Asia, the bulk of the value added has moved there as well. Yet the issue is actually more complex.
Consider, for example, the related issue of jobs. Many electronics jobs have indeed shifted to Asia. In one industry segment, hard disk drives, U.S. firms, which employed about 66% of the industry’s workers worldwide in the late 1990s, had only 30% of their workers in the United States, with most of the rest in Southeast Asia (Gourevitch, et al., 1997). Yet the same study, which didn’t analyze value added, found that some 62% of the wages paid by these firms went to their U.S. employees, because U.S. wages are much higher than those in Southeast Asia.
As this example makes clear, any study of the global distribution of wealth and work within an industry must be careful about what’s counted (jobs or wages, in this example), and how.
Within a supply chain, each component involves some value added for its producer, which then becomes part of the costs for the next stage of production. The sum of these value added amounts (plus the raw materials or other inputs) equals the final product price.
activities involved in passing from raw material to the consumer (Kaplinsky and Morris, 2001). A stylized supply chain for a generic electronic product is shown in Figure 1.
Figure 1. Generic Electronics Supply Chain
Each product will have a large number of low-value components, such as capacitors and coils, that cost only pennies each and are commodities complying with mature standards that permit almost no manufacturer differentiation. Although the manufacturers of these components earn profits, they account for a very small share of the total value added along the supply chain. The iPod model discussed in the next section, for example, has 424 parts, of which 300 cost one cent or less.
We expect suppliers of these generic inputs to command thin margins because they compete with close substitutes. On the other hand, the generic nature of these
components also means that they are less subject to opportunistic behavior by the lead firm, unlike suppliers who commit specific, non-transferable assets such as building a factory for components near the lead firm’s assembly plant (Williamson, 1985).
Most electronics products will also contain a few high-value components, such as a visual display or a key integrated circuit. These components, which are themselves complicated systems, are the most likely to embody proprietary knowledge that helps to differentiate the final product and to command a commensurately high margin. By virtue of their high cost, these inputs will usually account for a relatively large share of total value added. These complex components may have their own multinational supply chains. For example, an integrated circuit might be sold by a U.S. company but fabricated by a contractor in Taiwan and encased in its final package in Korea before being shipped to a product assembly plant.
For the assembly of these components into the final product, a number of large
multinationals, such as Solectron, Foxconn, and Quanta provide assembly services. These assemblers compete fiercely for high-volume opportunities, limiting their margins.
Online, phone sales A few high-cost inputs Many low-cost inputs CM/ODM Retail sales Distributors Consumer Core technologies Manufacturing Distribution, sales Brand name vendor IP, design, marketing Materials, sub-components
Finally, at the apex of the supply chain, the lead firm contributes its market knowledge, intellectual property, system integration and cost management skills, and a brand name whose value reflects its reputation for quality, innovation, and customer service.
With the supply chain mapped, the factory price of each input needs to be estimated and compared to the factory price of its own inputs in order to calculate the value added. A product-level study, such as we are undertaking, allows us to focus on a standout success that creates or redefines a product category, such as the iPod. The result in some sense quantifies the value created by success and clarifies how it is distributed. The result, properly weighted by a probability of success, could be used as an input into an analysis of the potential outcomes of innovation efforts. The result would be of interest to managers, academics, and policy makers concerned about the value captured by
innovators.
Studies at the level of the firm or industry are generally complicated by the presence of multiple product supply chains, which may have very different characteristics. Computer companies such as HP and Dell, for example, sell a variety of products and services ranging from low-margin desktop PCs to high-margin software and services. A narrower single-product focus allows us to develop a clearer insight into the operation of specific supply chains.
Similarly, the industry level of analysis is typically complicated by the participation of companies that are widely diversified. In consumer electronics, for example, Sony is involved in everything from hardware to content, including a motion picture studio. The product level provides a more precise view of the global activities linked to a particular innovation.
Data Sources
The product-level data are extremely hard to obtain directly from electronics industry firms themselves. Lead firms jealously protect information about the pricing deals they have negotiated, and they often require the silence of their suppliers and contractors through non-disclosure agreements.
Here we describe some of the data that can be obtained from other private and public sources.
Product-level Value-Added
For many electronic products, lists of components and their factory prices are available from industry analysts. These “teardown” reports capture the composition of the product at a specific point in time. Such reports must usually be purchased but are sometimes summarized in the trade press.
A teardown report can be used to estimate a product’s value added by subtracting the input prices from the wholesale price. Many brand-name companies, such as Dell, Apple, etc., have at least some direct sales, which allow them to receive the full retail price, but this will still be accounted for separately.5
Supplier Data
For estimating the value captured by suppliers, data on value added are usually unobtainable and proxy measures must be used. In cases where the supplier is
unidentifiable or not required to report financial data, analyst estimates or other sources of industry knowledge are needed.
Firm-level information about pure value added isn’t readily available because publicly-listed companies do not generally reveal the amount of their wages for “direct labor” (workers who are involved in converting inputs to a salable product). Instead, the wage bill is hidden within “cost of goods sold” or “cost of sales.” Therefore the number we will use to estimate the value captured by suppliers is “gross profit,” also called “gross
margin,” the difference between “net sales” and “cost of goods sold.” Gross profit data are readily available from annual reports in the case of public companies. Some large firms also report gross profit for their product divisions.
Mathematically, gross profit (G) can be expressed as
G= p− i(n) n
∑
−w(d)where G, gross profit, is the difference between wholesale price and the total of the external inputs, i(n), and w(d), the wage bill of the firm’s direct labor (as opposed to the indirect labor involved in overhead activities such as research, marketing, and
administration).
Gross profit does not equal the full value added, since it excludes direct labor. Instead, it measures the value the company (excluding its direct workers) captures from its role in the value chain, which it then can use to reward shareholders (dividends), invest in future growth (R&D), cover the cost of capital depreciation, and pay its overhead expenses (marketing and administration).
In cases such as the iPod, where the company outsources all of its manufacturing, the value added calculated from the teardown report will be more or less identical to the gross profit. Differences include the cost of freight to Apple’s warehouses and the apportioned salary of Apple’s staff directly involved with overseeing iPod production. For consistency with the supplier analysis, we will refer to the wholesale-minus-inputs value as gross profit.
5
In other words, we will assume the wholesale price to retailers to be the internal transfer price to the firm’s retail operations.
Since gross profit excludes wages for direct labor, it avoids the geographical ambiguity about where a product was assembled versus where the company is headquartered. The offshore assembly aspect of value distribution needs to be captured in other ways, such as an analysis of the location, quantity, and salary of jobs.
Gross profit is the surplus that a firm could put into marketing and technology
development. We are using it in preference to net profit because the net figure reflects non-production related factors such as the firm’s leverage and its investments in other firms.
The iPod Supply Chain: a preliminary view
In order to begin our supply chain analysis, we obtained several “teardown” reports for various iPod and notebook PC models from Portelligent Inc. These reports are based on the dismantling of an actual product, and they identify suppliers where known. The reports capture a particular instance of a product’s implementation, and would miss cases where multiple suppliers are being used alternately to supply a single substitutable part, such as a memory chip.
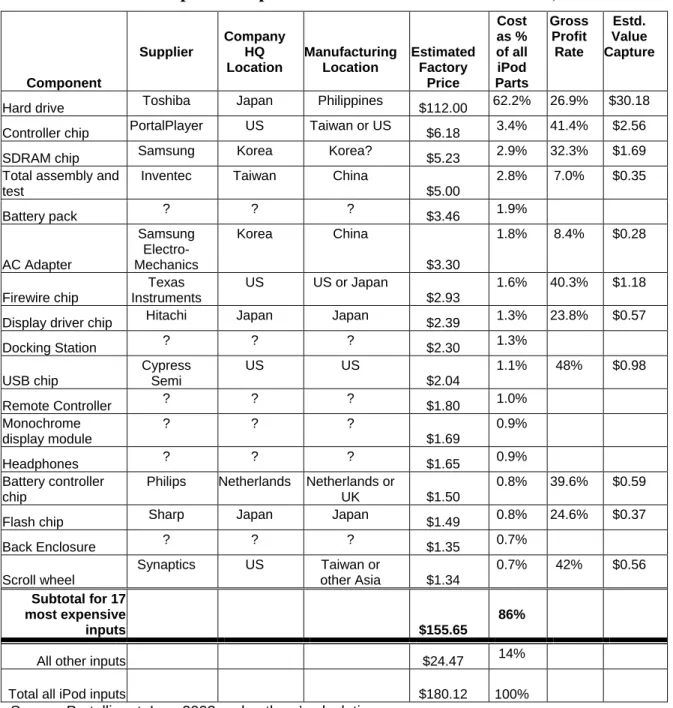
One of these Portelligent reports details the components in Apple’s third-generation iPod, which went on sale in early 2003. Table 1 shows the seventeen most costly inputs in that iPod model based on Portelligent’s estimates. The seventeen inputs in Table 1, including the cost of assembly and test, total $155.65, which is more than four-fifths of the total estimated $180.12 cost of the iPod and its accessories.
By far the largest single input is the 30GB hard drive from Toshiba, which has an estimated cost of $112, by itself more than 60% of total input cost. In order to estimate the value captured by Toshiba, we will use its gross profit. This may be inaccurate for a company like Toshiba that makes a wide range of products, from memory chips to power-generating facilities, but it can suffice for a first approximation. According to Toshiba’s income statements, the gross margin for the fiscal year ended April 2004 was 26.95% of net sales.6 As points of comparison, the gross margins for 2003 from the two top firms who produce only hard drives, Seagate and Western Digital, were 26.6% and 16.3%, respectively.7 Using Toshiba’s overall gross margin, recognizing that it is on the high side for the hard drive industry, the value captured by Toshiba and assigned to Japan from a 30GB iPod is about $30.
6
Gross profit rate calculated from data at http://www.toshiba.co.jp/about/ir/en/finance/pl.htm. 7
Calculated from data in “EB300: The Rankings”, Electronic Business, August 2004 (http://www.edn.com/article/CA438852.html?partner=eb&pubdate=8%2F1%2F2004)
Table 1. The Most Expensive Inputs in the 30GB 3rd-Generation iPod, 2003 Component Supplier Company HQ Location Manufacturing Location Estimated Factory Price Cost as % of all iPod Parts Gross Profit Rate Estd. Value Capture
Hard drive Toshiba Japan Philippines $112.00 62.2% 26.9% $30.18 Controller chip PortalPlayer US Taiwan or US $6.18 3.4% 41.4% $2.56 SDRAM chip Samsung Korea Korea? $5.23 2.9% 32.3% $1.69 Total assembly and
test
Inventec Taiwan China
$5.00 2.8% 7.0% $0.35 Battery pack ? ? ? $3.46 1.9% AC Adapter Samsung Electro-Mechanics Korea China $3.30 1.8% 8.4% $0.28 Firewire chip Texas Instruments US US or Japan $2.93 1.6% 40.3% $1.18
Display driver chip Hitachi Japan Japan $2.39 1.3% 23.8% $0.57
Docking Station ? ? ? $2.30 1.3% USB chip Cypress Semi US US $2.04 1.1% 48% $0.98 Remote Controller ? ? ? $1.80 1.0% Monochrome display module ? ? ? $1.69 0.9% Headphones ? ? ? $1.65 0.9% Battery controller chip
Philips Netherlands Netherlands or UK $1.50
0.8% 39.6% $0.59
Flash chip Sharp Japan Japan $1.49 0.8% 24.6% $0.37
Back Enclosure ? ? ? $1.35 0.7% Scroll wheel Synaptics US Taiwan or other Asia $1.34 0.7% 42% $0.56 Subtotal for 17 most expensive inputs $155.65 86%
All other inputs $24.47 14%
Total all iPod inputs $180.12 100% Source: Portelligent, Inc., 2003 and authors’ calculations
The second-most valuable input is PortalPlayer’s controller chip, which manages most of the iPod’s functions, with an estimated factory price of $6.18. PortalPlayer’s gross
margin for 2003 was 41.4%.8 This number is likely to be more accurate than the estimate for Toshiba since PortalPlayer is strictly a chip company and 84.6% of its sales in 2003 were to Inventec, Apple’s contract manufacturer for early-generation iPods.
PortalPlayer’s value captured for the iPod controller was therefore approximately $2.56.
8
A similar procedure was performed for all the other inputs in Table 1 that could be assigned to a publicly-listed company. In addition to the seventeen inputs shown, the iPod has more than 400 additional inputs valued at one dollar or less, with an average value of $0.07 each.
Of the seventeen inputs shown in Table 1, six, totaling $12.25, had no supplier markings, and this identification problem becomes more prevalent for the smaller-value items. Because Apple is particularly sensitive about its supply base, field research and other inquiries will be needed even to make educated guesses.
For many of the inputs, we need to perform additional research to verify, to the extent possible, the appropriate gross profit margin to use, since intra-firm differences across various products can be large.
For the higher-value components, we will also try to account for third-level value captured by the supplier’s suppliers, especially where these have cross-border
implications. In the case of PortalPlayer’s controller chip, its manufacturing is external and could have been done either by Taiwan Semiconductor Manufacturing Corp. (TSMC), a Taiwanese company, or LSI Logic, a U.S. company. Chip fabrication
typically accounts for about a third of the factory price of a chip, so approximately $1.85 of PortalPlayer’s cost of goods sold can be attributed to Taiwan or the U.S. TSMC’s gross margin for 2003 was 36.1%, and LSI Logic’s was 40%, so some $0.70 was
captured in this way. Moreover, PortalPlayer licenses one of the main elements of its chip design, the processor core, from a British company named ARM, which charges
anywhere from $0.35 to $2.00 per chip in royalties (lower amounts for higher-volume deals), which is almost pure gross profit and should be assigned to Great Britain.9 A similar third-level analysis needs to be conducted for the hard drive, which contains a number of external inputs, including chips, disks, motor, and head assembly.
At the other end of the supply chain, the retail price for the 30-gigabyte (GB) model at the time of Portelligent’s analysis was $399. The difference of $218.88 can be further decomposed for units sold through non-Apple channels. We estimate a 25% wholesale discount for such units, with 10% for distribution and 15% for retail.10 Based on these values, Apple’s gross profit on those units would be $119, which is 40% of the $299 estimated wholesale price.11 This $119 profit is greater than the price of any single input, so it is definitely greater than the value added for any of its partners. And for sales through Apple’s own web or store outlets, it retains an even larger share.
9
Royalty rate estimate from Jim Turley, “Embedded Processors, Part One,” January 11, 2002, http://www.extremetech.com/print_article/0,3998,a=21014,00.asp
10
A gross profit margin of “less than 15 percent” for non-Apple sales is claimed in Damon Darlin, “The iPod Ecosystem,” New York Times, February 3, 2006, so Apple’s wholesale discount would need to be at least this large. The distribution estimate is from an industry interview.
11
75% of $399 is $299.25, the wholesale price received by Apple; subtracting the $180.12 input cost leaves $119.13, which is 39.8% of $299.25.
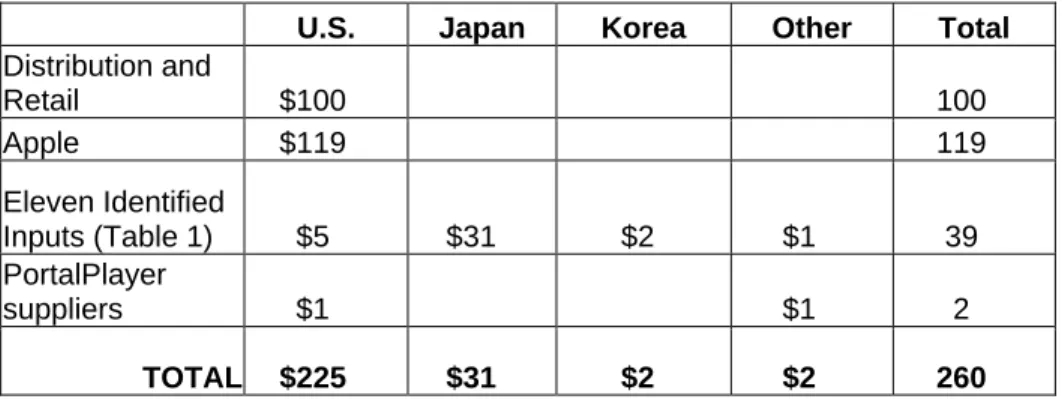
The following table summarizes the preceding analysis of the 30GB third-generation iPod. It assumes the unit is sold through a retail outlet in the U.S. with a gross margin of 20% for the retailer.
Table 2. The Geography of $260 of the Captured Value in a single 30GB 3rd-Generation iPod sold in the U.S. (preliminary)
U.S. Japan Korea Other Total
Distribution and Retail $100 100 Apple $119 119 Eleven Identified Inputs (Table 1) $5 $31 $2 $1 39 PortalPlayer suppliers $1 $1 2 TOTAL $225 $31 $2 $2 260
Note: For this table it is assumed that the unit is sold in the U.S. Source: Authors’ calculations
Numerous inputs remain to be evaluated. They are mostly small in value, with a total cost of $36.72 out of the total input bill of $180.12. Even if the as-yet-unanalyzed inputs have a 50% gross margin, which is unlikely, the most all these could add to any region is $18 (i.e. half of $36).
Some share of the $81.82 “cost of sales” of the Toshiba hard drive will later be added to the table, most likely in the Japan column, following an analysis of Toshiba’s suppliers and their margins.
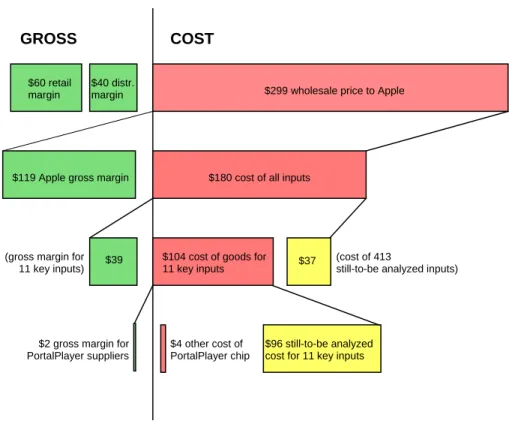
Figure 2 provides a reconciliation of the analysis so far, back to the retail price of $399. The heavily outlined boxes correspond to the values reported in Table 2.
Figure 2. Breakdown of iPod Retail Price Based on Analysis So Far
Source: Authors’ estimates; see text.
The dominance of Apple’s gross margin suggests that in this particular iPod model, the U.S. captures most of the value when the product is sold in the U.S. In the case of retail units sold in other countries, a significant portion of the U.S. share would shift elsewhere. For a unit in Japan, the total value captured by Japanese companies might even be larger than the U.S. share (including retail, wholesale and inputs).
However it must be recalled that the gross margins for inputs in the third row of Figure 2 exclude direct labor, which is part of the $104 cost of goods. Direct labor, most of which will be outside the U.S., would be included in an ideal value added analysis but will not be accounted for in the current phase of the study because of data availability problems.12 The location of direct labor differs from headquarters location for most electronics firms. Taiwanese contract manufacturers, for instance, have moved the bulk of their factories to mainland China over the last decade, retaining some high-end manufacturing in Taiwan and a few assembly factories in other low-cost regions such as Eastern Europe. In the case of the iPod’s hard drive, these are assembled by Toshiba in the Philippines, but assembly is a small share of the total value of a hard drive.
12
These wage and worker issues are planned as a subject of future research.
$60 retail margin
$40 distr. margin
$119 Apple gross margin
$2 gross margin for PortalPlayer suppliers (gross margin for
11 key inputs)
$299 wholesale price to Apple
$180 cost of all inputs Retail
Price $399
COST
$104 cost of goods for 11 key inputs
(cost of 413
still-to-be analyzed inputs)
$4 other cost of PortalPlayer chip
$96 still-to-be analyzed cost for 11 key inputs GROSS Wholesale Price $299 Cost of Inputs $180 Cost of sales for 11 key inputs $102 $37 $39
Possible Extensions
This section explores some of the possible extensions for deepening this value analysis. These include the dynamic pricing of inputs, value captured by complementary products and services, the impact on rival firms, and consumer surplus.
Dynamics
The methodology described so far provides a static snapshot of the internal economics of a supply chain. In the electronics industry, the variables in the calculation change rapidly. One source of change is regular price negotiation. Prices for key inputs are usually
renegotiated quarterly and, in some fast-moving markets, will be renegotiated monthly. Another source of dynamic changes in value added is change in the final product’s component set. Many components in a system can be substituted without a major redesign if another supplier offers a better deal or better technical features. Because of this possibility, lead firms have considerable leverage to demand regular price reductions from their suppliers. Many lead firms will even source each component from multiple suppliers, both as a hedge against supply disruptions and to make explicit the potential for exclusion.
Changes in components or their prices may or may not be reflected in the final product’s price. Product marketers like Apple often anticipate steady price reductions in their inputs and engage in “forward pricing,” i.e. they set a sales price that may initially bring them a narrow profit margin that will grow over time as component costs decline. This strategy reduces the likelihood of pricing mistakes such as introducing a product at a high price relative to an unforeseen competitor’s product.
In some cases, component prices may be volatile. This is the case for memory chips, a portion of which are sold on a spot market. Lead firms often enter into long-term
contracts with specific suppliers to hedge against component price fluctuation. Apple, for example, entered long-term contracts with five flash memory suppliers in late 2005 when it introduced the flash-based iPod Nano.13
Our current study takes a snapshot approach, assessing the distribution of value added at a single point in time near each product’s introduction. A multi-period time series would require estimates of the rates of change of the various component prices over the relevant period. Knowledge about any substitution among components between product
generations would also be needed, which requires access to sensitive internal data from the firm whose product is being studied.
The hard drive in the iPod provides an example of a different type of component substitution. 30GB is only one of the capacities that were available in the iPod’s third generation. Apple offered configurations of the otherwise-identical iPod with hard drives
13
“Apple Announces Long-Term Supply Agreements for Flash Memory,” Apple Press Release, November 21, 2005.
ranging from 10GB to 40GB, so the share of the hard drive in the cost of iPod inputs would have varied across models. An analysis of the other capacities that were available at the same time is possible, but it would be difficult to obtain the necessary sales data to know what percentages to use in order to aggregate them in accounting for the entire output of that generation of iPod.
Complementary Products and Services
Many electronics products are used not in isolation but with other products, leading to a mutual enhancement of value. The computer is a classic example, with add-on items including graphics cards, extra hard drives, printers, carrying cases, and, most
importantly, software. The iPod is another example, with add-ons that include speaker systems, head phones and fashionable cases. Moreover, the iPod rapidly transformed from a computer peripheral allowing users to transfer songs from a PC to a multimedia terminal supporting a whole ecosystem of downloadable songs, audio books, and videos at the iTunes Music Store and other sources.
Other services could be considered in the value equation but are often excluded. For example, intermediaries such as logistics companies, shippers, and resellers, are needed to move electronics goods from factories to consumers.
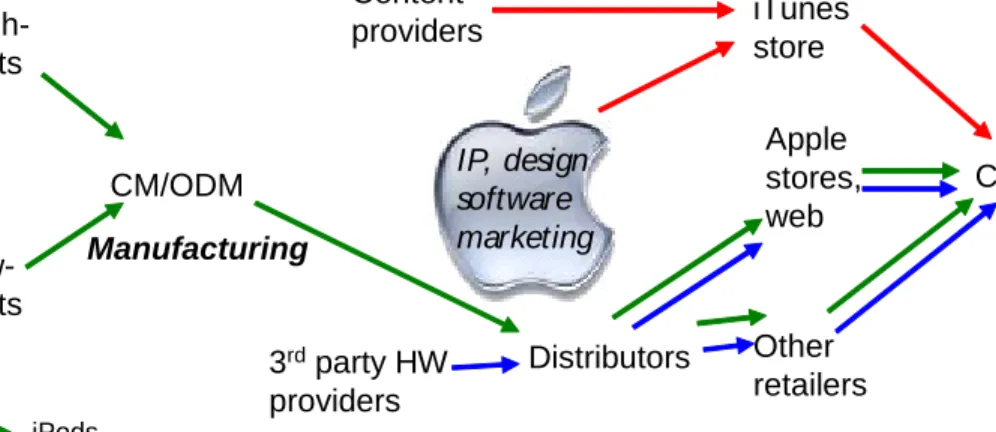
Figure 3 extends the generic supply chain of Figure 1 with some of these extra elements with reference to the iPod value chain. Each extension of course raises additional problems of data collection.
Figure 3. Extended Supply Chain for Apple iPod
iTunes store A few high-cost inputs Many low-cost inputs CM/ODM Content providers 3rdparty HW providers Apple stores, web Other retailers Distributors Consumer iPods Accessories
Software and content
Core technology IP, design software marketing Manufacturing Sales, distribution
In the case of complementary products and services, such as the iTunes Music store, estimates of gross margin can be obtained from industry analysts or interviews. If the complementary product or service is relevant to multiple products rather than the single product under discussion, then a formula needs to be devised for apportioning a share to the product being analyzed.
Value Subtracted
Most electronics products, such as computers, are added to existing markets. Apple’s iPod, for example, was introduced two or three years after portable digital music players from other companies had already appeared. It also replaced some of the market for products such as portable CD players.
A successful new product takes some sales away from competing products that were already on the market, but it may also enlarge the overall market. Eventually, it may also create market opportunities for low-cost competitors.
Some of these external value transfers would be captured automatically in an industry-level analysis. They would need to be added to a firm-industry-level analysis (Mansfield et al., 1977), and such an extension would be impractical at the product level of the present study.
Beyond Value Added
From a policy standpoint, value added is only one aspect of the value created by a successful product. Although the following elements are beyond the scope of the present study, they are worth keeping in mind.
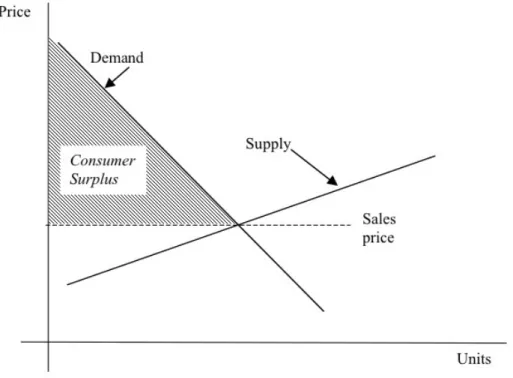
One such element is the economic benefit to consumers from the fact that their willingness to pay, captured by a demand curve, exceeds the market price. This differential is known as consumer surplus (see Figure 4).
Because the market for consumer electronics products is fiercely competitive, prices tend to be relatively close to costs, creating a large consumer surplus. Moreover, this surplus occurs in all markets where the good is sold, creating additional issues of geographical distribution.
Another possible consideration that extends beyond value added analysis is the distribution of profits as dividends. These payouts may spread the value to still more countries depending on firms’ patterns of stock ownership. For example, a recent report on Taiwanese CMs and ODMs indicated that their stock is more than 50% owned by foreign investors (Shen, 2007).14
14
The ratio of foreign investor's stakes were reported as follows according to information at the Taiwan Stock Exchange: TSMC (Taiwan Semiconductor Manufacturing Company) 71.84%, Wistron 62.48%, Lite-On Technology 59.50, Foxconn Electronics (Hon Hai Precision Industry) 59.18, and MediaTek 51.47.
Figure 4. Consumer Surplus
Conclusion
Value distribution analysis requires data, detective work, and industry knowledge. The result is a noisy approximation of the true underlying values, but it will be sufficiently accurate to shed light on questions of policy, such as how much the benefits of innovation in the electronics sector accrue to the home country now that most products are
manufactured in low-cost regions. It will also shed light on the extent to which the lead firm captures value from its innovation, i.e., whether innovation pays off for the lead firm.
The research may also be useful for answering deeper, qualitative questions, such as how much freedom of choice the lead firm has in choosing the members of its supply chain, and whether certain key choices, such as the Toshiba hard drive or the PortalPlayer chip in the iPod, might necessitate other upstream or downstream choices.
References
Gourevitch, Peter; Roger Bohn, and David McKendrick.(1997) Who Is Us? The
Nationality of Production in the Hard Disk Drive Industry. Information Storage Industry Center Report 97-01. Accessible at http://isic.ucsd.edu/whoisus.html
Kaplinsky, Raphael and Morris, Mike (2001) A Handbook for Value Chain Research. http://www.ids.ac.uk/ids/global/pdfs/VchNov01.pdf
Mansfield, Edwin, John Rapoport, Anthony Romero, Samuel Wagner, and George Beardsley (1977) “Social and Private Rates of Return from Industrial Innovations,” Quarterly Journal of Economics, 91(2): 221-240.
Portelligent Inc. (2003). Apple iPod 30GB (Model #A1040) Digital Music Player - Report #152-031110-1c. Austin, TX: Portelligent Inc.
Shen, Steve (2007). Citigroup acquires 70 million shares of Wistron released by Acer Group, Digitimes, April 3.
Sturgeon, Timothy J. (2002). ‘Modular Production Networks: A New American Model of Industrial Organization’.Industrial and Corporate Change11(3): 451–96.
Williamson, Oliver E. (1985) The Economic Institutions of Capitalism. New York: Free Press.