Pharmacy Undergraduate
Students: Career Choices &
Expectations Across A
Four-Year Degree Programme
Keith Wilson, Jill Jesson, Chris Langley, Katie Hatfield and
Laura Clarke.
The research on which this report is based was commissioned by the Pharmacy Practice Research Trust funded with a grant from the Royal Pharmaceutical Society of Great Britain. The research was undertaken by a team of researchers at Aston University. The views expressed in the report are those of the authors and not necessarily the commissioning body.
Published by the Royal Pharmaceutical Society of Great Britain 1 Lambeth High Street, London SE1 7JN
First Published 2006
© Royal Pharmaceutical Society of Great Britain 2006
Printed in Great Britain by the Royal Pharmaceutical Society of Great Britain ISBN: 0-9550029-5-8
All rights reserved. No part of this publication may be reproduced, stored in a retrieval system or transmitted in any form or by any means, without prior written permission of the copyright holder.
The publisher makes no representation, express or limited, with regard to the accuracy of the information contained in this book and cannot accept any legal responsibility or liability for any errors or omissions that may be made.
CONTENTS
1. SUMMARY... 1
1.1 Context of the Study... 1
1.2 UCAS Data Analysis ... 1
1.3 Survey ... 1
1.3.1 Motivations and Influences... 1
1.3.2 Choice of School of Pharmacy ... 2
1.3.3 Career Image ... 2
1.3.4 Future Career Ambitions ... 3
1.3.5 Work Life Balances ... 4
1.3.6 Influences of the School of Pharmacy (final year students only)... 4
1.4 Conclusions... 5
2. INTRODUCTION... 7
2.1 The Study... 7
2.2 Design of the Study and Summary of the Literature ... 7
2.2.1 Career Choice ... 8
2.2.2 Rational Choice Theory... 8
2.2.3 Human Capital Theory ... 8
2.2.4 Bounded Rationality ... 9
2.2.5 Preference Theory ... 9
2.2.6 Motivation ... 9
2.2.7 ‘High Flyers and Life Style’ Work-Life Balance Theory ... 10
2.2.8 Summary……….10
2.3 A Conceptual Framework for the Study ... 11
3. METHODS ... 13
3.1 Analysis of UCAS Student Data ... 13
3.2 The Survey ... 14
3.2.1 Survey Design and Core Questions ... 14
3.2.2 Fourth Year Supplement ... 14
3.2.3 Administration of the Questionnaire ... 15
3.2.4 Response Rate ... 15
3.2.5 Profile of Respondents... 16
3.2.6 Analysis... 18
3.2.7 Ethical Approval ... 18
3.2.8 Report Presentation ... 18
4.1 General Applicant Data ... 19
4.2 Gender ... 19
4.3 Age... 20
4.4 Ethnicity... 21
4.5 Socio-economic Background ... 22
4.6 Summary of Key Findings. ... 24
5. SURVEY OF MPHARM STUDENTS ... 25
5.1 Motivations and Influences... 25
5.1.1 Education Related Influences ... 25
5.1.2 Personal Influences... 26
5.1.3 The Influence of Personal career goals on Career Choice ... 28
5.1.4 Summary of key findings ... 29
5.2 Choice of School of Pharmacy ... 30
5.2.1 Commitment to Pharmacy as a Course ... 30
5.2.2 Route of Entry to the Pharmacy Course ... 31
5.2.3 Choice of School of Pharmacy ... 32
5.2.4 Desire to Study Pharmacy ... 34
5.2.5 Summary of Key Findings ... 34
5.3 Career Image ... 35
5.3.1 Commitment to Pharmacy as a Career ... 35
5.3.2 Attitudes about Pharmacy as a Career ... 36
5.3.3 Summary of key findings. ... 38
5.4 Perceptions of Pharmacy and Pharmacists ... 38
5.4.1 Perceptions of the views of Friends and Family... 38
5.4.2 External Perceptions of the Status of Pharmacy... 40
5.4.3 Summary of Key Findings. ... 41
5.5 Future Career Ambitions ... 42
5.5.1 Career Intentions - Preregistration Training ... 42
5.5.2 Career Intentions - First Post after Preregistration... 43
5.5.3 Career Intentions - Five Years after Qualifying ... 45
5.5.4 Salary Expectations ... 46
5.5.5 Summary of key findings ... 47
5.6 Work Life Balance ... 48
5.6.1 Plans for Future Working Life... 48
5.6.2 Career Ambition - Highest Career Level ... 49
5.6.3 Planned Hours of Work ... 50
5.7 Influence of Undergraduate Experience upon Career Choice ... 52
5.7.1 Changes in Career Choice during the Degree ... 52
5.7.2 Influence of School of Pharmacy on Career Choice ... 53
5.7.3 Influence of Students’ Experience of Pharmacy on Career Choice ... 54
5.7.4 Influences of the Profession of Pharmacy on Career Choice... 55
5.7.5 Perception of Working as a Pharmacist in Community ... 57
5.7.6 Perception of Working as a Pharmacist in Hospital ... 57
5.7.7 Views of Community and Hospital Compared... 58
5.7.8 Importance of career factors ... 59
5.7.9 Discontinuation of Studies... 61
5.7.10 Summary of Key Findings. ... 61
6. Discussion ... 63
6.1 The Decision to Study Pharmacy ... 63
6.2 Choice of School of Pharmacy ... 64
6.3 Image of Pharmacy as a Career ... 65
6.4 Future Career Ambitions ... 65
6.5 Work Life Balance ... 66
6.6 Influences of the School of Pharmacy... 67
6.7 Limitations of the Survey ... 68
6.8 Conclusions... 69
6.9 Further work ... 70
7. References ... 71
1. SUMMARY
1.1
Context of the Study
1. This study was funded by the Pharmacy Practice Research Trust and carried out in 2004/2005. The aim was to establish a baseline understanding of the career aspirations, motivations and expectations of students within undergraduate pharmacy education in the UK.
2. The study consisted of a review of statistics on pharmacy entry in the UK from the Universities and Colleges Admissions Service (UCAS) and a survey of all students on the first and final years of UK pharmacy degree programmes by self-completion questionnaire.
3. 1,163 completed questionnaires were received from a sample of 3,306 first and final year students in 13 schools of pharmacy: a return rate of 35.2%.
1.2
UCAS Data Analysis
1. Over the period 1998 to 2003, increases in intake to schools of pharmacy were made from a static applicant pool. There is evidence of saturation of the core applicant pool with intakes over this time becoming critically dependent upon clearing: the UCAS application process for pharmacy was moving from selection to recruitment. This has implications for the quality of the intake, for future attrition and for academic standards within the pharmacy sector.
2. The majority of applicants for pharmacy were female, the percentage of female applicants has risen consistently since 1998. A similar trend applies to medicine. 3. The majority of applications for pharmacy were from the 18-19 year group with less
than 10% over the age of 25.
4. Total applications from Asian students (average 47% of pool) exceeded those from white students (average 40% of the pool). Applications from white males have declined consistently to around 12% of the total pool and applications from white females have been in decline since 2000.
5. The undergraduate profile showed that pharmacy recruits from a diverse population, however, the number of black students was very small. Approximately 40% were drawn from the semi-skilled and manual classes, compared to medicine at 23%.
1.3 Survey
1.3.1 Motivations and Influences
1. This study tested all the previously used motivation statements to produce a benchmark showing the relative importance students attach to each one. Employment opportunities were perceived to be the most important extrinsic influencer. A number of intrinsic influencers were also important and these fell into two groups – like of and aptitude for science and personal aspirations for a good career.
2. The three most important educational influences upon the decision to study pharmacy were university prospectuses, university open days and careers leaflets or
booklets. The three most important personal influences upon the decision to study pharmacy were pharmacy work experience, parents and family. Career linked influences were seen as more important than either educational or personal influences. The professional body for pharmacy, the Royal Pharmaceutical Society of Great Britain (RPSGB) was not seen as influential.
3. The reasons considered most important to study pharmacy were objective ones that related to self-interest, both in terms of the nature of the degree course and the advantages conferred by the degree. However, for female students, choice was bounded by employment characteristics.
1.3.2 Choice of School of Pharmacy
1. 72% of all students stated that pharmacy was their first and only choice of subject when they applied for university. There were no differences with gender or year of study. The proportion of Asian students for which pharmacy was the first choice was significantly less than for white students.
2. Students who had studied pharmacy as a second choice had originally wanted to study medicine. More Asian than white students named medicine and dentistry as subjects of first choice. More white students named science and wanting to work in health.
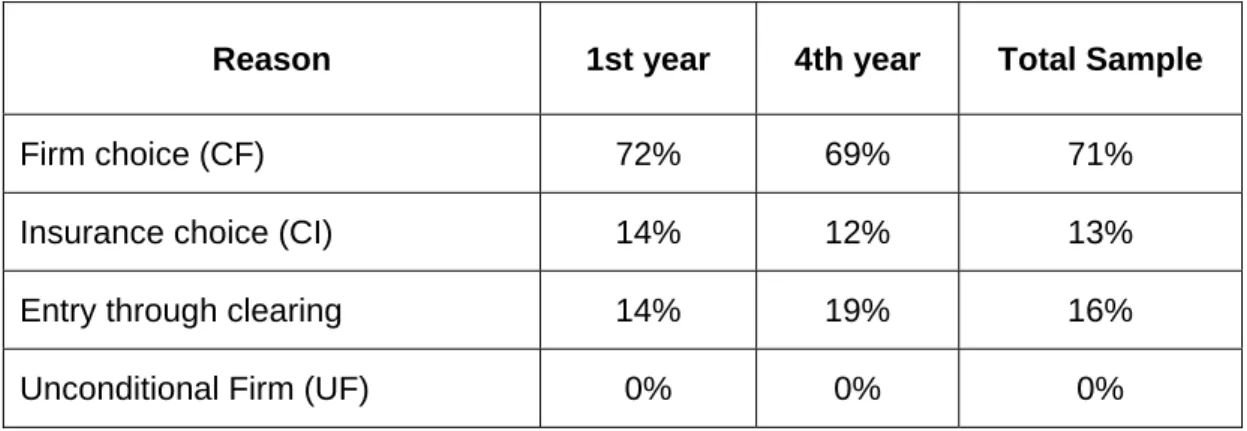
3. 71% of all students entered their school of pharmacy through the standard UCAS procedure after holding a firm conditional offer of a place (CF). A further 16% entered through the UCAS clearing scheme. Fewer Asian students entered through the normal system and more entered through clearing.
4. For all students, the most important influences upon selection of school of pharmacy were the extrinsic factors of reputation of the school, reputation of the university and the nature of the course described in the prospectus. While there were differences in importance linked to gender and to ethnicity, these did not influence those factors considered most important.
5. Female students were more influenced by the nature of the course as described in the prospectus, by the reputation of the university and by the location of the university in relation to their home. Male students were more influenced by friends at the school and family at the university.
6. Asian students were more influenced by the reputation of the school and the university facilities but less by open days. They were also more influenced by personal recommendation, by friends at the school, by parents and by family in the university.
7. 57% of students stated that their desire to study pharmacy was very strong at the time of entering their course. A smaller proportion of Asian students than white had a strong desire to study pharmacy.
1.3.3 Career
Image
1. The majority of students were proud to be studying pharmacy and committed to the values and ideals of the profession. There were no differences between females and males or Asians and white students.
2. About 5% of students regretted entering pharmacy.
3. Students were generally positive about pharmacy as a future career and satisfied with their decision to choose it as a subject to study and as a career. Females were significantly more positive than males and Asian students were less positive than white students. The reasons for the gender and ethnicity difference require further research.
4. Final year students were asked to consider how their family and friends thought about pharmacy. Over 90% perceived that their family and friends would consider pharmacy to be a well paid job and to offer guaranteed employment, yet 37% stated that it offered few opportunities for promotion and career development. There was no significant difference between responses of male and female students. Responses of Asian students were significantly different from those of white students in relation to the lack of opportunities for promotion and career development and pharmacy as a secondary profession to medicine.
1.3.4 Future Career Ambitions
1. Choosing their career destination was bounded by a lack of knowledge, shown especially by the high interest in pharmacy ownership possibilities. The study showed later that socialisation into pharmacy over four years with course material, contact with teachers and work experience or practice placements helped students to make a more realistic decision.
2. Preregistration Destination. Multiple community pharmacy was the first choice sector for both first (25%) and final year (41%) students. Only 5% of final year students compared with 20% of first year students were not sure of their preregistration destination. More females were interested in hospital posts and more males than females in community posts. More Asian students than white students were interested in community careers and less in hospital.
3. First Post after Preregistration. Multiple community pharmacy, NHS hospital pharmacy, community independent pharmacy and locum pharmacy were the most popular career areas for both first and final year students for the first post after preregistration training. Significantly more females than males would consider posts in an NHS hospital and in an NHS Primary Care Trust. Significantly more Asians than white students would consider a post in multiple community pharmacy and significantly more white students would consider a post in hospital pharmacy.
4. Between a third (first year) and a half of students (final year) would consider locum employment.
5. Five Years after Qualification. 40% or more of first and final year students expected to be working in the same sector as their preregistration experience five years after qualifying as a pharmacist. Over 20% expected to be working as self-employed, abroad, as a locum or as an employee. A small proportion of students (less than 5%) expected to be working outside pharmacy.
6. Significantly more females than males expected to be taking time out with their family or to be working on a temporary basis while significantly less expected to be employed. Significantly more Asian students than white students expected to be self-employed or to be working as a locum and significantly less expected to be working in the same sector as their preregistration placement or to be an employee.
7. Between a quarter and a third expected to be working as a locum.
1.3.5 Work
Life
Balances
1. It is in exploring work life balance that the differences between male and female students were at their most noticeable. The most obvious difference was in the proportion of students intending to take a career break for family reasons (three to four times as many females as males) and intention to work full time until retirement age (twice as many males as females).
2. The option of working full time until retirement was no longer the accepted pattern for future work - it was anticipated by only about half of the males and a quarter of the females.
3. One third of all respondents intended to work as a locum. More males than females wanted to be self employed.
4. Students were asked to select their three top ambitions. The four most popular responses were the same for first and final year students: owner of a community pharmacy, manager of a community pharmacy, chief pharmacist and hospital pharmacy manager. The option ‘employee in community pharmacy’ was selected by only 12% of final year students and 8% of first year students. More female students selected hospital pharmacist, hospital pharmacy manager and practice/PCT pharmacist and more males selected owner of a community pharmacy. More Asian students than white students selected community pharmacy roles, significantly less selected work in a PCT pharmacy, hospital pharmacy manager or hospital pharmacy and academic pharmacy.
5. Ownership of a community pharmacy was the most commonly selected “top career ambition”. This represents a serious mismatch in personal ambition and reality that could create future workforce dissatisfaction. There is a need for further study to understand why this is perceived as attractive in the pharmacy context.
6. Asian ambitions are more focused on self employment than for white students although both white and Asian males were more focussed on this outcome than were females.
7. Although the pattern of full time work to retirement is no longer a majority aim, most students did expect to work in full time mode when qualified. Male students anticipated a longer working week than female students.
1.3.6 Influences of the School of Pharmacy (final year students only)
1. Before they entered pharmacy school, around two thirds of students had a definite idea as to the area of the pharmacy profession that they wanted to work in. For the majority it was community pharmacy.
2. Around one third of the students who started with a definite idea of their career area changed their mind during the course. The largest change was in those who had originally wanted to work in industry.
3. In relation to the pharmacy degree course, the two factors that most influenced career choice were course content and hospital visit/hospital teaching. This demonstrates the capacity for work-placed learning to influence career choice.
4. The least influential features of the degree course upon career choice were the final year project and fellow students’ career choices.
5. When asked about the influence of experience of pharmacy upon career choice, weekend or vacation experience in community pharmacy was the most influential factor followed by contact with pharmacists and weekend or vacation experience in hospital pharmacy. The difference between experience in community and hospital may reflect access since hospital experience is more difficult to achieve.
6. For the majority of students, student debt did not influence career choice.
7. Other factors external to the pharmacy course had little influence. These included preregistration recruitment fairs and company recruitment material, the Pharmaceutical Journal or attendance at pharmacy related meetings such as the British Pharmaceutical Students Association (BPSA) or local branch. The preregistration presentation by the RPSGB was also considered to be of little influence.
8. Just less than one quarter of respondents had considered changing their course or leaving their studies at least once and the most common reason was mistaken choice of course. Less than 2% attributed this to student debt. This finding suggests a need for further national research in attrition and drop out patterns.
9. These findings show that experience during the academic course has a major influence upon final career choice destination. Work experience, placements and personal interactions with other pharmacists including pharmacy practice teachers were of most significance.
10. The nature of the course can therefore have major impact upon the ambitions and expectations of students. This study provides evidence that the most significant factor is contact with practice during the undergraduate years. This finding has major implications for pharmacy since, at present, arrangements for practice placements in the undergraduate degree are ad hoc with no national funding1.
1.4 Conclusions
1. This study has consolidated all the previous knowledge on motivation for pharmacy as a career and choice of school of pharmacy. Both decisions emerge as highly rational based upon a mix of extrinsic factors, most notably employment and financial reward, and intrinsic factors such as academic preferences and personal career goals.
2. The study has shown significant differences in attitudes between male and female students, but the most unexpected and striking difference was the difference between white and Asian students. Whilst many of the gender differences are already known, such as a preference for hospital pharmacy and the opportunity for part time employment, the same cannot be said of ethnicity. With one or two notable exceptions, there has been very little research undertaken on the ethnicity differences of pharmacists.
3. The study has raised a number of questions about the career image of pharmacy and about career opportunities in pharmacy. The most positive perceptions linked to job opportunity and financial reward with realistic assessments of work conditions such as long working hours and questions about the potential for career advancement.
4. There was evidence of a mismatch between students’ ambitions and reality - particularly in the area of business ownership and independent working. There was also a strong indication that students no longer subscribed to the typical career path of lifelong working for an employer until retirement. These findings are of significance given the current movement of pharmacy towards an employee profession. Further research is indicated to develop our understanding in this area and in particular to explore what it is about business ownership that is attractive.
5. The schools of pharmacy emerge as major influencers of students’ choice and ambition both in the application process prior to joining a pharmacy degree and in terms of career ambitions during the degree. Contact with pharmacy and degree placement studies were of major impact and this provides further evidence of the importance of developing a national strategy for work placed learning in the pharmacy degree.
6. The professional body, its publications and related activities emerged as a very weak influence upon students both in their decision to study pharmacy and in their career choices during study. The RPSGB does not really make direct contact, and therefore relevance, until the trainee at preregistration level applies to be registered. This is a missed relationship opportunity to bring all students studying pharmacy into the ‘pharmacy family’ and has important implications for the ability of the RPSGB to influence the workforce supply.
2. INTRODUCTION
2.1 The
Study
This is a time of change in healthcare economies. In the NHS, structural changes provide new career opportunities for hospital pharmacists. In primary care, modernisation and the realisation of some of pharmacy’s professional ambitions – such as repeat dispensing and medicines use review – have been acknowledged through the new pharmacy contract.2 In the community pharmacy market, major changes in pharmacy ownership, away from independent pharmacy towards multiple corporate owners, is changing the possibilities for owning a small business in pharmacy. This trend has implications for students in this study who expressed an intention to be a pharmacy owner.
The Pharmacy Practice Research Division commissioned a programme of workforce research as part of its strategy 2001-6. A Workforce Research Forum and a Workforce Advisory Group informed the debate. Consequently the first pharmacy register census was undertaken in 20023 and repeated in 20034. Two projects were commissioned in 2003. There is a longitudinal cohort study, which intends to track preregistration students for five years following their career progress. The second study, described here, is a study of undergraduates within the schools of pharmacy.
The aim of the Pharmacy Undergraduate Students: Career Choices and Expectations Across a Four Year Degree Programme was to provide a substantial contribution to understanding the career aspirations, motivations and expectations of students within undergraduate pharmacy education in the UK at the beginning of the twenty-first century and to provide a foundation for further research on student aspirations and perceptions of pharmacy as a profession.
There have been relatively few studies of the factors that influence UK students to enter pharmacy or of applicants’ perceptions of the profession. All the published data relates to views obtained after the point of decision to apply rather than of the views of the general student body at the time of application. Later in this section, we present a brief summary review of the literature. This study has incorporated all the elements of earlier research to provide a picture of why students choose pharmacy, what attracts them and where they see their career going. As part of the overall study, we have also conducted a series of focus groups with year 12 students in schools and colleges to determine their perceptions of pharmacy as a career. The findings from this sub-study have been presented to the RPSGB in a separate report5.
The project was designed to provide a quantitative picture of the general factors that influence student choice and the current importance of those factors that appeared important in the past. The key areas that appeared important were:
• motivating factors to study pharmacy;
• perceptions of the profession and their origin;
• views of career development within the profession; and
• attitudes to key aspects of the profession such as healthcare work, business and management and developing clinical roles.
2.2
Design of the Study and Summary of the Literature
In this section we set out the conceptual definitions and theoretical underpinning of the study, linking in to the literature. We begin by considering what the concept ‘choice’ actually
means, followed by a consideration of major theoretical approaches to understanding, leading up to the conceptual map.
2.2.1 Career
Choice
There are a range of uses of the concept ‘choice’6:
• An act – of choosing or selecting.
• The opportunity or power of choosing.
• An alternative action or possibility.
• A supply from which to select.
Of the many psychological theories used in career studies, we focused on two well known - rational choice theory and human capital theory. However, we propose that rational choice is bounded by social circumstances, conditions and events. We have also considered two other theories, preference theory and work-lifestyle balance (theory) which may inform our understanding of people actually in the labour market, but which may form dimensions of the bounded nature of rational choice. This leads to an exploration of the notions of career and motivation and finally there is some consideration of what this means for the research design.
2.2.2 Rational Choice Theory
The term rational is widely used in relation to career choice. Rational can be defined as6: Using reason or logic in thinking out a problem or endowed with the capacity to reason – hence ‘man is a rational being’.
In relation to careers, the theory of rational choice states that when faced with several courses of action, people usually do what they believe will have the best overall outcome for themselves7. Rational choice theory is the theory most commonly used in studying career choices and motivation, particularly in those choices made at age 168. These definitions of choice suggest a purposive act, an act based in traditional economic thought as a rational act. The rational choice theory makes assumptions about the decision maker, that they are rational, motivated by self interest and calculating. The decision is oriented towards choosing the option with the highest utility; that the choice is made on perfect information; that the chooser understands the likely consequences of the decision.
2.2.3 Human Capital Theory
One dimension of rational choice is Becker’s human capital theory, based on economic principles and applied amongst other social phenomena to education7. When asking ‘why do people pursue further education?’ he concluded that variations in education patterns between social groups vary with the rewards that can be obtained. Human capital theory assumes a process of rational choice, based upon rational man theory, to acquire resources. “Human capital refers to the resources, qualities (including personality traits) skills and knowledge that are either available to or acquired by an individual to maximise their own employability“7. However, rational choice theory and human capital theory when applied to career making decisions by an undergraduate at a school of pharmacy may fail to recognise the complex, interactional, intellectual and situational processes that are also involved.
2.2.4 Bounded
Rationality
In real life undergraduate career choices are bounded by many other actors and influences – hence the notion of bounded rationality9. Bounded rationality allows us to take into account the complexities of the undergraduate world, recognising context, culture and the labour market as key influences. Simon9 acknowledges three similarities to rational choice theory:
• both theories distinguish the individual as the basic actor in society;
• both view self interest as the main motivating force behind choices; and
• both involve a conscious choice.
And six departures from rational choice theory:
• the actor has limited computational abilities;
• they have uncertain and limited information (imperfect knowledge);
• they search for alternative consequences and other information selectively;
• it stresses the cognitive component of the actor in producing behaviour goals and conceptions oriented to the world;
• process not outcome is emphasised; and
• it uses the concept of satisfying as opposed to optimisation.
Bounded rationality recognises the uncertainty of the environments in which the individual operates, meaning that the individual depends on habits, routines, and institutions to provide regularity to their environment. When thinking of school leavers most occupational decisions are made in a ‘dependent’ style. The influence of friends and family take precedence so the school leaver can effectively allow others to make the choice.
2.2.5 Preference
Theory
Hakim’s preference theory offers an explanation for the position of women in the labour market10. She argues that the main determinant of women’s heterogeneous employment patterns and work histories is their ‘preferences’ for family work and paid employment. She argues that careers are not centrally important for the greater majority of women. There are substantial theoretical and empirical criticisms of Hakim’s theory which we do not intend to pursue here. Nevertheless it could be useful in explaining why the majority of primary care pharmacists are women, where a mixture of balancing employment and family responsibility is possible. So, although rational choice theory is based on rational man, it is possible that the rational choices that women make are ‘bounded’ by their social and family preferences and the constraints which they bring.
2.2.6 Motivation
We use the concept motivation as ‘the reason for a certain course of action, whether conscious or unconscious’. Other11 useful alternatives to the concept of motivation are: ambition, desire, drive, interest.
A small number of studies have measured the motivational drivers which influence the choice of pharmacy as a profession at different stages in the preregistration phases. Booth et al12 sought to determine the motivation of applicants for places in a school of pharmacy, looking at factors influencing choice such as: sources of influence, school characteristics, and other career alternatives. Similarly Rees with first year undergraduate students in a different school of pharmacy.13 Other authors have measured the comparative influence of extrinsic and intrinsic motivators behind choice of university course in medicine14 and in Australia, of pharmacy15. Extrinsic factors are those associated with work conditions and
rewards such as: income and status, the potential for self employment or part time work. The intrinsic factors are: liking science, liking people, intellectual satisfaction, being socially useful. Roller’s research in Australia shows that the intrinsic factors tended to score consistently and significantly higher than the extrinsic factors over five years. The only UK study to cover undergraduate choices at the preregistration stage used a mixture of extrinsic and intrinsic factors16.
2.2.7 ‘High Flyers and Life Style’ Work-Life Balance Theory
The definition of a career is ‘a profession or occupation chosen as one’s life’s work’. So we need to explore to what extent undergraduates consider they are taking on a ‘career’. Most published pharmacy studies use the concept of ‘pharmacy as a career’12 and ‘post entry career paths’17 without definition. However ‘career commitment’ is defined as “one’s attitude towards one’s profession or vocation” by Cline et al (1999)18. In these two examples, the concept of career is used as a metaphor: career path as a metaphor for journey and “career commitment” as a metaphor for career as a role19. Inkson describes “careers as abstractions as constructs open to construction and interpretation from many different sources”. Career metaphors have been described as “an epistemological ragbag”19. This suggests that we need further investigation as to the nature of pharmacy careers.
So, the pharmacy career is associated with a profession and maybe even a vocation in life. Rascati20 refines career commitment further by distinguishing between commitment to the entire field or role, from a commitment to the job or one’s organisation. Pharmacy is not usually associated with being ‘just a job’ or just employment, although employers use the words ‘manpower’ and workforce when describing their employees.
Popular notions of a career include the idea of a lifetime association with a chosen profession; the potential for graded career progression upwards into management and of safe well rewarded secure employment. The notion of what constitutes a career may be changing. There is new research evidence by the charity Common Purpose, which claims that talented young people want more out of life than their predecessors21. They want more than their career offers. The centrality of a career in life and as a ‘label’ may be declining22. They are looking for personal satisfaction and by the mid 30s they find themselves caught up in a financial trap of student, mortgage and credit card debt. Moreover, they are disappointed with the reality of work and their career does not help them to realise their wider life ambitions. The drive towards seeking a better work life balance is relatively new. Employers are not seen as sensitive or sympathetic to this ‘mood’.
2.2.8 Summary
This brief review of the theoretical and pharmacy literature raises many questions. This ‘work life balance theory’ might explain why more and more newly qualified pharmacists want to travel around the world and why they are only prepared to take locum work – because they want the rewards and not the career. There are limitations. We do not yet know to what extent pharmacy undergraduate choices or rationale for choice resemble or differ from other graduates. On the one hand the skills and qualifications they gain as pharmacy graduates have made them employable in many overseas countries, making travelling a feasible option. On the other hand they will be well informed about disappointment with the reality of pharmacy after the preregistration year by the time they are qualified. Hence they are making rational career decisions ‘bounded’ by social influences and the demands of the labour market.
2.3
A Conceptual Framework for the Study
The conceptual framework is presented in a diagrammatic model. Taking on a framework of bounded rationally, implicitly acknowledging variations in human capital, the key concepts of the opportunity or power to choose, from amongst alternative options in a pharmacy career is bounded by:
1. A society where careers and occupations are characterised by gender, social class and race (ethnicity). These factors will have an influence on individual career ambition and lifestyle desires.
2. Experience within the school of pharmacy, influences of peers, staff, knowledge derived from external visits, work placements and those staff, the ethos and history of the school of pharmacy.
3. An individual and collective awareness of the labour market opportunities available at any given point in time (for example, reading the Pharmaceutical Journal on workforce shortages; peer talk about which employers interview, recruit, train and retain staff; the labour market itself and employer’s expectations and demands of pharmacists).
Personality Theories
Culture/Class
Habitus C Bourdieu
Family Religion
Human Capital Theory
Qualifications
Rational Choice
Theory
Bounded Rationality
Gender
Race
Class
Careers Fairs/PJ/Publicity Material
Experience in School of Pharmacy
Awareness of Labour Market
Experience in employment
Employers Expectations and
Demands of the employee
Influences - peers, staff
Pharmacy Placements
Lifestyle Balance
Ambitions
Lifestyle
3. METHODS
3.1
Analysis of UCAS Student Data
Data were obtained through the UCAS statistical service. The data obtained covered
the applications to pharmacy and to medicine from 1998-2003 (the only data
available at the time of the start of the research). It must be noted that the data is
that of applicants to these courses, not those who were accepted onto degree
courses, although the data is suitable for comparative purposes in this case. Where
comparative figures are shown for responses to 1
styear questionnaires, they relate
to 2003 UCAS application data (the latest data available). Where comparative
figures are shown for responses to 4
thyear questionnaires, they relate to 2001
UCAS application data, as this is the year of entry for the majority of fourth year
students. UCAS data is also only that of home and EU students, so some slight
differences may occur due to the questionnaire data containing some overseas
respondents (18.1% of first year respondents, 5.9% of 4
thyear respondents).
UCAS age data has been combined to match the age categories given in the
questionnaire. Because UCAS combines ages from 25-29 years and upwards,
comparison with the highest age group in the questionnaire (26+) was not possible.
This group has therefore been combined with 24-25 years to give a category of 24+.
UCAS age data is also based on the age of the applicant on 1
stSeptember of the
year of entry to a degree course (i.e. for 2003 entry, the age of applicants on
1.9.2003). The age data obtained from the questionnaire is that of the respondent at
the time of completion of the questionnaire.
Ethnicity data from the questionnaire has been combined into the following
categories to minimise small groupings:
•
White (included: British, Irish and Other White background).
•
Black or Black British (included: Black Caribbean, Black African and any other
Black background).
•
Dual Heritage (included: White and Black Caribbean, White and Black African,
White Asian and any other mixed background).
•
Asian (included: British Asian, Indian, Pakistani, Bangladeshi and any other Asian
background).
•
Chinese or Other Ethnic Group (included: Chinese and Any other background).
•
Don't want to say.
It should be noted that UCAS include the Chinese ethnic group within the Asian
population.
Socio-economic data is more difficult to compare on a year-by-year basis. From
1998 to 2001, UCAS used Social Class, based upon the Standard Occupational
Classification 1990 and 2000. In 2002 and 2003, UCAS started using a simplified
version of Socio-economic Status (NS-SEC) based upon the Standard Occupational
Classification 2000 and the two are not directly comparable.
3.2 The
Survey
3.2.1 Survey Design and Core Questions
The survey was designed using the motivation variables from a number of earlier surveys and after scanning two work satisfaction surveys.23,24 The questions in the 2004 NHS Workforce Survey23 were considered but ruled out because the study covered staff already in post and in an exclusively public sector employment. The factors were less useful because of the diversity of pharmacy ownership and employment patterns across public (NHS Trusts) and commercial (multiple and independent ownership) sectors. By comparison a study by Arnold et al24 was useful since it aimed to identify features of NHS employment which attracted or deterred staff and it contained some useful statements that were directly relevant to pharmacy.
The design incorporated measures to test the conceptual framework outlined in the introduction to this report. We measured opinions, perceptions and motivation towards pharmacy as a subject of study and as a profession.
The questionnaire designed for first year students contained 14 pages with a total of 28 questions. The questionnaire for final year students contained an additional section covering their experience as a final year student; this version consisted of 20 pages with a total of 40 questions. In both cases, most questions were closed. The questionnaires were divided into the following sections:
Section 1: Motivations and influences. Section 2: Choice of School of Pharmacy. Section 3: Career image.
Section 4: Future career ambitions. Section 5: Work life balance.
Section 6: Your experience as a final year student (final year students only). Section 6/7: About you.
The survey was piloted with two groups of pharmacy undergraduates: all year one students and all final year students in a UK school of pharmacy. Both groups answered the core set of questions.
3.2.2 Fourth Year Supplement
The questionnaire supplement for fourth year students was based on exploratory focus group work with final year students (unpublished) and the right hand side of the diagrammatic model of the conceptual framework (see section 2.3, page 11).
The supplementary section consisted of twelve questions. The first questions assessed real experience within the school of pharmacy during the MPharm course.
• Within the school of pharmacy.
• Within placement education linked to the school of pharmacy.
• Of employment in pharmacy – vacational.
• Of employer attitudes and views through employment and through involvement in the preregistration process.
The remainder of the questions were about external pharmacy related factors which may influence career decisions and direction. A number of statements tested some commonly
held notions about working as in healthcare and as a pharmacist. Finally, we measured perceptions of the status of pharmacy compared to other key health professions.
3.2.3 Administration
of the Questionnaire
A lengthy negotiation process was undertaken with a lead contact in each of the sixteen schools of pharmacy (16 at the time, now 22). Unfortunately there were two other student studies going on at the same time, which meant that both staff and the same students were over-surveyed. The survey questionnaire was sent to a named contact in each school for ethical committee approval (see section 3.2.7) and comment prior to administration of the survey. At this point two schools declined to participate. The protracted manner in which these negotiations took place meant considerable slippage in the administration of the survey, where timing during term time was all important. Final year students complete their studies early in the final year, which further complicated the timing.
Having obtained ethical approval from each institution the survey questionnaire was re-piloted and posted in March/April 2005 to 14 of the 16 established UK schools with a current final year cohort who agreed to participate. In recognition of the work involved, £500 was offered to each school to cover administration costs. In addition, one prize per participating school (£80) was offered to the students as an incentive to participate in the study.
There were considerable obstacles in administering the survey, resulting in a less than desirable outcome. The process of administration varied considerably across the schools to the extent that it produced a markedly variable response rate. We had no control over the administration process, of when the survey was handed out or collected in. We had to be pragmatic and go along with what each schools was prepared to do.
• 9 schools provided us with both first and final year class lists. We sent them named labelled envelopes.
• 2 schools were not prepared to hand over class lists for data protection reasons. We provided sealed numbered envelopes.
• 3 schools distributed unmarked questionnaires during a lecture. Two schools distributed to both years (first and final) and one school only distributed to first year students as their final year students were not in the school at the time of the study.
3.2.4 Response
Rate
The variable administration approach is a result of different requirements by the schools. It is not ideal in textbook terms, but was a pragmatic response to a difficult situation. The main implications were the loss of time which meant that students were no longer in school after the first distribution. This was a lost opportunity to follow up non responders and so boost the response rate.
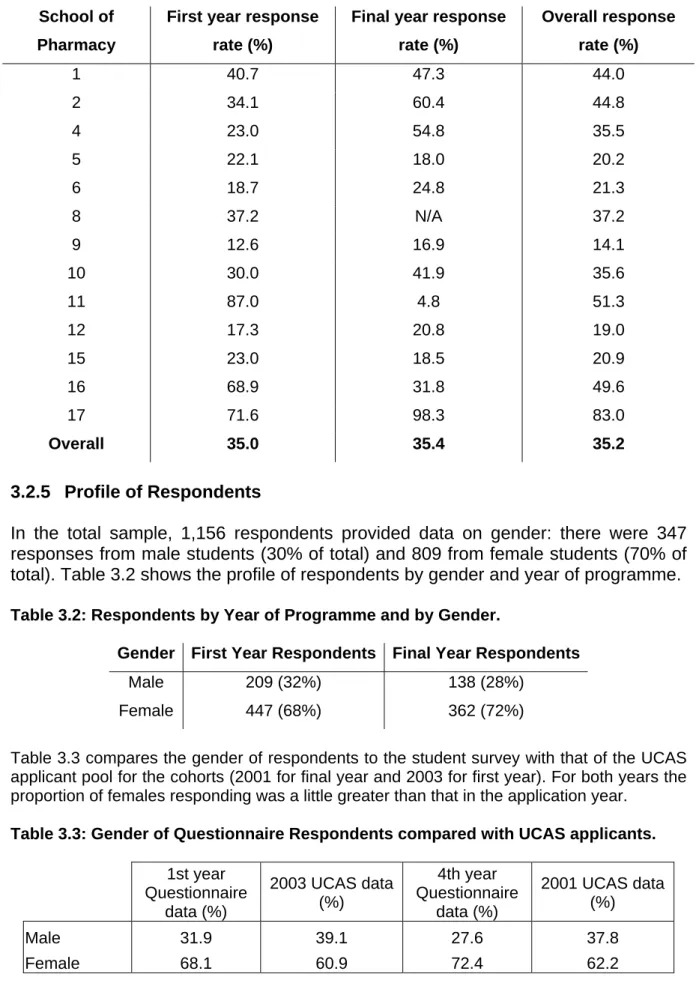
The final response rate by the beginning of June from 3,306 students was 35.2% (n=1,163). This splits into 657 first year students (response rate 35.0% (n=1,878)) and 506 final year students (response rate 35.4% (n=1,428)). The variable administration approach resulted in a range of response rates by school from 14.1% to 83.0%. Owing to its choice of distribution method, the response rate in one school was so low (2.5%) that this school was omitted from the analysis. Table 3.1 shows the variability of response rate between years and schools of pharmacy.
Table 3.1: Survey response rate by school (for the 13 schools included in the study). School of
Pharmacy
First year response rate (%)
Final year response rate (%) Overall response rate (%) 1 40.7 47.3 44.0 2 34.1 60.4 44.8 4 23.0 54.8 35.5 5 22.1 18.0 20.2 6 18.7 24.8 21.3 8 37.2 N/A 37.2 9 12.6 16.9 14.1 10 30.0 41.9 35.6 11 87.0 4.8 51.3 12 17.3 20.8 19.0 15 23.0 18.5 20.9 16 68.9 31.8 49.6 17 71.6 98.3 83.0 Overall 35.0 35.4 35.2
3.2.5 Profile
of
Respondents
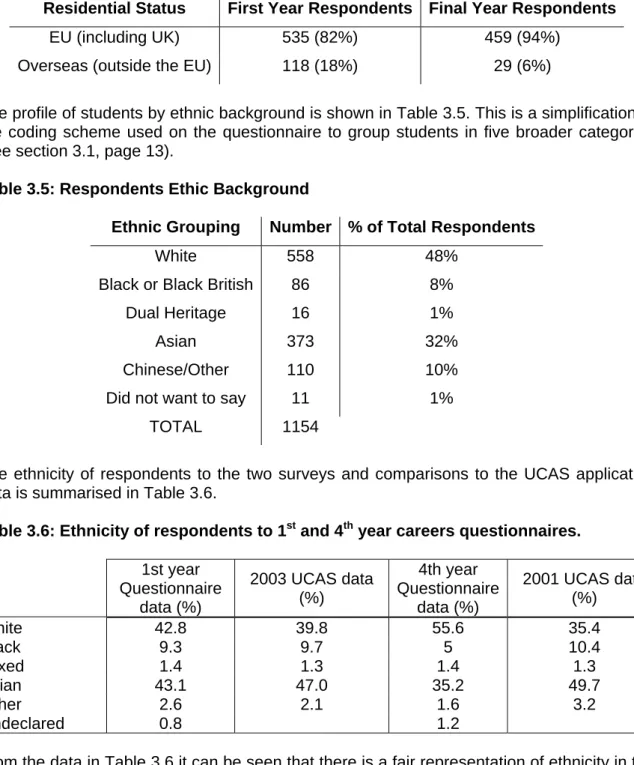
In the total sample, 1,156 respondents provided data on gender: there were 347
responses from male students (30% of total) and 809 from female students (70% of
total). Table 3.2 shows the profile of respondents by gender and year of programme.
Table 3.2: Respondents by Year of Programme and by Gender.
Gender First Year Respondents Final Year Respondents
Male 209 (32%) 138 (28%)
Female 447 (68%) 362 (72%)
Table 3.3 compares the gender of respondents to the student survey with that of the UCAS applicant pool for the cohorts (2001 for final year and 2003 for first year). For both years the proportion of females responding was a little greater than that in the application year.
Table 3.3: Gender of Questionnaire Respondents compared with UCAS applicants.
1st year Questionnaire data (%) 2003 UCAS data (%) 4th year Questionnaire data (%) 2001 UCAS data (%) Male 31.9 39.1 27.6 37.8 Female 68.1 60.9 72.4 62.2
A total of 1,141 respondents provided data on their origin (EU or overseas). The analysis by origin and by year of programme is shown in Table 3.4.
Table 3.4: Respondents by Year of Programme and by Residential Status
Residential Status First Year Respondents Final Year Respondents
EU (including UK) 535 (82%) 459 (94%) Overseas (outside the EU) 118 (18%) 29 (6%)
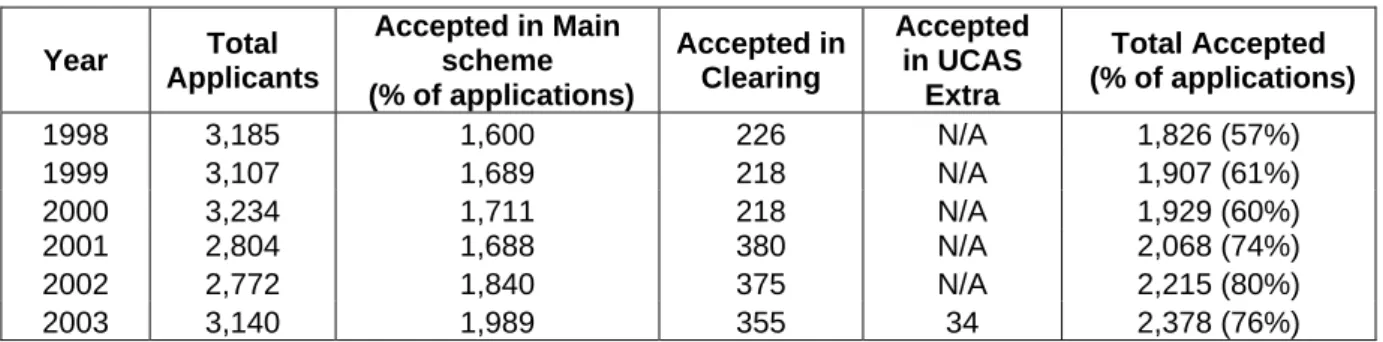
The profile of students by ethnic background is shown in Table 3.5. This is a simplification of the coding scheme used on the questionnaire to group students in five broader categories (see section 3.1, page 13).
Table 3.5: Respondents Ethic Background
Ethnic Grouping Number % of Total Respondents
White 558 48%
Black or Black British 86 8%
Dual Heritage 16 1%
Asian 373 32%
Chinese/Other 110 10%
Did not want to say 11 1% TOTAL 1154
The ethnicity of respondents to the two surveys and comparisons to the UCAS application data is summarised in Table 3.6.
Table 3.6: Ethnicity of respondents to 1st and 4th year careers questionnaires.
1st year Questionnaire data (%) 2003 UCAS data (%) 4th year Questionnaire data (%) 2001 UCAS data (%) White 42.8 39.8 55.6 35.4 Black 9.3 9.7 5 10.4 Mixed 1.4 1.3 1.4 1.3 Asian 43.1 47.0 35.2 49.7 Other 2.6 2.1 1.6 3.2 Undeclared 0.8 1.2
From the data in Table 3.6 it can be seen that there is a fair representation of ethnicity in the respondents to the first year survey, albeit with some over-representation of white students and an under-representation of Asian students in the fourth year survey. Because of small sub-samples in several of the fields, this study has only compared the two major ethnic groups: white and Asian (see section 6.7).
Finally the age distribution of respondents is summarised in Table 3.7. It is not possible to make any sensible comparison with UCAS application data because the census data for the careers questionnaire and for UCAS entry are six months out of phase.
Table 3.7: Age of respondents to questionnaires.
Age 1st year respondents (%) 4th year respondents (%)
17 – 19 57.0 - 20 – 21 22.3 19.2 22 – 23 7.8 57.9 24 – 25 4.1 11.0 26+ 8.8 12.0
3.2.6 Analysis
Data from the questionnaires were analysed following coding and entry into the Statistical Package for Social Sciences Version 12 (SPSS). Valid responses were used throughout the results section. Non-parametric statistical tests were applied to the nominal data and where applicable, the continuity correction for Pearson’s chi-squared test was employed to investigate whether there was a statistically significant association between variables.
3.2.7 Ethical
Approval
The survey questionnaire was approved by Aston University Ethics Committee. Two other schools required additional institutional approval prior to distribution and in both cases this was granted.
3.2.8 Report
Presentation
The results in this report are presented in a consistent format, giving comparisons between year one and year four; male with female; ethnicity differences – white and Asian. Further in depth interrogation will be undertaken for journal and conference presentations.
4.
ANALYSIS OF UNDERGRADUATE ENTRY DATA
4.1
General Applicant Data
Table 4.1 summarises application and acceptance data for UK schools of pharmacy over the six year period from 1998 to 2003, which at the time of writing this report was the last available data set. Main scheme applicants are those who apply through UCAS and conform to all UCAS deadlines. The majority of clearing candidates are those who are not accepted by their firm choice (CF) institution or their insurance choice (CI) institution. A smaller number ask to be released into clearing by both their CF and CI institutions once their A level grades are published. UCAS Extra applicants are those that are rejected by their first six choices of institution during the application process and so may choose a seventh to apply to, usually late in the application process (April through to June). UCAS extra started in 2003.
Table 4.1: Summary of applicant data to pharmacy 1998-2003.
Year Total Applicants Accepted in Main scheme (% of applications) Accepted in Clearing Accepted in UCAS Extra Total Accepted (% of applications) 1998 3,185 1,600 226 N/A 1,826 (57%) 1999 3,107 1,689 218 N/A 1,907 (61%) 2000 3,234 1,711 218 N/A 1,929 (60%) 2001 2,804 1,688 380 N/A 2,068 (74%) 2002 2,772 1,840 375 N/A 2,215 (80%) 2003 3,140 1,989 355 34 2,378 (76%)
The number of applicants to pharmacy has remained relatively stable since 1998, with a low of 2,772 in 2002. Intakes over the same period have increased with an increase in both the number of students accepted in the main scheme and the total taken through clearing. In 1998, 57% of those who applied to study pharmacy were accepted onto a pharmacy degree course in the then 16 UK Schools of Pharmacy. By 2003, this figure had risen to 76%. In 1998, 12% of the total intake to UK schools of pharmacy came from the UCAS clearing scheme and by 2003 this has increased to 15%.
The total main scheme applications for pharmacy include all who enter pharmacy on their application form. The number therefore overstates the committed pharmacy applicants since it will include students who are including pharmacy as a fall back subject rather than their first preference. This is particularly the case with applicants for medicine who are advised by medical schools not to use all their applications for medicine. Given that a significant number of applicants will also not achieve minimum entry qualifications, the increase in clearing intake from 2001 onwards is likely to reflect saturation of the primary applicant pool.
Three new schools opened in 2004, with an intake of approximately 80 students each, taking the number of accepted applicants to just over 2,500. It is anticipated that a further four to six new Schools of Pharmacy will be open by October 2006, each with the potential to take up to 150 more students onto MPharm programmes. The data presented above suggests that these intakes will only be achieved if there is an increase in the applicant pool. The alternative will be a significant decline in entry qualification.
4.2 Gender
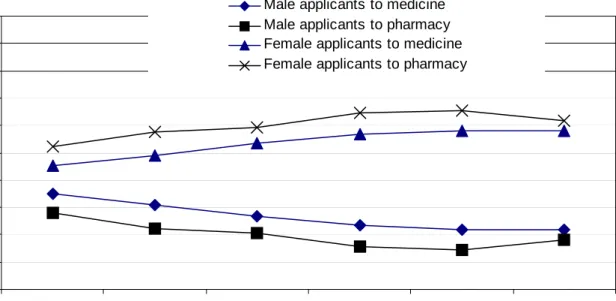
In 1998, 43.9% of applicants to pharmacy were male, with 56.1% female. A similar proportion was evident in applications to medicine in 1998, with 47.4% being male and
52.6% being female. An upward trend in female applicants to both subjects was seen until 2003, when a slight downturn was seen. At the highest point (2002) 62.7% of applicants to pharmacy courses were female; in 2003 this fell to 60.9%.
A similar pattern was seen in the applicant pool for medicine. Trends in the gender of applicants to pharmacy, compared with that to medicine since 1998 are shown in Figure 4.1.
Figure 4.1: Trends in the gender of applicants to medicine and pharmacy 1998-2003.
30.0 35.0 40.0 45.0 50.0 55.0 60.0 65.0 70.0 75.0 80.0 1998 1999 2000 2001 2002 2003 Year % o f ap p li can ts b y su b je c t
Male applicants to medicine Male applicants to pharmacy Female applicants to medicine Female applicants to pharmacy
4.3 Age
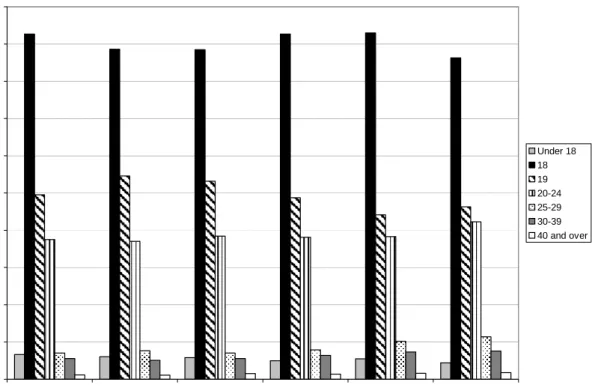
Over the six year period 1998-2003, the 18 year old age group has consistently formed the highest proportion of applicants to pharmacy, with approximately 45% of applicants (Figure 4.2). This proportion has remained relatively static. In 1998, 50% of applicants to medicine were from this age group, but this proportion has dropped steadily to 44% in 2003. This may be accounted for by the new four year medicine courses, entry to which requires a previous undergraduate degree, therefore increasing the age of applicants to medical degrees.
Pharmacy consistently attracts a large proportion of 19 year old applicants (on average 25% of applicants to pharmacy). In 1998, 21% of applicants to medicine were aged 19, but this has dropped dramatically to 15% in 2003. This difference may again be due to the increase in older applicants to medicine (22% of applicants in 2003 were from the 20-24 year old age group, compared to 17% in 1998). A high proportion of 19 year old applicants is consistent with a subject that has high UCAS entry qualifications where a proportion of students repeat their A-level examinations to attain the required grades. It is also consistent with a subject that has a significant “second choice” applicant pool who fail to get into their preferred option on the first round. In the case of pharmacy it is likely that both these factors contribute but it is notable that almost one third of respondents to the both the first and fourth year questionnaires (27.4% 1st years and 28.9% fourth years) stated that pharmacy was not their first and only choice of career. In both years, just less than half of the respondents who did not consider pharmacy a first choice had applied to medicine (49.4% of these first year respondents and 41.7% of these fourth year respondents).
Figure 4.2: The age of applicants to pharmacy degree courses 1998-2003. 0.0 5.0 10.0 15.0 20.0 25.0 30.0 35.0 40.0 45.0 50.0 1998 1999 2000 2001 2002 2003 Year % of a p pl ic a n ts Under 18 18 19 20-24 25-29 30-39 40 and over
4.4 Ethnicity
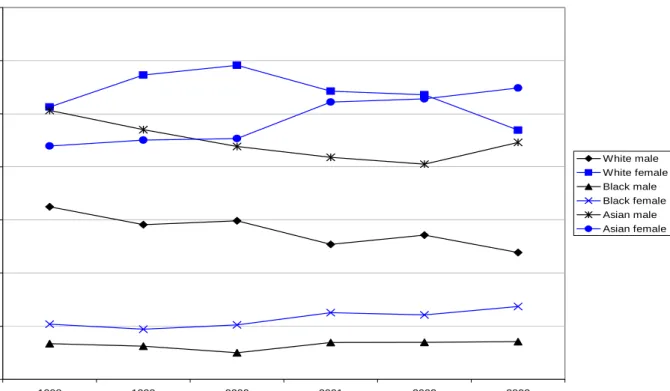
Over the six year period 1998-2003, an average of 40% of applicants to pharmacy degree courses were from a white background, compared to 66% of applicants to medicine. In the case of pharmacy, there has been a downward trend in white male applicants (1998, 16.2% of applicants were white males, dropping to 11.9% in 2003). The number of white male applicants to medicine is much higher (on average 25% of applicants over the six year period of 1998-2003) and has remained relatively static.
47% of applicants to pharmacy over the same period were from an Asian background, compared to only 25% of applicants to medical courses. The number of male Asian applicants to pharmacy has remained relatively stable (25.3% of applicants at its highest in 1998, 20.3% at its lowest in 2002, rising to 22.3% in 2003). There has been an increase in Asian female applicants to pharmacy with 22% of applicants in 1998, rising to 27.4% in 2003. Pharmacy also consistently attracts a higher proportion of black applicants (average 9%) when compared to medicine (average 4.4%). The trends in the ethnicity of applicants to pharmacy are shown in Figure 4.3.
Figure 4.3: Trends in ethnicity of applicants to pharmacy degree courses 1998-2003. 0.0 5.0 10.0 15.0 20.0 25.0 30.0 35.0 1998 1999 2000 2001 2002 2003 Year % o f r e s p o n d e nt s d ecl ar in g et h n ic it y White male White female Black male Black female Asian male Asian female 4.5 Socio-economic Background
The social class measure used by UCAS is based upon an applicant’s parental occupation, or the occupation of the person contributing the highest income to the household if the applicant is aged 21 years or over. The categories of Social Class used up until 2002 are outlined in Table 4.2.
Table 4.2: Social Class as used by UCAS prior to 2002. Social Class Description
I Professional, etc. occupations
II Managerial and Technical occupations III N Skilled occupations – non-manual III M Skilled occupations – manual
IV Partly skilled occupations
V Unskilled occupations
In the four year period 1998 to 2001, the majority of applicants to pharmacy degree courses and medical courses came from Social Class II (Intermediate). However, whilst on average 37% of applicants to medicine came from Social Class I (Professional) for pharmacy the proportion was 20%. For pharmacy, 41% of applications came from the bottom four social classes compared with 24% for medicine. These differences are summarised in Figure 4.4.
Figure 4.4: Percentage of applicants from each of the UCAS social class codes for Medicine and Pharmacy 1998 to 2001.
0 5 10 15 20 25 30 35 40 45 I II IIIM IIIN IV V Socia l Cla ss % of Tot a l A pplic a n ts Pharmacy Medicine
Table 4.3 summarises the socioeconomic data for both medicine and pharmacy by year between 1998 and 2001.
Table 4.3: Comparison of socio-economic background of applicants to pharmacy and medicine 1998-2001 (Pharm: Pharmacy; Med: Medicine).
1998 (%) 1999 (%) 2000 (%) 2001 (%) Social Class Pharm Med Pharm Med Pharm Med Pharm Med I Professional 19.7 36.8 19.3 36.5 20.7 37.1 19.4 37.4 II Intermediate 38.9 39.7 38.2 39.1 38.5 39.2 40.9 39.7 IIIM Skilled manual 16.7 8.8 18.2 8.9 16.8 9.1 17.9 8.7 IIIN Skilled non-manual 11.6 8.6 11.9 9.5 12.2 9.1 11.2 8.8
IV Partly skilled 9.4 5.1 9.5 4.9 8.7 4.5 8.0 4.6
V Unskilled 3.7 1.0 2.9 0.9 3.1 1.0 2.5 0.8
From 2002 onwards, UCAS moved to the NS-SEC categories for definition of social class of applicant (see Table 4.4).
Table 4.4: NS-SEC (Eight-class version) as used by UCAS from 2002 onwards. NS-SEC Classification Description
1 Higher managerial and professional occupations 2 Lower managerial and professional occupations
3 Intermediate occupations
4 Small employers and own-account workers 5 Lower supervisory and technical occupations
6 Semi-routine occupations
In 2002 and 2003, with the change to the NS-SEC classification (see Table 4.4), one third of applicants to pharmacy came from NS-SEC 2 (Lower managerial and professional occupations) and 21% from NS-SEC 1 (Higher managerial and professional occupations). In contrast, 42% of applicants to medical degree courses came from NS-SEC 1 and 31% from NS-SEC 2 (Table 4.5).
Table 4.5: Comparison of socio-economic background of applicants to pharmacy and medicine 2002 and 2003.
2002 applicants (%) 2003 applicants (%)
Social class Pharmacy Medicine Pharmacy Medicine
Higher managerial and professional occupations 20.9 42.9 22.3 41.4
Lower managerial and professional occupations 29.6 29.8 29.2 31.2
Intermediate occupations 11.6 11.3 11.5 11.2
Small employers and own account workers 9.7 4.5 10.2 4.5
Lower supervisory and technical occupations 4.4 1.9 4.4 2.4
Semi-routine occupations 17.2 7.2 16.2 6.9
Routine occupations 6.5 2.5 6.3 2.4
4.6
Summary of Key Findings.
• The total UCAS applicant pool for pharmacy over the period 1998 to 2003 was steady despite a 30% increase in intakes to the 16 established schools of pharmacy. Over this period there has been an increased dependence upon intakes from clearing and there is evidence to suggest that the applicant pool is saturated. Unless new schools attract a new entry pool, the expansion of the total entry numbers has implications for entrance standards and entry quality.
• The majority of applicants (circa 60%) for pharmacy were female and the proportion increased progressively over the period 1998 to 2003. Similar trends were observed for applications to medicine.
• The majority of applications for pharmacy were from students in the 18-19 year group with only small numbers of applicants (less than 10%) over the age of 25. The single largest age group of applicants were aged 18 (around 45% of total) with around 25% of the pool aged 19. This is consistent with a traditional university subject attracting applications primarily from sixth forms and colleges. The relatively high proportion of 19 year old applicants is consistent with a subject with high entry grades and a significant proportion of applicants for whom it is a second choice subject. The age profile of applicants for pharmacy and medicine are broadly similar.
• Over the period 1998 to 2003, more than 90% of the applicants to pharmacy were either white or of Asian background. Total applications from Asian students (average 47% of pool) exceed those from white students (average 40% of the pool). Applications from white males have declined consistently throughout this period to around 12% of the total pool and applications from white females have been in decline since 2000. There has been a slow increase in the proportion of black applicants. There was notable difference in the ethnicity of the pharmacy applicant pool compared to that for medicine. Over this time period, the proportion of Asian (25%) and black (4%) applications for medicine was almost half those for pharmacy, while white applications for medicine were steady.
• Assessment of socio-economic data of UCAS applicants is complicated by the change in methodology by UCAS in 2002. Overall, there were major differences
between the applicant pool for pharmacy and medicine. Pharmacy had half the proportion of applicants in the highest socioeconomic grouping compared with medicine but twice as many in the lowest socioeconomic groupings. In 2002 and 2003, just under half of the total applications for pharmacy were from students in the “non-professional” socioeconomic groupings.
5.
SURVEY OF MPHARM STUDENTS
5.1
Motivations and Influences
In this section of the survey we presented all the extrinsic and intrinsic motivators identified in previous studies and in our own preliminary focus groups. To avoid complexity we divided them into three categories: education related, personal influences and personal career goals.
5.1.1 Education Related Influences
Respondents were asked how important a set of education related factors were to their decision to study pharmacy. Answers were on a four-point Likert scale. To simplify the factors results have been summarised in Figure 5.1 as the difference between the percentage of respondents rating the factor as important and the percentage rating it as not important (i.e. the difference between the two extremes).
It should be noted that the 4th years are thinking retrospectively, and therefore the decision process is probably less clear in their minds. For both the 1st year and 4th year respondents, three factors showed as net positive in terms of importance: a university prospectus, a university open day visit and careers leaflets or booklets. The least important factor for both 1st and 4th year respondents was a radio or TV programme. The RPSGB was not perceived as important. There was no significant association of response with gender for any of the statements.
Comparing the relative order of importance of the factors, the responses of all white and of all Asian students was exactly the same. However, with the exception of a university prospectus, Asian students attributed more importance to each factor. For example, in the case of the third most important factor, careers leaflets or information, 20% (n=112) of white respondents rated this as important and 30% (n=165) as not important compared with 31% (n=116) of Asian respondents who rated it as important and 16% (n=60) who rated it as not important (Chi, p<0.01 at least).
Figure 5.1: Importance of education related reasons why people choose to study pharmacy. Results are shown as the difference between the % of respondents who rated as important and the % who rated as not-important.
-60 -50 -40 -30 -20 -10 0 10 20 30 40
a
b
c
d
e
f
g
h
Statement % i m po rt ance 1st year 4th year Key:a A subject teacher at school / college b A careers teacher at school / college c A visit to a careers fair / conference d A visit to a university open day e A university prospectus
f Royal Pharmaceutical Society of Great Britain literature g Radio or TV programme
h Careers leaflets or booklets
5.1.2 Personal
Influences
Students were asked to state how important a set of personal factors were to their decision to study pharmacy. The results are summarised in Figure 5.2 as the difference between the % of respondents who rated as important and the % who rated as not-important.
Both the 1st and 4th year respondents stated that the most important personal factors for choosing to study pharmacy were: the influence of pharmacy work experience and parents encouraging them to study. The least important factors were: the influence of friends and a family member owning a pharmacy.
Figure 5.2: Importance of personal reasons why people choose to study pharmacy. Results are shown as the difference between the % of respondents who rated as important and the % who rated as not-important.
-60 -50 -40 -30 -20 -10 0 10 20 30
a
b
c
d
e
f
Statement % i m por tance 1st year 4th year Key: Reason a My parents encouraged me to choose pharmacyb My family encouraged me to choose pharmacy
c Someone in my family who owns a pharmacy influenced me d I was influenced by a pharmacist I know, as a role model e My friends influenced me
f I was influenced by pharmacy work experience
There were some significant differences between responses of males and females. 17.8% (n=61) of males, compared to 9.6% (n=77) of females agreed that statement (c) (someone in my family who owns a pharmacy influenced me) was an important personal influencing factor (Chi, p<0.001). Differences were also seen in perceptions of “Pharmacy work experience” as an influencing factor. 45.7% (n=368) of females agreed that this was an important factor, compared with 34.9% (n=119) of male respondents rating this factor as important (Chi, p<0.01).
When responses of all white and of all Asian students were compared, the order of importance of the factors was exactly the same. However, with the exception of the factor “I was influenced by a pharmacist I know, as a role model”, there was a significant difference in the distribution of responses for each factor with white or Asian background. In all but one of these cases, students of Asian background placed higher importance upon the factors than did white students (Chi, p at least <0.01). For example, the second most important factor “my parents encouraged me to choose pharmacy” was rated important by 24% (n=131) of white students and by 33% (n=121) of Asian students (Chi, p <0.01). The exception was the factor most highly rated by all students, “I was influenced by pharmacy work experience”.
This was rated as important by 50% (n=278) of white students compared with 40% (n=147) of Asian students (Chi, p <0.01).
5.1.3 The Influence of Personal career goals on Career Choice
We were interested in the aspects of a career in pharmacy that most strongly influenced the respondents in their decision to choose to study pharmacy (see Figure 5.3). The same career factor emerged as the most important to both the 1st and 4th year sample respondents: “I wanted a job with good career opportunities”. The next four most important factors for the whole study sample were: “I wanted a profession where you can always get a job”, “I wanted to do a science based course”, “I wanted to work in a well respected profession”, and “I liked science/was good at science at school”.
Figure 5.3: Career aspects as influences on decision to study pharmacy. Results are shown as the difference between the % of respondents who rated as important and the % who rated as not-important.
-40 -20 0 20 40 60 80 100
a
b
c
d
e
f
g
h
I
j
k
l
m
n
o
Statement % i m por tance 1st year 4th year Key:a I liked science / was good at science at school b I wanted to do a science based course
c I wanted to work in a well respected profession d I wanted a job with good career opportunities e I thought pharmacy would be intellectually satisfying
f I wanted a job where I am socially useful g I wanted to work with patients
h I wanted to own my own business
i I wanted the opportunity for self-employment j I wanted the opportunity for part time work
k I was attracted by the financial rewards l I wanted flexible working hours
m I wanted a profession where you can always get a job n I wanted to work with medicine or in the medical profession
o I wanted to study medicine/dentistry or another medically related subject
There was a significant association between gender and the response to six of the statements (Chi, p at least <0.01). A greater proportion of fema