4
Making International Aid
and Debt Relief More Effective
S
EVERAL MUTUALLY REINFORCING TRENDS AREleading to the promise of more aid—and more effective aid—to developing countries. The de-cline in aid flows that began in the early 1990s ap-pears to have ended, and the pace of debt relief has been stepped up. Both recipients and donors have increased their commitment to the more effective deployment of aid. Of special importance is the emphasis on greater “ownership” of the develop-ment agenda by recipient countries themselves. Continuation of these initiatives is crucial if aid is to makes its proper contribution to achieving the International Development Goals formulated by the global development community.1
This chapter documents the favorable recent trends in aid but also points to the importance of vigilance in sustaining and consolidating these gains. Indeed, the trends identified in this chapter are yet the early manifestations of a deeper change taking place in the aid relationship. Both aid recip-ients and donors now agree on new roles. Coun-tries are to have greater ownership of, but also greater accountability for, their development pro-grams; donors are to provide predictable medium-term assistance appropriate to each country’s chosen development strategy, but conditioned on results. The shift is epitomized by the adoption of Poverty Reduction Strategy Papers (PRSPs) to guide concessional assistance in low-income countries. The Heavily Indebted Poor Countries (HIPC) Ini-tiative, launched in 1996 and enhanced in 1999, embodies these leading-edge approaches to achiev-ing debt relief.
The four sections of the chapter highlight these developments, centered around the following main themes:
• Concessional aid flows increased during 2000, maintaining their upward movement since 1998. However, concessional aid in 2000 was still much less than in the early 1990s, and some temporary factors are responsible for much of the recent rise. Sustaining increased aid flows will require greater commitment and effort from all donors, following the example set recently by some donors.
• Aid was more effectively deployed toward poverty reduction during the 1990s than be-fore. Better policies in many poor countries improved their capacity to absorb aid, and a larger share of aid went to countries with supe-rior policies. This is an important develop-ment, not only for the large numbers of poor people who have received real benefits from it, but also because this trend promises to help re-verse “aid fatigue” and thus generate political support for the higher levels of funding needed. • Greater effectiveness of aid will also follow from recent first steps toward donor specializa-tion and the increasing commitment to provide assistance through budgetary or programmatic support based on agreed-on policy and institu-tional frameworks. The shift to programmatic approaches reflects recognition of the long-standing difficulties in coordinating a host of separate projects, each with differing donor re-porting requirements. Strong ownership and sound financial management by recipient gov-ernments will be critical to the success of the new instruments of development assistance. • The enhanced HIPC Initiative has quickened
the pace of and increased the resources avail-able for debt relief, although the extent to 1
which the initiative will increase total assis-tance is unclear. The binding constraint for the HIPCs is less a conventional debt over-hang (in which a massive stock of debt limits private investment through the expectation of higher future taxes and by creating uncertain-ties about repayment) than an endemic weak-ness of policy and institutions. Hence the tie between debt relief and policy reform is key to the initiative’s eventual success.
Trends in aid flows
F
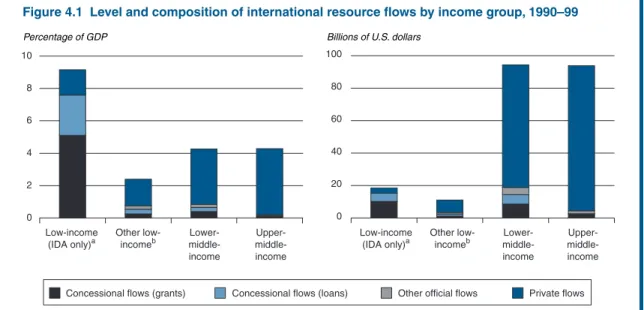
or the poorest countries, official resource transfers are a significant source of revenues, accounting for about 8 percent of these countries’ combined gross domestic product (GDP) in the 1990s (figure 4.1).2The large transfers thesecoun-tries receive—almost entirely in the form of grants and concessional loans—sustain government spend-ing and domestic investment. But as their incomes rise, countries grow less reliant on official resource transfers, and private inflows increase. And with higher incomes the terms of official loans become less concessional, and the role of official flows
shifts increasingly to providing a cushion against shocks and facilitating more effective private flows.
In real terms, concessional flows worldwide increased by nearly 50 percent between 1970 and 1980, and by 32 percent in the ensuing decade. They then plunged 25 percent in the 1990s, as the end of the Cold War led to reduced support, fiscal compression in donor countries reduced aid bud-gets, and increasing doubts were raised about the effectiveness of aid. In 1999 the average donor country provided aid equal to about 0.24 percent of its gross national product (GNP), compared with 0.35 percent in 1989–92. If the 0.35 percent ratio had been maintained, aid flows in 1999 would have been $20 billion higher than the $55 billion actually realized.
However, concessional flows have risen mod-estly since 1997. The analysis in this chapter shows that this increase reflects some temporary factors, notably the rise in Japanese aid in response to the financial crisis in East Asia. Looking ahead, fiscal stringency in some donor countries and continued skepticism about the value of aid are likely to dampen aid flows. However, recent commitments by some other donors could bolster these flows—a
a. “IDA only” stands for countries that only borrow on concessional terms from the International Development Association of the World Bank.
b. Subtracting IDA only countries from low-income group. Also excludes Indonesia and Ukraine, which are included in the lower-middle-income group for analytical purposes despite their official classification as low-income countries.
Source: World Bank, Global Development Finance: Country Tables, various years.
0 Low-income (IDA only)a Other low-incomeb Lower- middle-income Upper- middle-income Low-income (IDA only)a Other low-incomeb Lower- middle-income Upper- middle-income 2 4 6 8 10 0 20 40 60 80 100
Concessional flows (grants) Concessional flows (loans) Other official flows Private flows
Percentage of GDP Billions of U.S. dollars
trend that ongoing improvements in aid effective-ness should reinforce. These larger aid flows are vital to deal with continuing challenges in meeting the International Development Goals.
Trends in official development finance and aid flows
Excluding technical cooperation grants of $17.1 bil-lion, total official development finance—conces-sional and nonconcesfinance—conces-sional resources—to develop-ing countries was $38.6 billion in 2000, another significant decline after the steep drop in 1999 (table 4.1). The decline was due to nonconcessional flows that fell back again in 2000, reflecting the ability of some countries to prepay on rescue packages as they emerged from the global financial crisis. Brazil paid back $3.2 billion of the $4.5 billion emergency funding made available in 1998 through the Bank of International Settlements. Thailand prepaid on its loans from the Asian Development Bank. All major multilateral institutions recorded a decline in dis-bursements, including a sharp drop in lending from the Inter-American Development Bank to Argentina and Colombia and a cessation in lending from the Asian Development Bank to the Republic of Korea, as that country returned to market-based financing from commercial sources.
In contrast, concessional aid flows (also referred to as official development assistance and official aid, and consisting of grants and loans with a grant component of at least 25 percent) increased
mod-estly to $41.6 billion, although aid levels remained lower than in 1995.3
Aid flows to developing countries can be mea-sured in two ways: as outflows from donor coun-tries or as inflows to recipient councoun-tries. The aid from donors reflects bilateral disbursements of concessional financing to developing countries (in-cluding technical cooperation grants), plus their provision of concessional financing to multilateral institutions such as the International Development Association (IDA, an affiliate of the World Bank Group). Aid flows received by developing countries include concessional disbursements from bilateral and multilateral agencies but conventionally ex-clude technical cooperation grants (see World Bank, Global Development Finance 2000). The two mea-sures also differ because the concessional funding received from donor sources by multilateral institu-tions does not match those instituinstitu-tions’ disburse-ments to developing countries in any given year.
The aid effort of donors. Preliminary data from the Organisation for Economic Co-operation and Development (OECD) show that official de-velopment assistance from donors rose 9 percent in 1999, to $55 billion (table 4.2). This represents 0.24 percent of the combined GNP of the principal donors: the 22 country members of the OECD’s Development Assistance Committee (DAC). This increase continues the upward trend that began in 1998, when aid flows rose $3.2 billion, and sug-gests an end to the decline in aid that lasted from Table 4.1 Official flows to developing countries by type and source, 1990–2000
(billions of dollars)
1990 1991 1992 1993 1994 1995 1996 1997 1998 1999 2000a
Total official development finance 55.2 60.9 56.5 53.6 48.0 55.1 31.9 42.8 54.6 45.3 38.6
Official development assistance 43.2 49.5 46.4 41.7 48.1 46.2 39.7 35.6 38.4 40.3 41.6
Grantsb 28.2 35.1 30.5 28.3 32.7 32.7 28.1 26.1 27.3 28.9 29.6 Bilateral 24.6 29.5 23.9 22.5 24.6 26.1 21.8 19.8 20.5 22.0 22.6 Multilateral 3.6 5.6 6.6 5.8 7.9 6.6 6.3 6.3 6.8 6.9 7.0 Concessional loans 15.0 14.4 15.9 13.4 15.4 13.5 11.6 9.5 11.1 11.4 11.7 Bilateral 8.3 6.3 8.5 6.7 6.5 4.9 3.0 1.5 3.1 4.3 5.1 Multilateral 6.7 8.1 7.4 6.7 8.9 8.6 8.6 8.0 8.2 7.1 6.6 Nonconcessional loans 12.0 11.4 10.1 11.9 –0.1 8.9 –7.8 7.2 16.2 5.0 –3.0 Bilateral 2.9 3.9 4.5 3.5 –2.6 5.2 –12.4 –6.5 –4.4 –7.1 –7.3 Multilateral 9.1 7.5 5.6 8.4 2.5 3.7 4.6 13.7 20.6 12.1 4.3 Memo items
International Monetary Fund 0.1 3.2 1.1 2.6 1.6 16.8 1.0 14.7 19.2 –12.6 –10.8
Technical cooperation grants 14.1 15.6 17.7 18.2 16.9 20.0 18.7 15.7 16.2 16.6 17.1
Note:Inflows of debt are net of amortization payments. For this reason, these flows are sometimes referred to as “net” resource flows. a. Estimate.
b. Excluding technical cooperation grants.
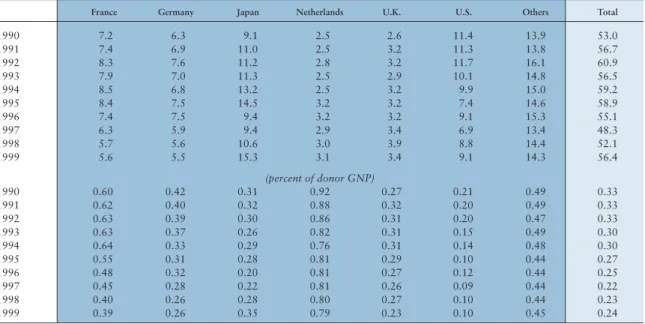
Table 4.2 Official development assistance from Development Assistance Committee countries, 1990–99 (billions of dollars)
France Germany Japan Netherlands U.K. U.S. Others Total
1990 7.2 6.3 9.1 2.5 2.6 11.4 13.9 53.0 1991 7.4 6.9 11.0 2.5 3.2 11.3 13.8 56.7 1992 8.3 7.6 11.2 2.8 3.2 11.7 16.1 60.9 1993 7.9 7.0 11.3 2.5 2.9 10.1 14.8 56.5 1994 8.5 6.8 13.2 2.5 3.2 9.9 15.0 59.2 1995 8.4 7.5 14.5 3.2 3.2 7.4 14.6 58.9 1996 7.4 7.5 9.4 3.2 3.2 9.1 15.3 55.1 1997 6.3 5.9 9.4 2.9 3.4 6.9 13.4 48.3 1998 5.7 5.6 10.6 3.0 3.9 8.8 14.4 52.1 1999 5.6 5.5 15.3 3.1 3.4 9.1 14.3 56.4 (percent of donor GNP) 1990 0.60 0.42 0.31 0.92 0.27 0.21 0.49 0.33 1991 0.62 0.40 0.32 0.88 0.32 0.20 0.49 0.33 1992 0.63 0.39 0.30 0.86 0.31 0.20 0.47 0.33 1993 0.63 0.37 0.26 0.82 0.31 0.15 0.49 0.30 1994 0.64 0.33 0.29 0.76 0.31 0.14 0.48 0.30 1995 0.55 0.31 0.28 0.81 0.29 0.10 0.44 0.27 1996 0.48 0.32 0.20 0.81 0.27 0.12 0.44 0.25 1997 0.45 0.28 0.22 0.81 0.26 0.09 0.44 0.22 1998 0.40 0.26 0.28 0.80 0.27 0.10 0.44 0.23 1999 0.39 0.26 0.35 0.79 0.23 0.10 0.45 0.24
Note:Total assistance includes technical cooperation grants.
Source:OECD Development Co-operation Report 2000.
1992 to 1997. During that period official develop-ment assistance fell from 0.33 percent of donors’ combined GNP to a record low of 0.22 percent.
Japan registered the most significant increase in aid among major donors in 1999, thanks to its special assistance program for countries affected by the East Asian financial crisis. At $15.3 billion that year, Japanese aid was $4.7 billion higher than in 1998. The other major factor influencing the global rise in aid flows from donors, particu-larly those from the United States, was the interna-tional effort to assist refugees from Kosovo.
The sharp increase from Japan masked the slide in official development assistance relative to GNP from four other Group of Seven (G-7) coun-tries: Canada, France, Italy, and the United King-dom. Aid from Germany and the United States re-mained at about their levels of 1998. Aid flows continue to remain restricted because of domestic fiscal concerns in some major donor countries. The United States, in contrast, has a large fiscal surplus, but some argue that aid skepticism, di-rected particularly at the official channels for aid delivery, limits that country’s ability to rebuild its traditional aid program (Lancaster 2000).
However, some positive long-term signs of an increase in aid are in evidence. Among the G-7 countries, the firmest commitment to increased aid
comes from the United Kingdom (United Kingdom 2000). The U.K. government expects to increase its aid from 0.26 percent of its GNP in 1997 to 0.33 percent in 2003–04, which would represent a 45 percent increase in real terms over that period. Prospects of aid are also bright among the non-G-7 countries, many of which remain strongly commit-ted to maintaining or increasing aid relative to GNP. There are also welcome signs that aid from non-DAC donors is picking up. Korea’s aid flows are now on the order of $0.3 billion per year, Turkey provides $0.1 billion, and the more ad-vanced East European countries like the Czech Republic and Poland together now account for around $50 million per annum. Aid from Arab donors, which in 1990 amounted to $5.5 billion (or almost 10 percent of all aid flows) has now sta-bilized at around $0.3 billion.
Aid receipts (net of technical cooperation). In 2000, aid flows to developing countries increased to an estimated $41.6 billion (excluding technical cooperation grants of $17.1 billion). This was $3.2 billion more than in 1998 but nearly $7 billion less than in 1994 (see table 4.1). Among developing re-gions, East Asia and Pacific, and Europe and Cen-tral Asia, both saw a marked increase in aid in 1999–2000. Together these two regions accounted for nearly 45 percent of flows; meanwhile the 2
shares of Sub-Saharan Africa and South Asia de-clined (table 4.3).
East Asia’s increase was driven by the surge in aid from Japan noted above. The main beneficiary was Indonesia, a country that had essentially “grad-uated” from concessional finance, where the net in-flow of aid doubled between 1997 and 1998 and doubled again in 1999–2000, to an annual average of $1.9 billion. Thailand and Vietnam each saw net inflows of aid rise by $0.3 billion in 1999–2000, to $0.8 billion and $1.2 billion each year.
In Europe and Central Asia, two quite differ-ent forces fueled the sharp increase in aid levels. Emergency assistance initiatives in the Balkans, particularly the Federal Republic of Yugoslavia (province of Kosovo) and its neighboring coun-tries, totaled $1.2 billion a year in 1999–2000, an increase of 200 percent over 1998. Support for re-construction in Bosnia and Herzegovina contin-ued: net inflows there were up $0.3 billion to reach an annual average of $1 billion in 1999–2000. At the same time, the higher-income Eastern Euro-pean countries are seeing greater aid flows in sup-port of their efforts to join the European Union. Net aid inflows to the Czech Republic, Hungary, Poland, and the Slovak Republic totaled $1.6 bil-lion in 1999 and almost $2 bilbil-lion in 2000. Aid to these countries, together with the $1 billion in aid to the Russian Federation each year, accounted for one-third of aid flows to Europe and Central Asia in 1999–2000.
The story in Sub-Saharan Africa is mixed. Civil conflict and delays in implementing reforms caused a sharp drop in net aid flows to Côte d’Ivoire, Guinea, Kenya, Niger, and Togo. But some reform-ing countries—Tanzania, Uganda, Zambia—saw net aid flows rise, although modestly. In the Middle East and North Africa, continued growth in aid to
support the peace process was more than offset by the fall in aid to middle-income countries in the re-gion, notably Algeria and Egypt. The decline in aid to South Asia reflects cuts in aid to Pakistan. Flows to Bangladesh and India held steady.
The need for more aid
A recent analysis shows that to achieve annual economic growth of 7 percent—the rate of growth needed to reach the International Development Goal of reducing poverty by half by 2015—Africa will need to productively invest an amount equiva-lent to 30 percent of its GDP each year. Given the region’s low savings rates and limited immediate prospects of attracting private capital, this would imply about a 20 percent increase in Africa’s aid budget, assuming the additional resources were fully invested (World Bank and partner institutions 2000). Extrapolating beyond Africa, a return by donors to their early-1990s average aid ratio of 0.33 percent of GNP would provide an extra $20 billion that could defray the additional costs of meeting the International Development Goals.
However, aid has sometimes been held back because of the concern that the additional resources would not be used productively. The next two sec-tions of the chapter document the progress that has been achieved—and is ongoing—in making more effective use of aid. These positive trends are begin-ning to lay the foundation for larger aid flows.
Allocation of aid across countries
T
he effectiveness of aid is measured along sev-eral dimensions, but the principal yardstick is the progress achieved in the alleviation of poverty. Has the available aid worked harder recently than Table 4.3 Aid flows by developing region, 1990–2000(percent)
As share of aid flows to all developing countries As share of regional GNP
Region 1990 1998 1999 2000 1990 1998 1999 2000
East Asia and Pacific 17.0 17.7 20.1 20.0 0.8 0.4 0.4 0.3
Latin America and the Caribbean 10.2 9.2 9.9 9.1 0.4 0.2 0.2 0.2
Middle East and North Africa 19.9 11.6 9.5 9.9 2.0 0.7 0.7 0.8
South Asia 12.2 12.5 9.8 10.1 1.3 0.8 0.8 0.8
Sub-Saharan Africa 37.2 32.3 27.8 27.2 5.8 3.9 4.2 4.1
Europe and Central Asia 3.5 16.6 22.9 23.7 0.1 0.6 0.6 0.6
All developing countries 100.0 100.0 100.0 100.0 1.0 0.6 0.6 0.5
in the past at lifting people out of poverty? The evidence suggests that it has. Aid recipients have made increased commitments to the effective use of aid. Donors have allocated more aid where the re-sults are likely to be superior. Important challenges still lie ahead as more donors establish and opera-tionalize their benchmarks for aid allocation, espe-cially those for determining the level and form of engagement in poor countries with weak absorp-tive capacities. But the progress to-date in the more effective recent use of aid is already good news not only for the poor who benefit but also from the long-term perspective of reversing aid fatigue and skepticism (World Bank 1998; Lancaster 2000).
The current concern with effectiveness arises in the context of the decline in aid in the 1990s, but effectiveness first arose as a prominent issue in the late 1980s after a substantial runup in aid (figure 4.2). Over time, the bottom 50 percent of countries receiving aid received a relatively steady level of aid, but a striking rise occurred among the top quarter of recipient countries, which received in-creasingly greater, indeed unprecedented, amounts of aid. In the early 1990s aid inflows reached 13 percent of GDP or more for this top 25 percent of recipients. Without the ability to absorb these re-source transfers, however, growth failed to materi-alize—further increasing the dependence on aid (Lancaster 1999). This lack of growth and absence of progress on poverty raised serious concerns about the effectiveness of aid flows.
Some important shifts have occurred in recent years, creating a brighter prognosis. First, the do-mestic economic environment in recipient countries has generally improved, increasing their absorptive capacity. Second, aid allocation mechanisms now give greater weight to that absorptive capacity, im-proving the effectiveness of aid dollars in reducing poverty.
But more is possible. IDA lending, for exam-ple, demonstrates that by staying focused on the poorer countries—and especially the better per-formers among them—aid flows can be more effec-tive in achieving poverty reduction than is possible by the current allocation of bilateral official flows (Dollar 2000). Also, thus far improvements in aid allocation have been achieved principally through a sharp decline in aid to countries with weak eco-nomic policy performance, not through a rise in aid to countries with good performance. Looking ahead, higher levels of aid can be effectively
de-ployed in some poor countries and in others with demonstrable improvements in policy and gover-nance measures. The rest of this section focuses first on the empirical links between aid flows and poverty reduction and then on the prospects for making aid more effective.
How aid works
Aid has in fact been more effective than is widely credited or perceived (see, for example, Herfkens 1999). Aid can have a direct impact on poverty, for example when it is targeted to programs for chil-dren, nutrition, and emergency relief. However, money is fungible. Since aid may be directed to proj-ects that the country would have financed in any event, its real impact may sometimes be to permit the country to pursue other activities, which may have no impact on poverty. Hence much of the re-cent analysis of the effectiveness of aid in reducing poverty has focused on how aid affects broad eco-nomic aggregates and government policy. That em-pirical analysis highlights three important themes: • Aid works—and it works principally through
increasing domestic investment, not through increasing productivity, on which aid has little or no impact. Instability in aid flows, how-ever, dampens domestic investment.
Aid/GNP (percent)
Figure 4.2 Trends in aid/GNP
Note: Recipient nations were ranked by average aid flows measured relative to GNP. The chart shows the cross-country mean aid flows (relative to GNP) by decade, as well as the 25th, 50th (median), and 75th percentiles.
Source: OECD DAC.
0 1960s 1970s 1980s 1990–94 1995–98 2 4 6 8 10 12 14 Median Third quartile First quartile Mean 3
• Evidence from cross-country regressions indi-cates that aid does not “buy” policy reform. Evidence from country case studies points to a more complex relationship between aid and reform: aid can play a supportive role in coun-tries where the domestic environment is con-ducive to reform. However, within the emerg-ing new aid relationship—with its emphasis on greater country ownership and account-ability—the clear implication is that aid is not intended to buy reform; rather, aid flows are to be related to up-front actions and progress on development outcomes.
• The need for donors to be more selective in their aid allocations is now widely accepted (see Collier and Dollar 2000). Questions re-main, however, with respect to refining the performance benchmarks that should guide the allocation of aid, and some especially diffi-cult questions arise concerning the scale and type of engagement in countries with average or below-average policy environments. Donors will need to distinguish among countries with average policy environments by assessing the credibility of their development strategies. In low-income countries, this assessment will focus on the country’s PRSP.
Aid increases domestic investment. The em-pirical studies are generally consistent in finding that more aid is associated with more domestic in-vestment. In fact, the relationship between aid and domestic investment bears some significant simi-larities with the relationship between private capi-tal inflows and domestic investment (as discussed in chapter 3).
First, averaged over periods of three to five years, increases in aid, like increases in private capital inflows, have almost a one-to-one associa-tion with increases in domestic investment. The finding in this respect is quite similar across three different studies using different methodologies and control variables: Lensink and Morrissey (1999), Hansen and Tarp (forthcoming), and Collier and Dollar (2001). However, Collier and Dollar fur-ther note, as discussed below, that the relationship between aid and investment is not uniform but de-pends on the policy environment.
Second, macroeconomic studies find, after controlling for the aid-investment relationship, no direct link between aid and growth through
en-hanced factor productivity. In light of the findings in chapter 3, this is not altogether surprising. There it was noted that foreign capital spurs productivity growth principally in sophisticated environments, for example in countries with superior human cap-ital and developed financial structures. The poorest countries are also the weakest in these respects. However, there is some evidence that productivity is enhanced in situations where aid helps increase the efficiency with which governments and their agencies work. Project-level analysis suggests that rates of return are higher where the domestic policy environment is favorable (Isham and Kaufmann 1999) and where the institutional environment is strengthened through greater civil liberties (Isham, Kaufmann, and Pritchett 1995).
Third, again echoing the private capital flow findings, instability in aid flows dampens growth. Lensink and Morrissey (1999) find that volatility of aid receipts may affect fiscal behavior and lower both public and private investment. A recent study finds, moreover, that aid flows not only are quite volatile but, more important, tend to be procycli-cal: more aid is associated with economic upturns and less with downturns (box 4.1). Thus, inducing stability in aid is important to achieve the best re-sults from aid dollars. Programmatic assistance, discussed below, can help in this regard.
Fourth, the receiving country’s capacity to absorb aid may also become strained because aid levels eventually reach a point of diminishing re-turns—in fact, in extreme cases, aid could even become counterproductive. Elbadawi (1999) con-cludes that diminishing returns are a serious prob-lem for the highest aid recipients, as do Dalgaard and Hansen (2000) and Lancaster (1999). Collier (1999) and Collier and Dollar (1999) find statisti-cal evidence of diminishing returns but conclude that, in strong policy environments, they set in only at very high aid levels.
Finally, aid has typically failed to facilitate inter-national flows of private capital. It is not surprising that high levels of aid are not frequently associated with improved access to foreign capital, because aid is often provided to extremely poor countries with weak institutional environments, which are unattrac-tive to foreign investors.
Increased aid levels seldom stimulate improve-ments in policies and institutions. A strong policy and institutional environment is highly conducive to stepped-up growth rates (see, for example,
Hansen and Tarp forthcoming). In principle, aid could work to foster growth and reduce poverty by influencing domestic policies and institutions for the better. More aid could allow the government the breathing space to undertake difficult reform measures with short-term costs but long-term pay-offs. A generally consistent finding, however, is that economic policies and governance structures rarely respond to increases in aid inflows. Indeed, more aid can encourage aid dependence or even predatory behavior, with perverse effects on policy and governance.
Using cross-country regressions, Burnside and Dollar (2000) find no evidence that aid has sys-tematically affected macroeconomic and trade policies, either for good or for ill. Country case studies provide more nuanced insights. Devarajan, Dollar, and Holmgren (1999) show that in some
instances (in Ghana and Uganda, for example) aid has supported the policy reform process. However, they argue that the impetus to policy reform in both cases came from domestic pressures and that aid, which rose in a supportive manner after the reforms were under way, had been very low before the reforms were initiated. The authors also cite other examples (such as Zambia) where aid in-creased while policy deteriorated. Examining gov-ernance measures, Knack (2000) finds higher lev-els of aid to be associated with lower bureaucratic quality and higher levels of corruption, again sug-gesting that aid does not necessarily help toward improvements in these dimensions.
In the past, therefore, increased aid has gener-ally not been effective in stimulating reform, and many have concluded that continued efforts to use aid for this purpose are likely to be no more
suc-I
n an influential study, Burnside and Dollar (2000) found that aid does not act independently to increase growth, but that aid can foster growth in a sound policy environ-ment (defined as one with low budget deficits and inflation and an open trade regime). Finding in addition that aid does not influence improvements in policy performance, these authors reached a strong policy conclusion: more aid should be channeled to countries with good policies. Subse-quently, Collier and Dollar (1999 and 2001) proxied the quality of the domestic environment using the World Bank’s Country Policy and Institutional Assessment index, which covers a wider range of policy and institutional indicators. They again found that policy and aid reinforce each other. The Burnside-Dollar study has been subject to two different econometric criticisms. First, Dalgaard and Hansen (2000) argue that the results are statistically frag-ile. Using the same data as Burnside and Dollar, they find that the inclusion or exclusion of a few selected ob-servations can render the interaction term (which mea-sures the mutually reinforcing effect of policy and aid) insignificant.Second, the econometric results vary depending upon whether variables that explain country growth rates are included or not. Burnside and Dollar (2000) demonstrate the robustness of their results to the inclusion of some ad-ditional explanatory variables. But others reach different conclusions. For example, Guillaumont and Chauvet (1999) include measures of country vulnerability to
exter-nal shocks and the interaction of such vulnerability with aid. They find both these additional variables to be statisti-cally significant. Moreover, they report that aid has an in-dependent effect on growth but that the aid-policy interac-tion that Burnside and Dollar find is no longer significant. Similarly, Hansen and Tarp (forthcoming) use a recently developed econometric technique that controls at the same time for both unobserved country-specific characteristics and endogeneity (the possibility that growth performance influences aid as well as vice versa). Once again, they find that aid is positively related to growth but that the aid-policy interaction is not significant. Hansen and Tarp also caution that their results are sensitive to the specific econo-metric controls for endogeneity.
Finally, Lensink and Morrissey (1999) add the insta-bility of aid as an explanatory variable and find it to be significant, as is the level of aid. This finding is of impor-tance since Pallage and Robe (2000) find that aid flows are highly volatile—more volatile than output, although less volatile than private capital flows. Importantly, Pallage and Robe also find that aid, like private capital flows, displays a marked procyclicality, particularly in Africa. These find-ings apply to both multilateral and bilateral flows. It is not immediately clear why aid flows should necessarily be pro-cyclical, but one possible explanation has to do with the structure of disbursements: because recipients often must contribute matching funds, aid flows may decrease during a cyclical downturn and increase during recovery.
Box 4.1
Aid and poverty reduction: what do
econometric studies tell us?
cessful. They argue that conditionality (donor-specified requirements that a country undertake reforms as a condition for receiving aid) is typi-cally not a viable approach to making aid effective (see, for example, Collier and others 1997; Killick, Gunatilaka, and Marr 1998). Instead, it is increas-ingly accepted that the effectiveness of aid requires a national commitment to the reform process: “government-initiated measures, with donors in-fluencing the course of events through their intel-lectual contributions and practical help” (Killick, Gunatilaka, and Marr 1998, p. 177).
These findings have led to a new emphasis on ownership of the reform process by the recipient country’s government. An early study showed that the performance of development projects (as rated by the World Bank’s Operations Evaluation De-partment) improved when the client country dis-played a greater commitment to and hence own-ership of the policies that underpin the project. Ownership of aid programs is “vital for credibility of policies, safeguarding against policy reversals, and ensuring sustainability of benefits” (Johnson and Wasty 1993, p. iii).
Benchmarks for the allocation of aid. Since the new aid relationship emphasizes the diversity of recipient countries and ownership of measures to promote growth and reduce poverty, bench-marks for aid allocation become relevant. Three factors have been suggested as bases for such benchmarks:
• Although some empirical controversies persist (box 4.1), government performanceis increas-ingly accepted by researchers and, especially, by policymakers as an important guide to aid allocation (World Bank, World Development Report 2000/2001; Beynon 2001). Govern-ment performance is generally agreed to in-clude economic policies, other antipoverty programs, and the quality of governance and institutional capacity (Isenman 2001). • The extent of a country’s povertyis a second
important consideration.
• Higher levels of aid can also be desirable where they cushion or offset for specific struc-tural weaknesses,such as vulnerability to eco-nomic shocks.
Collier and Dollar (1999 and 2001) have pro-posed benchmarks for the allocation of aid that rely
on a country’s policy and institutional performance and on measures of its poverty. By their estimates, aid works harder to raise growth in countries with sound policy and institutional environments (box 4.1). This perspective implies increased aid espe-cially to countries that have both large numbers of poor people and policy regimes with the potential to use aid effectively. For example, Uganda, a coun-try with good policies and a high poverty rate, should be receiving much more aid than it currently does. The Collier and Dollar allocation bench-marks also lead to greater aid where the policy en-vironment is somewhat weaker but poverty is se-vere. Aid works less efficiently in weaker policy environments, but deeper poverty implies that sig-nificant volumes of aid can eventually lift a larger number of poor people out of their poverty.
An allocation of aid based on a global target of poverty reduction is likely to initially favor a limited number of countries and will differ from aid allocations that seek to support simultaneous poverty reductions in several countries. Aid alloca-tion benchmarks, therefore, may need to take ac-count of growth trends and the likelihood that in some countries, absent an early effort, poverty may cumulate and render the subsequent task more difficult. This approach is likely to favor Africa in particular and would be consistent with current widespread donor practice, including that of IDA.
In such situations of deep poverty and weak policy, stepped-up aid will be effective where donors are better able to target their resources at the poor or toward pro-poor interventions. (Re-cent evidence suggests that aid is less fungible than was previously believed to be the case; see Beynon 2001.) Also, the recently introduced poverty re-duction strategies can improve the effectiveness of aid (see World Bank 2000c). Their objective is to create country ownership—and hence raise the credibility—of policy change. At the September 1999 annual meetings of the World Bank Group and the International Monetary Fund (IMF), min-isters endorsed the proposal that country-owned poverty reduction strategies should form the basis for all World Bank and IMF concessional lending. They also agreed, as discussed below, that such strategies should guide the use of resources freed by debt relief under the enhanced HIPC Initiative. The PRSPs are expected to diagnose obstacles to and specify targets for poverty reduction, and to
design the macroeconomic, structural, and social policies required to achieve these targets. They are also expected to estimate the external support needed and describe arrangements for consulting with civil society.
Finally, some have emphasized compensation for structural weaknesses in the domestic economy as a basis for aid allocation (Dalgaard and Hansen 2000; Guillaumont and Chauvet 1999). In this view, aid can compensate for many deficiencies in poor economies, especially their vulnerability to economic shocks. By maintaining fiscal stability in countries subject to, say, weather-related and terms-of-trade shocks, aid can help prevent the (sometimes irreversible) deterioration of infrastruc-ture and human capital. How broadly this com-pensating role applies is an empirical matter that needs further evaluation, along with research into effective mechanisms to deliver such assistance during economic downturns. Collier and Dollar (2001) caution, moreover, that the compensatory function of aid is likely to be a limited one: aid, for example, cannot compensate for corruption and other endemic ills in the governance structure.
Thus policy performance, the depth of pov-erty, and country vulnerability are the guides to the allocation of aid. Different donors are likely to rely on these considerations to varying degrees. Simple rules of allocation are likely to be better than no rules at all, since the absence of rules could serve to perpetuate predominantly strategic considerations, as in the past.
Trends in the allocation of aid
In light of these arguments and findings, what are the prospects for more effective use of aid? Three conclusions emerge. First, there has been a general improvement in the policy environment of coun-tries, which makes effective aid use more likely. Second, the allocation of aid has shifted to give greater weight to countries with better policies. New aid based on this reallocation should do more to reduce poverty than aid in the past. However, there is still room for improvement, particularly in providing more aid to some high-performing coun-tries. Third, although strategic considerations in the allocation of aid have diminished, past donor objectives linger on and new ones have emerged.
Policy improvements. Many developing coun-tries achieved improvements in the policy environ-ment during the 1990s. By the end of that decade,
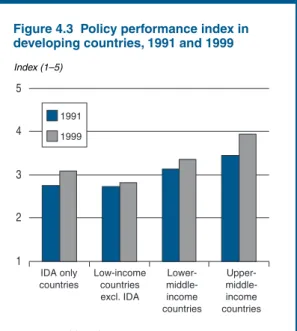
developing countries were, on average, more open to the global economy and had lower inflation, smaller fiscal deficits, a lighter debt burden, and better health and education indicators than in the late 1980s (World Bank, World Development Re-port 2000/2001). Moreover, policy performance has improved as measured by the World Bank’s index of Country Policy and Institutional Assess-ment (a summary index of 20 aspects of macro-economic policy and institutional management; figure 4.3). Importantly, this is so for the poorest countries as well as for middle-income countries. For those low-income countries eligible to borrow only on concessional terms from IDA (“IDA only” countries), the policy performance index has im-proved by roughly half a point, from about 2.75 to 3.25, which on a scale of 1 through 5 is a signif-icant increase.
Policy reform creates superior conditions for aid effectiveness—an extra dollar of aid speeds the reduction of poverty when policy is sound. Higher levels of aid are therefore justified.
Aid allocation. As already noted, aid can allevi-ate poverty directly, or it can help stimulallevi-ate growth in superior policy environments and achieve poverty reduction in that way. In the early 1990s the poor-est third of countries received substantial aid flows (relative to their GNPs), reflecting possibly the ob-jective of directly reducing poverty but presumably
Index (1–5)
Figure 4.3 Policy performance index in developing countries, 1991 and 1999
Source: World Bank.
Upper- middle-income countries Lower- middle-income countries Low-income countries excl. IDA IDA only countries 1 2 3 4 5 1991 1999
also reflecting strategic donor objectives (figure 4.4). In this lowest-income group, countries with poor policies actually received much more aid rela-tive to their GNP than did countries with good policies. The potential for better aid allocation was evident.
Over the course of the 1990s, efforts to make aid more effective focused on selectivity in its allo-cation, that is, on increasing the share going to countries with good policies. By the late 1990s lower income was still associated with more aid, but aid in poor policy environments had fallen sharply.
Although the potential for further improve-ment exists, the allocation of aid at the end of the 1990s was distinctly superior to that of the early 1990s in terms of the goal of poverty reduction (Dollar 2000). Because of its better allocation at the end of the 1990s, the same $1 million of aid would lift more than two and a half times the number of people out of poverty than it did at the start of the decade. The quantification of these gains depends significantly on several assumptions used in the analysis, including the definition of poverty and the response of poverty to growth (Beynon 2001). However, the direction and
signifi-cance of the change appear robust to these method-ological considerations.
Several challenges lie ahead. The improve-ment in aid allocation in the 1990s was achieved by reducing aid where policies were weak. Many better-performing countries experienced only lim-ited increases in aid. In Ghana and Uganda, two successful reformers, aid tapered off after the ini-tial rise. However, as policy performance improves and is sustained, more aid is likely to be needed and to be productive.
At the same time, a concern exists that in the drive to channel aid to countries with good policy performance, those with severe poverty but weak policy performance will not receive adequate at-tention. In such countries a range of possibilities exists. More resources can be devoted to strength-ening the policy dialogue (see Devarajan, Dollar, and Holmgren 1999). Also, carefully targeted an-tipoverty programs may be appropriate. As noted, such efforts are likely to be most fruitful within the context of the emerging poverty reduction strategies, which require country and donor com-mitment to a holistic poverty reduction approach (see also Collier and Dollar 2001 for a discussion). Source: OECD and World Bank.
Figure 4.4 Poor performers experience a decline in aid
30
Aid/GNP (percent) Aid/GNP (percent) Between 1992 and 1994, on average poor performers
received more aid than better performers.
20
10
0 High
Middle
Low thirdTop Middle third Lowest third Country policy ratings Developing-country income groups 30
In 1998, poor performers received less aid than better performers.
20 10 0 High Middle Low Top third Middle third Lowest third Country policy ratings Developing-country income groups
Finally, analysts caution that although bench-marks for aid allocation are important, overly mech-anistic rules could be counterproductive (Beynon 2001). Reallocation based on performance and poverty levels is likely to be beneficial, but other con-cerns also need to be taken into account. For example, reflecting the research described above, aid assess-ments based on country vulnerability to shocks may also be called for. Moreover, aid reallocation is likely to generate greater benefits if the transition from one basis of allocation to another is relatively stable.
Strategic donor interests. The trend toward al-location of aid based on policy performance re-flects not only the growing evidence that aid is in-effective in poor policy environments, but also the reduced influence of strategic considerations in aid allocations after the Cold War. But donors con-tinue to allocate substantial amounts of aid on the basis of strategic interests, which include favoring old colonies and countries with similar geopoliti-cal interests (Alesina and Dollar 1998).
In the meantime, new areas of emphasis have emerged. Lancaster (2000) notes that direct hu-manitarian relief and peacekeeping objectives in-creasingly guide U.S. aid. Short (2000) argues that the European Union’s aid to other European recip-ients is disproportionate to their size and needs. As highlighted above, Japanese aid has been geo-graphically selective, with a focus on countries in East Asia. At the same time, commercial interests continue to exercise some influence on the alloca-tion of aid by country and by sector. Like any po-litical decision, donors’ decisions about aid alloca-tion are influenced by domestic groups with the ability to provide the goods and services required to support particular projects. In short, donor in-terests continue to exert a significant influence on aid allocation.
Coordinating donors: greater
specialization and programmatic aid
There is much too little coordination of effort, much too much suspicion between partici-pants and in many cases a simple absence of a framework to coordinate and bring together under government guidance an agreed set of objectives and effective and accountable pro-grams. (Wolfensohn 1999, p. 21)
As the previous section documented, better policy performance in recipient countries is impor-tant, as is greater ownership by recipient countries of their own development agendas. But while recip-ients are doing their part, donors can also do more to ensure the effectiveness of aid. The inefficiency that arises from lack of donor coordination is a fa-miliar and long-standing problem. It in part re-flects, but also exacerbates, the ill effects of aid al-location based on strategic interests. Yet although the problem is well recognized, solutions have not been forthcoming. Past attempts to improve coor-dination have occurred in the context of individual projects, not aid programs more broadly, and the focus was on harmonizing requirements such as those for reporting and procurement. These efforts made little headway. Indeed, the proliferation of donor agencies, ever more thinly spread over many countries and many activities, continued.
Two important developments offer the pros-pect of greater coordination and hence greater ef-fectiveness in the use of scarce public resources. They are increased donor specialization and a shift to programmatic approaches to the delivery of aid. Donor specialization
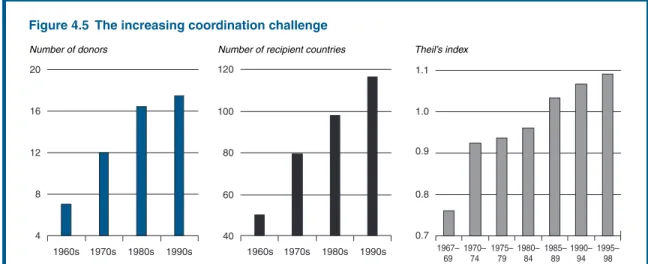
The challenge of coordinating donors’ efforts has increased over time. The number of major donors has grown, and the number of bilateral and multi-lateral agencies and nongovernmental organiza-tions in the aid business has grown even faster (box 4.2). In the 1960s five donors—France, Ger-many, Japan, the United Kingdom, and the United States—accounted for about 90 percent of donor assistance. In the 1990s these same five donors ac-counted for less than 70 percent of aid, and they delivered that aid through a greater number of agencies. The problem is most acute in the smaller, poorer countries. For example, Mozambique, Tan-zania, and Zimbabwe each have to deal with more than 35 donor agencies in just three sectors: agri-culture, health, and education. Each donor today lends to many more countries, and the proceeds of aid are spread over a larger number of activities (figure 4.5).
Some attribute the poor coordination of aid projects to recipients’ lack of capacity, whereas others cite the different objectives that drive donor programs. Cassen and associates (1986), for ex-ample, say, “The role of the recipient is crucial.
Unless the recipient has a firm grasp of the aid process, coordination will not take place or at best reflect only the donor priorities.” In contrast, Kan-bur, Sandler, and Morrison (1999) place the re-sponsibility for ineffective aid on the multiplicity of aid agencies, each pursuing its own priorities. The poorest countries with the weakest adminis-trative capacity are the most disadvantaged in cop-ing with multiple donor requirements.
Despite growing awareness of these problems and substantial efforts to improve coordination, for example through the Strategic Partnership with Africa (formerly known as the Special Program of Assistance for Africa), progress has been limited. Analysis by the World Bank’s Operations Evalua-tion Department shows that only in the transport sector has there been both a (modest) decline in the number of active donors and an increase in the amount of aid. Elsewhere the problem persists and may have actually grown worse, especially in the social sectors.
Part of the answer to poor coordination lies in donors scaling back the span of their activities. Donors need to specialize in terms of both
coun-tries assisted and activities supported. Herfkens (1999), commenting on the Dutch aid program, notes the difficulties facing a donor operating in some 80 countries. She concludes that a narrower focus on 20 to 30 countries would lead to greater effectiveness. The U.K.’s White Paper on Interna-tional Developmentalso notes the importance of donors and multilateral agencies acting according to their comparative advantage (United Kingdom 2000). Recent commitments by major donors could have the effect of increasing specialization and hence reducing the burden of coordination. Programmatic assistance
A more radical proposal is the “common pool” approach to assistance (Kanbur, Sandler, and Mor-rison 1999). A single development strategy for each country would guide all donors, each of whom would receive the same monitoring report. In the pure form of this proposal, assistance to dis-crete projects would end. Instead donors would provide assistance into a common pool that would supplement the recipient’s budgetary resources. This proposal presumes that, over time, donors
N
ongovernmental organizations (NGOs) have becomeimportant players in development over the past decade, growing in both numbers and influence. Official statistics put direct government support for NGOs in the countries that are members of the OECD Development Assistance Committee at $6.4 billion in 1998. But their total expenditure may have been as much as $15.5 billion, or 28 percent of total official development assistance, ac-cording to an OECD Development Centre study cited by Development Initiatives (2000). The term nongovernmental
organizationcovers a wide variety of agencies. NGOs vary
greatly in size, ranging from a few people providing local-ized services to multinational organizations with worldwide budgets larger than those of many bilateral donor agencies. NGOs also vary considerably in terms of their activities.
This diversity in size and structure makes the overall impact of NGOs difficult to assess. Their accountability to different private and public stakeholders as well as varia-tions across countries in reporting and evaluation practices complicate assessment further. Many NGO projects are so small that a thorough external review is either not
feasi-ble or not cost-effective, and evaluation may be left to the NGOs themselves. Even when undertaken by outside ob-servers, mechanical review procedures may not capture the essential value of a project. Nevertheless, over the past decade, increased pressure on aid budgets and growing de-mands for transparency and effectiveness have led to closer scrutiny of NGOs. In the mid-1990s a series of large-scale government studies were carried out in Scandinavia, Aus-tralia, the United Kingdom, and the United States to evalu-ate NGOs’ contribution to poverty alleviation, develop-ment sustainability, and relief efforts. The conclusions were mixed. A majority of projects were found to have achieved their immediate objectives, but judged against broader cri-teria such as sustainability or effecting fundamental social or economic change, success was less apparent (Smillie 1999). However, any assessment should allow for the fact that NGOs are often given the most difficult and challeng-ing assignments. A review of NGOs’ involvement on World Bank projects attributes many unsatisfactory out-comes to unrealistic project design or weakness in partner capacities (Gibbs, Fumo, and Kuby 1999).
Box 4.2
The role of nongovernmental organizations
would acquire faith in the recipient’s ability to de-ploy aid in ways that foster growth and reduce poverty. The approach would greatly reduce the administrative burden on recipient countries, elim-inate donor-driven inconsistencies in development policies, and improve country ownership of the development agenda.4
The World Bank’s Comprehensive Develop-ment Framework (CDF) emphasizes further the critical importance of a holistic approach to devel-opment (Wolfensohn 1999). The CDF highlights the importance of the links between various facets of development and the need to ensure that each facet receives the appropriate attention. The CDF also outlines ways of building coalitions that can implement aspects of the more comprehensive vi-sion. As with the common pool approach, country ownership is central to the success of the CDF. Countries’ PRSPs would operationalize the CDF principles.
Although they are still in their early stages, the prognosis for these approaches is favorable. The move to country ownership through the adoption of country policy frameworks (such as Ghana’s Vision 2020), the shift in many countries toward medium-term strategies for managing public ex-penditure, civil service reform, and greater trans-parency in government budgeting and accounting together establish the prerequisites for a common pool approach. At the same time, some donors
have taken steps to orient their aid policies in this direction (see Herfkens 1999 on the Dutch policy, and United Kingdom 2000). The U.K. government has made a long-term commitment to Rwanda to provide £30 million in “flexible assistance” for three years and “to remain engaged at least at the same financial level” for 10 years. Rwanda’s com-mitments, in turn, include continued efforts to-ward national reconciliation, good governance, macroeconomic stability, and actions toward poverty reduction. This bilateral agreement has prompted other donors to relax their conditionality in disbursing aid to Rwanda (Foster and Naschold 2000).
One important intermediate step in moving away from project lending and toward common pool (or programmatic) assistance is the sectorwide approach. Here financing is provided to an invest-ment program for a selected sector in its entirety, based on an evaluation of that sector’s policy framework and institutional strengths. Although progress has thus far been limited, an important learning process is ongoing.
Sectorwide programs are prominent mainly in the highly aid-dependent countries of Sub-Saharan Africa (Foster 2000). According to the Secretariat of the Strategic Partnership with Africa initiative, at the end of 2000, 17 countries had a total of 30 such operations in six sectors: agriculture, educa-tion, health, transport, water, and energy.
Note: The Theil index is a statistical measure of the extent of concentration of aid by sector. Higher values of the index indicate that aid is spread over a greater number of sectors.
Source: OECD DAC.
Number of donors Number of recipient countries Theil’s index
Figure 4.5 The increasing coordination challenge
4 8 12 16 20 1960s 1970s 1980s 1990s 1960s 1970s 1980s 1990s 1967– 69 1970– 74 1975– 79 1980– 84 1985– 89 1990– 94 1995– 98 40 60 80 100 120 1.1 1.0 0.9 0.8 0.7 5
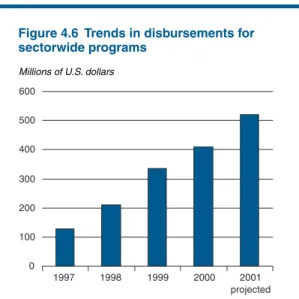
Sectorwide programs in Africa have grown rapidly since 1997, with annual disbursements likely to exceed $500 million (compared with aggregate IDA lending of around $3 billion) in 2001, and fur-ther growth is forecast on the basis of projects in preparation (figure 4.6). The eventual objective is for the bulk of the funds to go either toward bud-get support (and thus be deployed under national budgetary procedures) or to a common basket (with harmonized procedures, which may differ from the recipient country’s own procedures). Al-though budgetary and common resources have in-creased somewhat, donors have thus far continued to lend principally to individual projects within the umbrella of the sectorwide programs.
In light of these trends, the main achievement of the growing sectorwide programs has been to generate a learning process for program design. A recent review of sectorwide programs gives relatively high scores to the planning of program activities, achievement of consistency in sectoral expenditures, and design of institutional arrange-ments (Secretariat of the Strategic Partnership with Africa 2000). Actual implementation of the coor-dination, and monitoring and evaluation, received lower or mixed scores.
Thus, despite some notable successes, sector-wide programs face three important challenges. First, coordination mechanisms need to be further
developed. If they are to succeed, these programs will require agreement between the recipient gov-ernment and donors, a predictable and transparent budget environment, and manageable institutional relationships within the sector (Foster 2000). An evaluation of sectorwide approaches by the World Bank’s Operations Evaluation Department also un-derlines the difficulties faced, especially in complex settings (World Bank 1999). Phased or incremental approaches are likely to be more successful.
Second, strengthening government account-ability for funds is critical. In financing individual projects, donors have often imposed stringent con-ditions for financial management to ensure that the funds were used for the intended purposes. Sectorwide approaches reduce the administrative burden of these separate financial requirements by relying on standardized government procedures to ensure financial accountability. But if policies and institutions that govern budgeting, expenditure management, and accounting for funds are weak, the effectiveness of donor assistance could actually decline as individual financial requirements are phased out.
On balance, allocating donor resources to im-proving the government’s own financial manage-ment practices is likely to do more to improve the effectiveness of aid than having donors support multiple financial management systems. The im-provements in government financial management that this approach can generate may greatly im-prove the effective use of domestic resources as well. Third, although the reforms and the greater policy coherence achieved through sectorwide pro-grams could ultimately induce an increase in aid, the initial result may be a decline in aid as the funding of individual projects is deemphasized (Kanbur, Sandler, and Morrison 1999). Support for aid from special interest groups and businesses in donor countries may erode if they are unable to push specific projects. Formulating effective devel-opment strategies and ensuring adequate finan-cial management and accounting for government projects—critical both to gaining donor support and to the ultimate success of this approach—will take considerable time in some countries. Donors who do not agree with elements of a country’s strat-egy, or who are unwilling to lose the financial ac-countability provided under current projects, may be unwilling to provide general budgetary support and will be unable to fund individual projects.
Millions of U.S. dollars
Figure 4.6 Trends in disbursements for sectorwide programs
Source: Secretariat of the Strategic Partnership with Africa 2000. 0 100 200 300 400 500 600 1997 1998 1999 2000 2001 projected
Donors’ commitment to finding new productive uses for their assistance will therefore be critical.
In short, programmatic assistance offers a productive mechanism for channeling aid, but continued attention is required to ensure success-ful implementation. Moreover, it is important also that ensuring the effectiveness of project-based aid remains a priority. Small, intensive projects with rigorous monitoring can foster reform in a poor-quality environment. This both solves the problem of how to stay engaged when policies are bad, and reaffirms the traditional argument for aid projects, namely, that they build capacity. Without donor engagement in project implementation, the danger arises of losing touch with the realities of the sec-tor or activity in question.
Enhanced debt relief:
the challenges ahead
T
he enhanced HIPC Initiative has expedited debt relief for some of the world’s poorest countries. In 2000 more countries received the promise of—and actual resources for—debt relief than in any previous year since the start of the pro-gram in 1996. This relief will have a significant impact on the countries receiving it. The lasting impact, however, will not arise solely from the mere reduction of debt. Just as the impact of a dol-lar of new aid depends on how well it is used, so, too, the impact of debt relief on poverty depends critically on how the resources freed by debt relief are used. The agenda that lies ahead is one that fosters long-run growth, furthers the integration of these countries into the global economy, and helps establish the basis for long-term links to interna-tional financial markets.The HIPC Initiative has sought, in the first instance, to achieve debt levels that can be serviced without compromising key development goals. However, it has also helped pioneer significant in-novations in the donor-recipient aid relationships. Through its strong link between debt relief and the PRSP process, the initiative has drawn on the lesson that country ownership is essential in sustaining policy reforms necessary for growth and poverty alleviation. Also, the emphasis on tracking the use of the savings realized from HIPC debt relief has helped more generally in raising the profile of issues of public resource management and accountability
in countries that receive aid, thereby facilitating the transition to programmatic assistance.
Progress with the HIPC Initiative
The HIPC Initiative mainly differs from traditional debt relief mechanisms in that it includes, for the first time, relief from debt owed to multilateral in-stitutions. The HIPC Initiative was proposed by the World Bank and the IMF in September 1996 and was subsequently endorsed by some 180 gov-ernments as a comprehensive approach to debt re-lief. The countries identified as HIPCs had already been receiving substantial debt relief through tradi-tional channels such as forgiveness of concessional loans, Paris Club debt relief operations for direct and guaranteed export credits, and commercial bank debt buybacks financed by IDA and other donors.
Forty-one countries owing some $170 billion in external public debt are eligible to be considered under the initiative. Debt owed to multilateral in-stitutions accounted for about 40 percent of these countries’ total debt obligations in 1997, just be-fore the original initiative was implemented. Al-though this debt represents a small slice of the more than $2 trillion owed by all developing coun-tries, it represents a severe burden for the countries in question. The debt of the average HIPC is more than four times its annual export earnings and well in excess of its GNP. And of the 600 million peo-ple living in these countries, half live on less than $1 a day.
In 1999 the HIPC program was enhanced to provide “broader, deeper, and faster” debt relief (box 4.3). Not only is the projected relief greater under the enhanced initiative, but the link between debt relief and sustainable poverty reduction pro-grams in recipient countries is stronger.
In the three years from September 1996 to September 1999, seven countries—Bolivia, Burkina Faso, Côte d’Ivoire, Guyana, Mali, Mozambique, and Uganda—were approved to receive a total of $3.6 billion in debt relief under the original HIPC Initiative. Four of these began to receive cash flow benefits during the same period. Little more than a year later, by the end of 2000, 15 more coun-tries had been added to the list: Benin, Cameroon, The Gambia, Guinea, Guinea-Bissau, Honduras, Madagascar, Malawi, Nicaragua, Niger, Rwanda, São Tomé and Principe, Senegal, Tanzania, and Zambia. In 1999 prices, total committed debt relief
7
then stood at $20.3 billion in net present value terms, or $33.6 billion in nominal terms. (Because some of the debt forgiven is due not now but in the future, the net present value is used as a summary estimate of discounted future obligations.) Under the enhanced initiative, interim debt relief begins immediately at the decision point for most coun-tries, and the relief provided is no longer dependent on projections (see box 4.3 for an explanation of the process).
Of the remaining countries eligible under the initiative, Ghana and the Lao People’s Democratic Republic indicated in late 1999 that they did not in-tend to request debt relief, although their eligibility would continue if they were to reconsider. Twelve more countries—Burundi, the Central African
Re-public, Chad, the Democratic Republic of Congo, the Republic of Congo, Ethiopia, Liberia, Myan-mar, Sierra Leone, Somalia, Sudan, and Togo—are at various stages in the process. Excluding Liberia, Somalia, and Sudan, which are not yet even at the starting point and have not been included in the current costing, HIPC relief is expected to total $28.6 billion (at 1999 prices) in net present value. The impact of the HIPC Initiative
In assessing the potential benefits of the HIPC Ini-tiative, it is important to note that the HIPCs con-tinued to receive large net transfers of resources during the 1990s. In other words, even after debt service was paid, these countries received net in-flows of international resources amounting to
U
nder the original Heavily Indebted Poor Countries(HIPC) Initiative, countries were eligible for relief if a debt sustainability analysis showed that their debt would remain above specified threshold levels (see table) for the foreseeable future, even after full application of traditional debt relief mechanisms. These thresholds were tied princi-pally to expected export earnings and, in some cases, to fiscal revenue. A three-year reform process was required for countries to reach the “decision point,” at which time the suitability of the debt relief package would be deter-mined. Up to three more years of proven policy implemen-tation were required to bring countries to their “comple-tion point,” when debt relief would be provided.
The boards of the World Bank and the International Monetary Fund adopted the enhanced HIPC Initiative in the fall of 1999 to accelerate debt relief while linking it more firmly and transparently to poverty reduction. The targeted debt ratios following debt relief were lowered to
provide a greater cushion against unanticipated economic shocks to export earnings. This was intended to significantly lower debt service payments, thereby increasing the proba-bility of a permanent exit from unsustainable debt and free-ing up resources to support poverty reduction efforts.
Also, unlike under the original initiative, most countries that have reached their decision points are now receiving cash flow assistance through interim debt relief. Whereas under the original initiative the period between the decision and completion points was fixed, the timing of debt relief under the enhanced initiative depends on countries developing and implementing a Poverty Reduction Strategy Paper, maintain-ing macroeconomic stability, and undertakmaintain-ing key reforms. These new arrangements strengthen countries’ ownership of reforms while making it possible to accelerate the completion point. For the countries reviewed in 2000, it is estimated that this approach will reduce the time between the decision and completion points to between one and two years.
Box 4.3
Enhancements to the HIPC Initiative
Debt sustainability targets under the original and the enhanced HIPC Initiative
Criterion Original Enhanced
Targeted NPVaof debt-to-exports ratio 200–250 150
For those qualifying under fiscal window
Targeted NPV of debt-to-government revenue ratio 280 250
Qualifying thresholds
Exports as percent of GDP 40 30
Revenue as percent of GDP 20 15
Assessment of debt relief At completion point At decision point
a. “NPV” is net present value.
about 10 percent of their combined GDPs. Almost all these inflows came from official sources, often in the form of grants. This feature conditions how debt relief will affect these economies. Five conclu-sions can be drawn from the analysis that follows: • Debt relief could help improve the investment climate for the HIPCs by reducing excessive debt, although this effect will likely be mod-est. The HIPC program could, however, make a substantial contribution to faster economic growth by encouraging fundamental improve-ments in the policy and investment climate. • Debt service has been a major budgetary
allo-cation and the relief achieved through HIPC will be significant in relation to health and ed-ucation expenditures. The impact of the relief will depend upon whether it is additional to the net flows already being received.
• There is some evidence of defensive lending by donors, that is, of new loans being extended to ensure the repayment of old loans. Debt re-lief would reduce the preoccupation with the modalities of debt servicing and allow rela-tions with donors to be refocused on a long-term policy dialogue.
• The initiative faces important risks. Achieving adequate growth is crucial to attaining debt sustainability. But at least in some countries, the growth rates now projected would exceed past performance by a considerable margin. This may not be realistic, and it raises the risk that, if new borrowing occurs and growth does not materialize, a sustainable level of debt may not be achieved.
• For these reasons, the link—through the PRSPs—between debt reduction and policy enhancement to meet both poverty and growth objectives is central to the long-term sustainability of debt relief under the initia-tive. Such a link, although critical, is not with-out its own challenges.
The initiative may improve incentives for pri-vate investment. The HIPC Initiative is partly aimed at reducing the uncertainty now facing potential private investors in the HIPCs. An “overhang” of excessive debt can deter private investment as in-vestors anticipate that higher taxes will eventually be needed to pay it off, or because it creates uncer-tainty about future inflation or exchange rate
move-ments (Krugman 1988). Although debt relief may reduce some of these uncertainties, as it did in Latin America during the 1980s where reliance on private capital inflows was significant, the effect for the HIPCs is likely to be small, because more funda-mental constraints, independent of the debt levels, inhibit private inflows. The real constraint on pri-vate investment in HIPCs arises from basic weak-nesses in their domestic investment climate.
The literature offers cautious support for an inverse relationship between the level of debt and macroeconomic performance (Claessens and oth-ers 1997), although little research on this question has been directed explicitly at the HIPCs. Two re-cent studies (Elbadawi, Ndulu, and Ndung’u 1997; Iyoha 2000) focus on Sub-Saharan Africa, thus in-cluding many of the HIPCs in their analysis. Both studies find that the accumulation of debt over time has deterred investment, although their re-sults do not appear robust: the parameter estimates are unstable and the quantitative impacts small. Moreover, there is some evidence that investors have already taken into account the possible bene-ficial effects of debt relief, so that further increases in investment rates are unlikely to be large.
Collier, Hoeffler, and Pattillo (1999) take a different approach, studying the potential impact of debt relief on repatriation of flight capital. The HIPCs have experienced very large capital out-flows (see also box 2.1) over a prolonged period, presumably the result of inappropriate policies and institutions. Reliable data on capital flight are hard to come by, and so the exercise is somewhat speculative, and the authors do not discuss the time frame in which the response might occur. Nevertheless, the conclusions suggest that debt forgiveness would lower investment risk and could lead to repatriation of capital now held abroad. The amount would vary across countries, depend-ing on risk perceptions and the extent of indebt-edness. For a highly indebted country such as Mozambique, HIPC debt relief might, over time, attract back 50 percent or more of the stock of flight capital, representing an infusion equal to about two-thirds of one year’s gross investment.
The initiative increases the budgetary re-sources available to debtor countries. Proponents argue that debt relief provides direct budget sup-port to recipients and frees resources for increased spending in the social sectors (Sachs and others 1999; International Financial Institution Advisory