Impact of Microfinance on Poverty Reduction: A Case Study of
District Faisalabad
Aisha Imtiaz
Aisha Imtiaz Research scholar of MS Management Sciences COMSATS Institute of Information Technology Lahore, Pakistan. Postal code 54500
E-mail:- aisha.imtiaz@hotmail.com Hafiz Zahid Mehmood
Hafiz Zahid Mehmood, Assistant Professor, COMSATS Institute of Information Technology Lahore, Pakistan Postal code 54500
E-mail:- hzmahmood@hotmail.com Waqar Akram
Waqar Akram, Associate Professor at Department of Business Administration, Institute of Business Administration Sukkur, Sindh, Pakistan. Postal Code (65200)
E-mail: - waqar_shahab1@yahoo.com Muhammad Irfan
Research Officer at Department of Business Administration, Institute of Business Administration Sukkur, Sindh Pakistan. Postal Code (65200)
E-mail:- irfaneconomist@yahoo.com (Corresponding author) Abstract
The micro - finance program extends small loans to very poor people for self-employment projects that generate income, allowing them to care for themselves and for their families. Micro-finance enables an entrepreneur to build a business or expand the existing business and create a better change in their lives. The micro-financing institutions (MFIs) provide the opportunity for the people who are living under the poverty lines by investing the affordable funds/capital and somehow by providing their management expertise. This study shows the effect of micro-financing of small business and the implications for poverty reduction. The respondents are the clients of Khushhali Bank Ltd, District Faisalabad. The data were collected with the help of well-designed and structured questionnaire, which will be analyzed by applying FGT techniques. The results showed that the poverty has been reduced by financing the peoples.
Keywords:Micro finance, poverty, FGT 1. Introduction
The concept of poverty consists of less education, poor livelihood, less facilities of health, and low level of income and consumption and also covers all the social dimensions like isolation, vulnerability, insecurity, powerlessness, social exclusion, gender and environmental disparities. The worst most kind of poverty is when people do not have access to the basic necessities of life like to meet their physical needs. (Hussain and Hanjra, 2003).
Poverty and its ups and downs are difficult to define. It is generally believed that poverty is a dynamic phenomenon. It has a lot of dimensions with respect to time and region. Visconti (2012) stated that poverty takes birth when there is an unequal distribution of wealth, limited access to money, the strong existence of intermediaries, monopolies and lack of democracy. There is no well-established definition of poverty because it is truly dependent on the political situation of the country (Chaudhry, 2003).
1
Economic survey of Pakistan (2009-2010) defines the term poverty as” insufficient necessities for well being resolute by the national poverty line. World bank that is considered as famous income based measure define the term poverty as” a person less than $1is considered as “very poor” and earning between $1 and $2 per day is “ poor” and person that earns more than $2 is considered as non-poor (UNCDF, 2004). Study of Banerjee &Duflo (2007) highlights the living style of the poor. They conducted their research in 13 different countries including Pakistan and stated that in ordinary poor families there is a tendency with respect to more family members. Spending on foods seemed to be a greater portion of monetary expenses in poor families. Health issues are also high in poor families that are truly due to the lack of fresh diet. Only 2 percent of the total budget is being spent on the education while in Pakistan this ratio is little bit high with 1 percent (Banerjee & Duflo, 2007). In Pakistan there are only 4 percent of families that live in their houses to other work locations.
1
Oxford Poverty and Human Development Initiative conducted a survey and found that there is 49.4 percent of the poor in Pakistan. Government of Pakistan has always declared the goal to reduce poverty level in Pakistan. Micro-finance is the extension of micro loans to poor so that they get able to qualify for traditional bank loans.it becomes a famous tool to fight against poverty which enables those without access to lending institutions to borrow at bank rates, and start micro business.
Delgado (2005) defines Micro financing is a practice to extend the small loans to the poor entrepreneur to generate money which allows them to take care of their families in a better way and it also includes the other financial services like insurance and savings etc. The major reason of poverty is that there is not a direct and easy approach to credit in the developing countries. It is found that due to non-availability of collaterals and the high cost of processing the credit becomes major cause of poverty.
This study examined the impact of microfinance loan on poverty as well as answer the following question. 1.1 Research question:
How effective is the micro-finance approach in poverty reduction? 1.2 Objective of the Study:
1. Examine the poverty level from different aspects in different variables. 2. Suggest policy measures for improving the program.
2. Literature Review
Review of literature put a light on the pervious work on this issue, it helped us to understand the impact of small loan on poverty reduction.
Chandarsekar & Parkash, (2010) ; Mayoux (2001) found in their study that the microfinance has a great impact and a positive contribution towards the women empowerment, education of children, health facilities and other socioeconomic factors of the poor community. Hossain (2012) concluded in his study that microfinance reduced the poverty level from the Pakistan country. It was found that the people who borrowed loan from the bank had an increase in their income and their expenditure after utilizing the loan.
Imai et al., (2010) took the data of 99 countries and used regression analysis to check the impact of microfinance on poverty level. They found that microfinance scheme reduces the poverty level. Remenyi (1991) it deemed the provision of credit as the most powerful instrument against poverty. They concluded that small loans are helpful for the poor to make them economically independent.
Meyer (2002) also concluded similar results. His research in Asian countries concluded that as a whole microfinance positive effect on the education of the poor families and their income too but other results differ due the population and country size. Most of the studies show that microfinance scheme has a positive impact on poor’s life. Alhassan & Akudugu (2012) represented that microcredit programs can eliminate poverty but it was unable to show considerable effect on women’s financial status due to specific limitations which do not allow the conversion of the structural basis of poverty.
Rahman (2010) reported that in Bangladesh all operating MF institutions do not care about the ethical and moral norms of the poor’s. Borrowed money is usually spent for their needs such as the marriage of their children and repairing of houses etc. Therefore proper supervision is needed to create the sense of ethical and moral values and also need to peruse them to use loans only for earning activities.
Abbas (2005) studied and empirically analyzed income generating and poverty reduction role of micro finance through regression and correlation methods. The empirical evidence showed that there is a positive impact of micro finance on income and consumption smoothening provided it is utilized in a rational way. The microfinance being utilized in the most appropriate manners to reduce the poverty in the community.
3. Methodology
(Bedson, 2009) says that there is a lot of work is needed in the field of microfinance to introduce a well-defined and a crystal clear framework for assessing the impact of microfinance. As different studies are emerging on impact assessment of microfinance, they are using different frameworks and parameters to assess impact of microfinance. The difference in framework is due to the fact that studies come from different backgrounds i.e. individual researchers, stakeholders, investors, donors or government. We are applying FGT technique to check the impact of loan on poverty.
3.1 Population
Khushhali Bank Ltd, Faisalabad branch is selected to execute the accurate study. A complete list of all the clients of K.B is taken from the bank officials and the respondents were selected through systematic random sampling method. The total numbers of borrowers were 5000 we restrict our population according to distance and microphones only. The distance radius were declared 15 kilometers and loan was restricted only PKRS 10000 owing to this our population shrinks to 1300 borrowers.
3.1 Sample
Number of clients play significant role to the validity of any scientific research endeavor. The data gathered from 200 respondents that was 15 percent of the total population. The required information was collected through
interviewing schedule, by using face-to-face survey method. The information thus, collected is tabulated and analyzed by using appropriate statistical techniques in order to arrive at logical conclusions.
3.1.1 Data analysis tools
Following techniques are applied for analyzing the data using SPSS 16 and Excel 2007, 2010 3.2 Foster, Greer and Thorbeckemeasures (FGT) of poverty
3.3 Defining poverty line:
An international poverty line of 1.25$/capita/day is taken. Dhongde and Minoiu (2001) stated in their study that the poverty lines are used on an international level to estimate the poverty level range from $1/ day to $2.5/day.World bank calculated poverty line of $ 1.25 which was based on the Purchang Power Parity (PPPs) of 2005 (Dhongde & Minoiu, 2001). For this purpose, we took an average rate of dollar for Pakistani rupee that was estimated PKR 5960 per capita per month.
In order to detect whether the level of poverty has been reduced over time or not; Foster, Greerand Thorbecke (Foster et al., 1984) poverty measures are employed to estimate the incidence of poverty (Head Count Ratio), depth of poverty (Squared Poverty) and severity of poverty (Squared Poverty Gap) in selected institutions. It is World Bank recommended measures and is used in a great number of studies. In their research study, Shinkai et al. (2007) utilize FGT class of measures to estimate the incidence, depth, and severity of poverty. In the book “Poverty Impact Analysis: Selected Tools and Applications” by the Asian Development bank, Foster, Greer and Thorbecke class of poverty measure is reported as the most common and widely used measure of poverty (ADB, 2007).
Headcount Index
It is the proportion of the population whose consumption (y) is less than the poverty line. Po = Np / N
Where
Po = proportion of poor population Np = number of poor
N=total population
Poverty Gap Index (PG)/ Intensity of poverty
It is the aggregate shortfall of the poor relative to the poverty line. The income required to bring all the poor above the poverty line. It takes into account the average income of the poor and its distance from the poverty line.
(
)
1 1 1 1 q Z Y i P P G n Z i − = = ∑ = Squared Poverty Gap Index (SPG)/ severity of poverty.
It is the mean of the squared proportionate poverty gap. It reflects severity of poverty. It shows income inequality among the poor.
(
)
2
1
2
1
q
Z Y
i
P
PG
n
Z
i
−
=
=
∑
=
Z= poverty lineYi = income or consumption (welfare indicator) below poverty line q = Number of poor respondents
n = Total number of respondents α= reflects poverty aversion
P2 is also a high order measure of poverty that captures the distributional changes within the poor segment of the population which the P1 cannot quantify.
Squared poverty gap index is the weighted sum of poverty gaps and it takes the inequality among the poor into account. It tells us about the distribution of welfare or difference in income level among the poor (Makoka & Kaplan, 2005). It tells about the distance of the poor from the poverty line. This measure is important because Poverty Gap does not tell about the distributional changes in the income of the poor (Makoka & Kaplan, 2005). It puts more weight on those observations that fall below the poverty line which means it gives more weight to the poor as compare to the poor. Simply defining, higher weight is put on the households who are more away from the poverty line. (The World Bank, n.d.). It is a weighted sum of poverty gaps and it takes the inequality among the poor into account. It is in contrast with the poverty gap index, where they are weighted equally. In squared poverty gap (SPG), the ratio of weights is proportional to base income. Lower value of SPG shows that most of the poor in the study are clustered around the poverty line.
4. Results and Discussion
The result of FGT showed the poverty situation of the respondents. All the components of the FGT were calculated in percentage and given in the below table.
4.1 Calculation of FGT
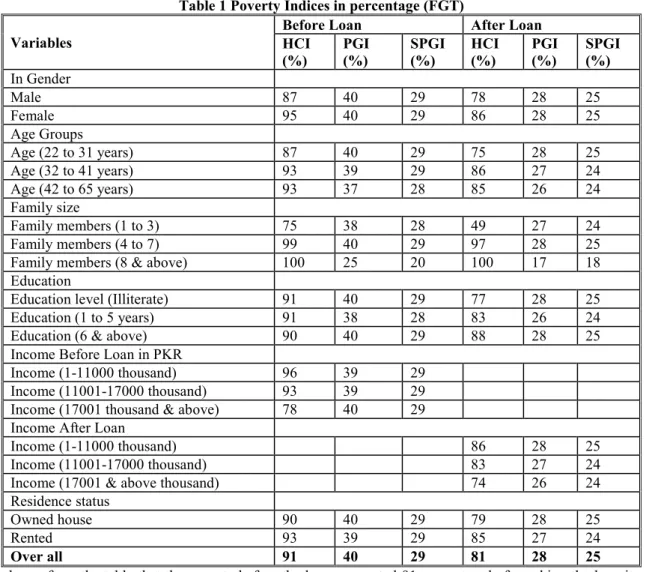
Table 1 Poverty Indices in percentage (FGT) Variables
Before Loan After Loan HCI (%) PGI (%) SPGI (%) HCI (%) PGI (%) SPGI (%) In Gender Male 87 40 29 78 28 25 Female 95 40 29 86 28 25 Age Groups Age (22 to 31 years) 87 40 29 75 28 25 Age (32 to 41 years) 93 39 29 86 27 24 Age (42 to 65 years) 93 37 28 85 26 24 Family size Family members (1 to 3) 75 38 28 49 27 24 Family members (4 to 7) 99 40 29 97 28 25
Family members (8 & above) 100 25 20 100 17 18 Education
Education level (Illiterate) 91 40 29 77 28 25
Education (1 to 5 years) 91 38 28 83 26 24
Education (6 & above) 90 40 29 88 28 25
Income Before Loan in PKR
Income (1-11000 thousand) 96 39 29 Income (11001-17000 thousand) 93 39 29 Income (17001 thousand & above) 78 40 29 Income After Loan
Income (1-11000 thousand) 86 28 25
Income (11001-17000 thousand) 83 27 24
Income (17001 & above thousand) 74 26 24
Residence status
Owned house 90 40 29 79 28 25
Rented 93 39 29 85 27 24
Over all 91 40 29 81 28 25
As shown from the table that the poverty before the loan was noted 91 percent and after taking the loan it was reduced by 10 percent and reached to 81 percent. The Poverty Gap was noted reduced from 40 to 28 percent as well as the severity of poverty was also noted reduced from 29 to 25 percent.
The Head Count Index before the loan for males was noted 87 percent and after taking loan it reduced to 78 percent. Similarly for females before taking loan it was noted 95 percent and after taking loan it reduced to 86 percent. The depth of Poverty for male and females were noted 40 percents well as the severity of poverty was also noted same for male and female 25 percent.
The first age group that was between 22 to 31 years, was noted 87 percent poor while the poverty index reduced after taking loan to 75 percent. The depth of poverty for age interval 22 to 31 years reduced from 40 to 28 percent as well as the severity of Poverty was also reduced from 29 to 25 percent. The poverty index in second age group from 32 to 41 years declined from 93 to 86 percent. The depth of poverty in this group declined from 39 to 27 percent as well as the severity of poverty also decreased from 29 to 24 percent. Before loan the poverty index in the third age group that was between 42 to 65 years was noted 93 percent it reduced to 85 percent after taking loan. The depth of poverty was noted 37 percent before and it also reduced to 26 percent after taking loan. The severity of poverty also declined from 28 to 24 percent.
It was noted that family size puts a significant impact on poverty, it was noted that as the family size increases the poverty index also increases no matter it was before taking loan or after taking the loan. Though the results shown that before taking loan it was severed and after taking loan it reduces a little. The first group of family size that was between 1 to 3 members was noted 75 percent poor before taking a loan and the poverty index reduced from this family size to 49 percent after taking loan. The depth of poverty for this family size group was reduced from 38 to 27 percent as well as the squared poverty gap also declined from 28 to 24 percent. The poverty index for the second family size group that lie between 4 to 7 members was noted 99 percent before
taking a loan and after taking a loan the poverty index reduced to 97 percent. The poverty gap reduced to 40 to 28 percent and the squared poverty gap also reduced from 29 to 25 percent for this family size group. The third family size group that had 8 and more than 8 members was noted 100 percent poor before taking a loan and astonishingly it was not reduced after taking loan it remained the same. The severity of poverty before taking loan was noted 25 percent and it reduced to 17 percent. The squared poverty gap was noted 20 percent before taking the loan and it also reduced to 18 percent after taking loan for this family size group.
Education relate to poverty negatively, as education goes up it was noted that poverty reduced especially after taking the loan. The first group of education that had no formal education was noted 91 percent poor before taking the loan the poverty index reduced to 77 percent after taking the loan. The poverty gap in this educational group was noted 40 percent and it reduced to 28 percent. The squared poverty gap in this group was also reduced from 29 to 25 percent. The educational group that contains 1 to 5 years of education was noted 91 percent poor before getting the loan and it reduced to 83 percent after getting the loan. The poverty gap index for this group was noted 38 percent before loan and it reduced to 26 percent. The squared poverty gap also reduced from 28 to 24 percent. The third educational group includes the 6 and more than 6 years of education. The poverty index for this group was noted 90 percent before loan and it shrunk to 88 percent after getting the loan. The poverty gap index for this group was noted 40 percent before loan and it reduced to 28 percent after loan. The squared poverty gap index for this group reduced from 29 to 25 percent.
Income also categorized into 3 categories although it was categorized according to the frequency data set. It was noted that the higher income group has lower poverty. The first income group consists of 1 to 11000 Pakistani rupees, the peoples who lie in this group was noted 96 percent poor before taking the loan and in reduced to 86 percent after taking the loan. The depth of poverty was noted 39 percent and it reduced to 28 percent. The depth of poverty was also reduced from 29 to 25 percent for this income group. The second income group covers 11001 to 17000 Pakistani rupees, the poverty index for this income group was noted 93 percent before loan and it reduced to 83 percent after taking the loan. The poverty gap index showed that 39 percent peoples are suffering from poverty and it reduced to 27 percent for this income group. The squared poverty gap index was also reduced from 29 to 24 percent. The third income group was noted 78 percent poor before loan and it reduced to 74 percent after taking the loan. The poverty gap index was noted 40 percent and it reduced to 26 percent similarly the severity of poverty was also reduced from 29 to 24 percent for this income group.
The respondents who had their own residence were noted lesser poor as compared to those peoples who had rented houses. The poverty index for those respondents who had their own house was noted 90 percent and it reduced to 79 percent after taking the loan. The poverty gap index was noted 40 percent and it reduced to 28 percent after taking the loan. The squared poverty gap index was noted 29 percent and it reduced to 25 percent after getting the loan. The poverty index for rented house respondents was noted 93 percent and it reduced to 85 percent after taking the loan. The depth of poverty was noted 39 percent and it reduced to 27 percent after taking the loan. The severity of poverty was noted 29 percent and it reduced to 24 percent after getting the loan. 5. Conclusion
The FGT (Foster, Greer and Thorbecke Model) was applied and it was found that the poverty has been reduced after taking the loan.
All the components of FGT were estimated like HCI (Heah Count Index), PGI (Poverty Gap Index) and SPGI (Saqured Poverty Gap Index). It was noted that poverty before taking loan was higher and it reduced in those respondents who had taken the loan as shown from the table. The poverty in all the variables were estimated and it was noted that poverty had been reduced from the small loans. These results were harmonizing with Imai et al., (2010); Meyer (2002). Chandarsekar&Parkash, (2010) ; Mayoux, (2001); Hossain, (2012) and many others 5.1 Policy recommendations
• More loan at lower interest rate should be introduced to alleviate the poverty
• Sufficient steps should be taken to recover the borrowed amount so that in the future better borrowing could be made.
References
Abbas, F, et al. (2005). Microfinance Route to Income Generation and Poverty Reduction: Evidence from District Faisalabad, Pakistan. Journal Of Agriculture & Social Sciences, 1(2).
Alhassan, A.R., & Akudugu, M. A. (2012). Impact of Microcredit on Income Generation Capacityof Women in the Tamale Metropolitan Area of Ghana. Journal of Economics and Sustainable Development, 3 (5): 41-48. Banerjee, A. V., & Duflo, E. (2007). The Economic Lives of the Poor. Journal of Economic Perspectives, 21(1): 141-167.
Bedson, J. (2009). Microfinance in Asia: Trends, Challenges and Opportunities. Queensland, Australia: The Foundation for Development Cooperati
empowerment and poverty eradication in Kerala. APJRBM, 1(2):
Chaudhry, I. S. (2003). An Empirical Analysis of the Determinants of Rural Poverty in Pakistan: A Case Study of Bahawalpur District with Special Reference to Cholistan. Unpublished Ph.D. Thesis, TheIslamia University of Bahawalpur: Pakistan. Available at: http://eprints.hec.gov.pk/1017/
Delgado, E. (2005). Group lending: learning from the international experience. Urban & Regional Planning Economic Development Handbook. Taubman College of Architecture and Urban Planning, University of Michigan. Urban & Economic Journal, 117(517): 1-10.
Hossain, M. K. (2012). Measuring the Impact of BRAC Microfinance Operations: A Case Study of a village. International Business Research, 5(4).
Hussain, M.A and Hanjra (2003).Does irrigation water matter for rural poverty alleviation? Evidence from South and South-East Asia.Water policy, 2003.IBF Net(P) Limited, India.
Imai, K.S., Gaiha, R., Thapa, G., &Annim, S.K. (2010). Micro-finance and Poverty (A Macro Perspective). Research Institute for Economics and Business Administration Kobe University (Discussion Paper Series), 1-45.) Makoka, D., & Kaplan, M. (2005). Poverty and vulnerability. Term Paper. Bonn, Germany: University of Bonn. Mayoux, L. (2001a). Impact Assessment of Micro – Finance: Towards a Sustainable Learning Process. Paper Produced from the DFID Enterprise Development Impact Assessment Information Service (EDIAIS) website: www.enterprise-impact@org.uk
Meyer, R. (2002). Track Record of Financial Institutions Assisting the Poor in Asia. ADBInstitute Research Paper No. 49. Manila.
Rahman, M. M. (2010). Islamic micro-finance programme and its impact on rural poverty alleviation. International Journal of Banking and Finance, 7 (1): 119-138.
Remenyi, F. 1991. Where Credit is Due: Income Generating Programmes for the Poor in developing countries, London: Intermediate Technology Publication.
Visconti (2012) A Survey on Microfinance for Developing Countries: A Social Responsible Investment Opportunity,April 10, 2012
More information about the firm can be found on the homepage:
http://www.iiste.org
CALL FOR JOURNAL PAPERS
There are more than 30 peer-reviewed academic journals hosted under the hosting
platform.
Prospective authors of journals can find the submission instruction on the
following page:
http://www.iiste.org/journals/
All the journals articles are available
online to the readers all over the world without financial, legal, or technical barriers
other than those inseparable from gaining access to the internet itself. Paper version
of the journals is also available upon request of readers and authors.
MORE RESOURCES
Book publication information: http://www.iiste.org/book/
Recent conferences: http://www.iiste.org/conference/
IISTE Knowledge Sharing Partners
EBSCO, Index Copernicus, Ulrich's Periodicals Directory, JournalTOCS, PKP Open
Archives
Harvester,
Bielefeld
Academic
Search
Engine,
Elektronische
Zeitschriftenbibliothek EZB, Open J-Gate, OCLC WorldCat, Universe Digtial
Library , NewJour, Google Scholar