Documents de Travail du
Centre d’Economie de la Sorbonne
Maison des Sciences Économiques, 106-112 boulevard de L'Hôpital, 75647 Paris Cedex 13
Firm growth : a survey
Alex COAD
2007.24
Firm Growth: A Survey
∗
Alex Coad
a b c†a
Max Planck Institute of Economics, Jena, Germany
b
Centre d’Economie de la Sorbonne,
Equipe MATISSE, Univ. Paris 1 – CNRSc
LEM, Sant’Anna School of Advanced Studies, Pisa, Italy
May 14, 2007
Abstract
We survey the phenomenon of the growth of firms drawing on literature from economics, management, and sociology. We begin with a review of empirical ‘stylised facts’ before discussing theoretical contributions. Firm growth is characterized by a predominant stochastic element, making it difficult to predict. Indeed, previous empirical research into the determinants of firm growth has had a limited success. We also observe that theoretical propositions concerning the growth of firms are often amiss. We conclude that progress in this area requires solid empirical work, perhaps making use of novel statistical techniques.
La croissance des firmes: une revue de la litt´erature
R´esum´e: Nous faisons une revue de la littrature sur la croissance des firmes, en nous basant sur des travaux dconomie, de management, et de sociologie. Nous commenons par les faits styliss empiriques avant de discuter les contributions thoriques. La croissance des firmes est surtout marque par le hasard, ce qui la rend difficile prdire. Effectivement, la recherche empirique rcente qui essaie de dceler les dterminants de la croissance des firmes na eu quun succs limit. Nous observons aussi que les propositions thoriques concernant la croissance des firmes ont souvent t loignes de la ralit. Nous concluons que pour progresser, ce domaine a besoin de travaux empiriques solides, faisant appel de nouvelles techniques statistiques.
JEL codes: L25, L11
Keywords: Firm Growth, Size Distribution, Growth Rates Distribution, Gibrat’s Law,
Theory of the Firm, Diversification, ‘Stages of Growth’ models.
Mots cl´es: Croissance des firmes, distribution de taille, distribution des taux de croissance,
loi de Gibrat, th´eorie de la firme, diversification, croissance par ´etapes
∗I thank Giulio Bottazzi, Giovanni Dosi, Hafida El-Younsi, Jacques Mairesse, Bernard Paulr´e, Rekha Rao,
Angelo Secchi and Ulrich Witt for helpful comments. Nevertheless, I am solely responsible for any errors or confusion that may remain. This version: May 2007
†Corresponding Author: Alex Coad, Max Planck Institute of Economics, Evolutionary Economics Group,
Kahlaische Strasse 10, D-07745 Jena, Germany. Phone: +49 3641 686822. Fax: +49 3641 686868. E-mail:
coad@econ.mpg.de
Contents
1 Introduction 3
2 Empirical evidence on firm growth 3
2.1 Size and growth rates distributions . . . 4
2.1.1 Size distributions . . . 4
2.1.2 Growth rates distributions . . . 5
2.2 Gibrat’s Law . . . 9
2.2.1 Gibrat’s model . . . 9
2.2.2 Firm size and average growth . . . 11
2.2.3 Firm size and growth rate variance . . . 14
2.2.4 Autocorrelation of growth rates . . . 15
2.3 Other determinants of firm growth . . . 18
2.3.1 Age . . . 18
2.3.2 Innovation . . . 19
2.3.3 Financial performance . . . 23
2.3.4 Relative productivity . . . 25
2.3.5 Other firm-specific factors . . . 26
2.3.6 Industry-specific factors . . . 28
2.3.7 Macroeconomic factors . . . 29
3 Theoretical contributions 30 3.1 Neoclassical foundations – growth towards an ‘optimal size’ . . . 31
3.2 Penrose’s ‘Theory of the Growth of the Firm’ . . . 32
3.3 Marris and ‘managerialism’ . . . 34
3.4 Evolutionary Economics and the principle of ‘growth of the fitter’ . . . 35
3.5 Population ecology . . . 38
4 Growth strategies 39 4.1 Attitudes to growth . . . 39
4.1.1 The desirability of growth . . . 40
4.1.2 Is growth intentional or does it ‘just happen’ ? . . . 43
4.2 Growth strategies – replication or diversification . . . 44
4.2.1 Growth by replication . . . 45
4.2.2 Growth by diversification . . . 46
4.3 Internal growth vs growth by acquisition . . . 49
5 Growth of small and large firms 51 5.1 Differences in growth patterns for small and large firms . . . 51
5.2 Modelling the ‘stages of growth’ . . . 53
6 Conclusion 56
1
Introduction
The aim of this survey is to provide an overview of research into the growth of firms, while also highlighting areas in need of further research. It is a multidisciplinary survey, drawing on contributions made in economics, management and also sociology.
There are many different measures of firm size, some of the more usual indicators being employment, total sales, value-added, total assets, or total profits; and some of the less con-ventional ones such as ‘acres of land’ or ‘head of cattle’ (Weiss, 1998). In this survey we consider growth in terms of a range of indicators, although we devote little attention to the growth of profits (this latter being more of a financial than an economic variable).
There are also different ways of measuring growth rates. Some authors (such as Delmar et al., 2003) make the distinction between relative growth (i.e. the growth rate in percentage terms) and absolute growth (usually measured in the absolute increase in numbers of employ-ees). In this vein, we can mention the ‘Birch index’ which is a weighted average of both relative and absolute growth rates (this latter being taken into account to emphasize that large firms, due to their large size, have the potential to create many jobs). This survey focuses on relative growth rates only. Furthermore, in our discussion of the processes of expansion we emphasize positive growth and not so much negative growth.1
In true Simonian style,2 we begin with some empirical insights in Section 2, considering
first the distributions of size and growth rates, and moving on to look for determinants of growth rates. We then present some theories of firm growth and evaluate their performance in explaining the stylised facts that emerge from empirical work (Section 3). In Section 4 we consider the demand and supply sides of growth by discussing the attitudes of firms towards growth opportunities as well as investigating the processes by which firms actually grow (growth by ‘more of the same’, growth by diversification, growth by acquisition). In Section 5 we examine the differences between the growth of small and large firms in greater depth. We also review the ‘stages of growth’ models. Section 6 concludes.
2
Empirical evidence on firm growth
To begin with, we take a non-parametric look at the distributions of firm size and growth rates, before moving on to results from regressions that investigate the determinants of growth rates.
1For an introduction to organizational decline, see Whetten (1987).
2See in particular Simon (1968).
2.1
Size and growth rates distributions
A suitable starting point for studies into industrial structure and dynamics is the firm size distribution. In fact, it was by contemplating the empirical size distribution that Robert Gibrat (1931) proposed the well-known ‘Law of Proportionate Effect’ (also known as ‘Gibrat’s law’).
We also discuss the results of research into the growth rates distribution. The regular-ity that firm growth rates are approximately exponentially distributed was discovered only recently, but offers unique insights into the growth patterns of firms.
2.1.1 Size distributions
The observation that the firm-size distribution is positively skewed proved to be a useful point of entry for research into the structure of industries. (See Figures 1 and 2 for some examples of aggregate firm size distributions.) Robert Gibrat (1931) considered the size of French firms in terms of employees and concluded that the lognormal distribution was a valid heuristic. Hart and Prais (1956) presented further evidence on the size distribution, using data on quoted UK firms, and also concluded in favour of a lognormal model. The lognormal distribution, however, can be viewed as just one of several candidate skew distributions. Although Simon and Bonini (1958) maintained that the “lognormal generally fits quite well” (1958: p611), they preferred to consider the lognormal distribution as a special case in the wider family of ‘Yule’ distributions. The advantage of the Yule family of distributions was that the phenomenon of arrival of new firms could be incorporated into the model. Steindl (1965) applied Austrian data to his analysis of the firm size distribution, and preferred the Pareto distribution to the lognormal on account of its superior performance in describing the upper tail of the distribution. Similarly, Ijiri and Simon (1964, 1971, 1974) apply the Pareto distribution to analyse the size distribution of large US firms.
Efforts have been made to discriminate between the various candidate skew distributions. One problem with the Pareto distribution is that the empirical density has many more middle-sized firms and fewer very large firms than would be theoretically predicted (Vining, 1976). Other research on the lognormal distribution has shown that the upper tail of the empirical size distribution of firms is too thin relative to the lognormal (Stanley et al., 1995). Quandt (1966) compares the performance of the lognormal and three versions of the Pareto distribution, using data disaggregated according to industry. He reports the superiority of the lognormal over the three types of Pareto distribution, although each of the distributions produces a best-fit for at least one sample. Furthermore, it may be that some industries (e.g. the footwear industry) are not fitted well by any distribution.
More generally, Quandt’s results on disaggregated data lead us to suspect that the
larities of the firm-size distribution observed at the aggregate level do not hold with sectoral disaggregation. Silberman (1967) also finds significant departures from lognormality in his analysis of 90 four-digit SIC sectors. It has been suggested that, while the firm size distribu-tion has a smooth regular shape at the aggregate level, this may merely be due to a statistical aggregation effect rather than a phenomenon bearing any deeper economic meaning (Dosi et al, 1995; Dosi, 2007). Empirical results lend support to these conjectures by showing that the regular unimodal firm size distributions observed at the aggregate level can be decomposed into much ‘messier’ distributions at the industry level, some of which are visibly multimodal (Bottazzi and Secchi, 2003; Bottazzi et al., 2005). For example, Bottazzi and Secchi (2005) present evidence of significant bimodality in the firm size distribution of the worldwide phar-maceutical industry, and relate this to a cleavage between the industry leaders and fringe competitors.
Other work on the firm-size distribution has focused on the evolution of the shape of the distribution over time. It would appear that the initial size distribution for new firms is particularly right-skewed, although the log-size distribution tends to become more symmetric as time goes by. This is consistent with observations that small young firms grow faster than their larger counterparts. As a result, it has been suggested that the log-normal can be seen as a kind of ‘limit distribution’ to which a given cohort of firms will eventually converge. Lotti and Santarelli (2001) present support for this hypothesis by tracking cohorts of new firms in several sectors of Italian manufacturing. Cabral and Mata (2003) find similar results in their analysis of cohorts of new Portuguese firms. However, Cabral and Mata interpret their results by referring to financial constraints that restrict the scale of operations for new firms, but become less binding over time, thus allowing these small firms to grow relatively rapidly and reach their preferred size. They also argue that selection does not have a strong effect on the evolution of market structure.
Although the skewed nature of the firm size distribution is a robust finding, there may be some other features of this distribution that are specific to countries. Table 1, taken from Bartelsman et al. (2005), highlights some differences in the structure of industries across countries. Among other things, one observes that large firms account for a considerable share of French industry, whereas in Italy firms tend to be much smaller on average. (These international differences cannot simply be attributed to differences in sectoral specialization across countries.)
2.1.2 Growth rates distributions
It has long been known that the distribution of firm growth rates is fat-tailed. In an early con-tribution, Ashton (1926) considers the growth patterns of British textile firms and observes
T able 1: The imp ortance of small firms (i.e. firms with few er than 20 emplo yees) across broad sectors and coun tries, 1989-94 Absolute num b er (%) Share of emplo ymen t (%) Av e. No. Emplo yees p er firm T otal econom y Man ufacturing Business services T otal econom y Man ufacturing Business services T otal econom y Man ufacturing Business services US 86.7 69.9 87.9 16.6 5.8 20.6 26.4 80.3 21.4 W estern German y 87.9 77.9 90.2 23.6 11.3 33.8 17.0 39.1 11.5 F rance 78.6 73.6 78.8 13.9 17.0 12.1 33.5 32.1 35.7 Italy 93.1 87.5 96.5 34.4 30.3 46.3 10.5 15.3 6.8 UK -74.9 -8.3 -40.7 -Canada -12.7 40.5 12.0 Denmark 90.0 74.0 90.8 30.2 16.1 33.4 13.3 30.4 12.7 Finland 92.6 84.8 94.5 25.8 13.0 33.0 13.0 27.8 9.9 Netherlands 95.8 86.7 96.8 31.2 16.9 41.9 6.5 18.3 5.3 P ortugal 86.3 70.5 92.8 27.7 15.7 39.8 16.8 31.0 11.4 Source: Bartelsman et al. (2005: T ables 2 and 3). Notes: the columns lab elled ‘share of emplo ymen t’ refer to the emplo ymen t share of firms with few er than 20 emplo yees.
1e-04 0.001 0.01 0.1 1 -4 -2 0 2 4 6 Pr s 1998 2000 2002
Figure 1: Kernel estimates of the density of firm size (total sales) in 1998, 2000 and 2002, for French manufacturing firms with more than 20 employees. Source: Bottazzi et al., 2005.
Figure 2: Probability density function of the sizes of US manufacturing firms in 1997. Source: Axtell, 2001.
that “In their growth they obey no one law. A few apparently undergo a steady expan-sion. . . With others, increase in size takes place by a sudden leap” (Ashton 1926: 572-573). Little (1962) investigates the distribution of growth rates, and also finds that the distribution is fat-tailed. Similarly, Geroski and Gugler (2004) compare the distribution of growth rates to the normal case and comment on the fat-tailed nature of the empirical density. Recent empir-ical research, from an ‘econophysics’ background, has discovered that the distribution of firm growth rates closely follows the parametric form of the Laplace density. Using the Compustat database of US manufacturing firms, Stanley et al. (1996) observe a ‘tent-shaped’ distribution on log-log plots that corresponds to the symmetric exponential, or Laplace distribution (see also Amaral et al. (1997) and Lee et al. (1998)). The quality of the fit of the empirical dis-tribution to the Laplace density is quite remarkable. The Laplace disdis-tribution is also found to be a rather useful representation when considering growth rates of firms in the worldwide pharmaceutical industry (Bottazzi et al., 2001). Giulio Bottazzi and coauthors extend these findings by considering the Laplace density in the wider context of the family of Subbotin dis-tributions (beginning with Bottazzi et al., 2002). They find that, for the Compustat database, the Laplace is indeed a suitable distribution for modelling firm growth rates, at both aggregate and disaggregated levels of analysis (Bottazzi and Secchi 2003a). The exponential nature of the distribution of growth rates also holds for other databases, such as Italian manufacturing (Bottazzi et al. (2007)). In addition, the exponential distribution appears to hold across a variety of firm growth indicators, such as Sales growth, employment growth or Value Added growth (Bottazzi et al., 2007). The growth rates of French manufacturing firms have also been studied, and roughly speaking a similar shape was observed, although it must be said that the empirical density was noticeably fatter-tailed than the Laplace (see Bottazzi et al., 2005).3
3The observed subbotinbparameter (the ‘shape’ parameter) is significantly lower than the Laplace value of
1. This highlights the importance of following Bottazziet al. (2002) and considering the Laplace as a special
0.001 0.01 0.1 1 -3 -2 -1 0 1 2 prob.
conditional growth rate 1998 2000 2002
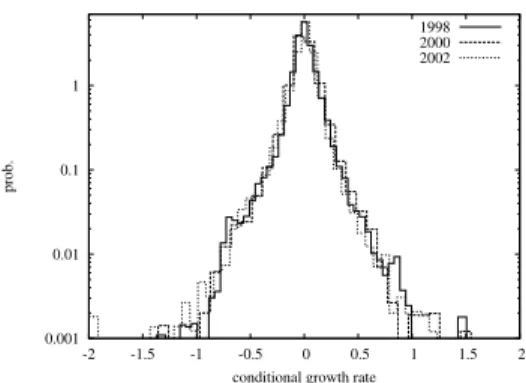
Figure 3: Distribution of sales growth rates of French manufacturing firms. Source: Bot-tazzi et al., 2005. 0.001 0.01 0.1 1 -2 -1.5 -1 -0.5 0 0.5 1 1.5 2 prob.
conditional growth rate 1998 2000 2002
Figure 4: Distribution of employment growth rates of French manufacturing firms. Source: Coad, 2006b.
Research into Danish manufacturing firms presents further evidence that the growth rate dis-tribution is heavy-tailed, although it is suggested that the disdis-tribution for individual sectors may not be symmetric but right-skewed (Reichstein and Jensen (2005)). Generally speaking, however, it would appear that the shape of the growth rate distribution is more robust to disaggregation than the shape of the firm size distribution. In other words, whilst the smooth shape of the aggregate firm size distribution may be little more than a statistical aggregation effect, the ‘tent-shapes’ observed for the aggregate growth rate distribution are usually still visible even at disaggregated levels (Bottazzi and Secchi, 2003a; Bottazzi et al., 2005). This means that extreme growth events can be expected to occur relatively frequently, and make a disproportionately large contribution to the evolution of industries.
Figures 3 and 4 show plots of the distribution of sales and employment growth rates for French manufacturing firms with over 20 employees.
Although research suggests that both the size distribution and the growth rate distribution are relatively stable over time, it should be noted that there is great persistence in firm size but much less persistence in growth rates on average (more on growth rate persistence is presented in Section 2.2.4). As a result, it is of interest to investigate how the moments of the growth rates distribution change over the business cycle. Indeed, several studies have focused on these issues and some preliminary results can be mentioned here. It has been suggested that the variance of growth rates changes over time for the employment growth of large US firms (Hall, 1987) and that this variance is procyclical in the case of growth of assets (Geroski et al., 2003). This is consistent with the hypothesis that firms have a lot of discretion in their growth rates of assets during booms but face stricter discipline during recessions. Higson et al. (2002, 2004) consider the evolution of the first four moments of distributions of the growth of sales, for large US and UK firms over periods of 30 years or more. They observe that higher moments of the distribution of sales growth rates have significant cyclical patterns. In
case in the Subbotin family of distributions.
particular, evidence from both US and UK firms suggests that the variance and skewness are countercyclical, whereas the kurtosis is pro-cyclical. Higson et al. (2002: 1551) explain the counter-cyclical movements in skewness in these words:
“The central mass of the growth rate distribution responds more strongly to the aggregate shock than the tails. So a negative shock moves the central mass closer to the left of the distribution leaving the right tail behind and generates positive skewness. A positive shock shifts the central mass to the right, closer to the group of rapidly growing firms and away from the group of declining firms. So negative skewness results.”
The procyclical nature of kurtosis (despite their puzzling finding of countercyclical variance) emphasizes that economic downturns change the shape of the growth rate distribution by reducing a key parameter of the ‘spread’ or ‘variation’ between firms.
2.2
Gibrat’s Law
Gibrat’s law continues to receive a huge amount of attention in the empirical industrial orga-nization literature, more than 75 years after Gibrat’s (1931) seminal publication.
We begin by presenting the ‘Law’, and then review some of the related empirical literature. We do not attempt to provide an exhaustive survey of the literature on Gibrat’s law, because the number of relevant studies is indeed very large. (For other reviews of empirical tests of Gibrat’s Law, the reader is referred to the survey by Lotti et al (2003); for a survey of how Gibrat’s law holds for the services sector see Audretsch et al. (2004).) Instead, we try to provide an overview of the essential results. We investigate how expected growth rates and growth rate variance are influenced by firm size, and also investigate the possible existence of patterns of serial correlation in firm growth.
2.2.1 Gibrat’s model
Robert Gibrat’s (1931) theory of a ‘law of proportionate effect’ was hatched when he observed that the distribution of French manufacturing establishments followed a skew distribution that resembled the lognormal. Gibrat considered the emergence of the firm-size distribution as an outcome or explanandum and wanted to see which underlying growth process could be responsible for generating it.
In its simplest form, Gibrat’s law maintains that the expected growth rate of a given firm is independent of its size at the beginning of the period examined. Alternatively, as Mansfield (1962: 1030) puts it, “the probability of a given proportionate change in size during a specified
period is the same for all firms in a given industry – regardless of their size at the beginning of the period.”
More formally, we can explain the growth of firms in the following framework. Let xt
be the size of a firm at time t, and let εt be random variable representing an idiosyncratic,
multiplicative growth shock over the period t−1 to t. We have
xt−xt−1 =εtxt−1 (1)
which can be developed to obtain
xt= (1 +εt)xt−1 =x0(1 +ε1)(1 +ε2). . .(1 +εt) (2)
It is then possible to take logarithms in order to approximate log(1 +εt) by εt to obtain4
log(xt)≈log(x0) +ε1+ε2+. . .+εt= log(x0) +
t
X
s=1
εs (3)
In the limit, as t becomes large, the log(x0) term will become insignificant, and we obtain
log(xt)≈ t
X
s=1
εs (4)
In this way, a firm’s size at timet can be explained purely in terms of its idiosyncratic history of multiplicative shocks. If we further assume that all firms in an industry are independent realizations of i.i.d. normally distributed growth shocks, then this stochastic process leads to the emergence of a lognormal firm size distribution.
There are of course several serious limitations to such a simple vision of industrial dynamics. We have already seen that the distribution of growth rates is not normally distributed, but instead resembles the Laplace or ‘symmetric exponential’. Furthermore, contrary to results implied by Gibrat’s model, it is not reasonable to suppose that the variance of firm size tends to infinity (Kalecki, 1945). In addition, we do not observe the secular and unlimited increase in industrial concentration that would be predicted by Gibrat’s law (Caves, 1998). Whilst a ‘weak’ version of Gibrat’s law merely supposes that expected growth rate is independent of firm size, stronger versions of Gibrat’s law imply a range of other issues. For example, Chesher (1979) rejects Gibrat’s law due to the existence of an autocorrelation structure in the growth shocks. Bottazzi and Secchi (2006a) reject Gibrat’s law on the basis of a negative relationship between growth rate variance and firm size. Reichstein and Jensen (2005) reject Gibrat’s law
4This logarithmic approximation is only justified if ε
t is ‘small’ enough (i.e. close to zero), which can be
reasonably assumed by taking a short time period (Sutton, 1997).
after observing that the annual growth rate distribution is not normally distributed.
2.2.2 Firm size and average growth
Although Gibrat’s (1931) seminal book did not provoke much of an immediate reaction, in recent decades it has spawned a flood of empirical work. Nowadays, Gibrat’s ‘Law of Pro-portionate Effect’ constitutes a benchmark model for a broad range of investigations into industrial dynamics. Another possible reason for the popularity of research into Gibrat’s law, one could suggest quite cynically, is that it is a relatively easy paper to write. First of all, it has been argued that there is a minimalistic theoretical background behind the process (because growth is assumed to be purely random). Then, all that needs to be done is to take the IO economist’s ‘favourite’ variable (i.e. firm size, a variable which is easily observable and readily available) and regress the difference on the lagged level. In addition, few control variables are required beyond industry dummies and year dummies, because growth rates are characteristically random.
Empirical investigations of Gibrat’s law rely on estimation of equations of the type:
log(xt) = α+βlog(xt−1) +² (5)
where a firm’s ‘size’ is represented by xt, α is a constant term (industry-wide growth trend)
and²is a residual error. Research into Gibrat’s law focuses on the coefficientβ. If firm growth is independent of size, then β takes the value of unity. If β is smaller than one, then smaller firms grow faster than their larger counterparts, and we can speak of ‘regression to the mean’. Conversely, if β is larger than one, then larger firms grow relatively rapidly and there is a tendency to concentration and monopoly.
A significant early contribution was made by Edwin Mansfield’s (1962) study of the US steel, petroleum, and rubber tire industries. In particular interest here is what Mansfield identified as three different renditions of Gibrat’s law. According to the first, Gibrat-type regressions consist of both surviving and exiting firms and attribute a growth rate of -100% to exiting firms. However, one caveat of this approach is that smaller firms have a higher exit hazard which may obfuscate the relationship between size and growth. The second version, on the other hand, considers only those firms that survive. Research along these lines has typically shown that smaller firms have higher expected growth rates than larger firms. The third version considers only those large surviving firms that are already larger than the industry Minimum Efficient Scale of production (with exiting firms often being excluded from the analysis). Generally speaking, empirical analysis corresponding to this third approach suggests that growth rates are more or less independent from firm size, which lends support to Gibrat’s law.
The early studies focused on large firms only, presumably partly due to reasons of data availability. A series of papers analyzing UK manufacturing firms found a value of β greater than unity, which would indicate a tendency for larger firms to have higher percentage growth rates (Hart (1962), Samuels (1965), Prais (1974), Singh and Whittington (1975)).
However, the majority of subsequent studies using more recent datasets have found values of
βslightly lower than unity, which implies that, on average, small firms seem to grow faster than larger firms. This result is frequently labelled ‘reversion to the mean size’ or ‘mean-reversion’.5
Among a large and growing body of research that reports a negative relationship between size and growth, we can mention here the work by Kumar (1985) and Dunne and Hughes (1994) for quoted UK manufacturing firms, Hall (1987), Amirkhalkhali and Mukhopadhyay (1993) and Bottazzi and Secchi (2003) for quoted US manufacturing firms (see also Evans (1987a, 1987b) for US manufacturing firms of a somewhat smaller size), Gabe and Kraybill (2002) for establishments in Ohio, and Goddard et al. (2002) for quoted Japanese manufacturing firms. Studies focusing on small businesses have also found a negative relationship between firm size and expected growth – see for example Yasuda (2005) for Japanese manufacturing firms, Calvo (2006) for Spanish manufacturing, McPherson (1996) for Southern African micro businesses, and Wagner (1992) and Almus and Nerlinger (2000) for German manufacturing. Dunne et al. (1989) analyse plant-level data (as opposed to firm-level data) and also observe that growth rates decline along size classes. Research into Gibrat’s law using data for specific sectors also finds that small firms grow relatively faster (see e.g. Barron et al. (1994) for New York credit unions, Weiss (1998) for Austrian farms, Liu et al. (1999) for Taiwanese electronics plants, and Bottazzi and Secchi (2005) for an analysis of the worldwide pharmaceutical sector). Indeed, there is a lot of evidence that a slight negative dependence of growth rate on size is present at various levels of industrial aggregation. Although most empirical investigations into Gibrat’s law consider only the manufacturing sector, some have focused on the services sector. The results, however, are often qualitatively similar – there appears to be a negative relationship between size and expected growth rate for services too (see Variyam and Kraybill (1992), Johnson et al. (1999)) Nevertheless, it should be mentioned that in some cases a weak version of Gibrat’s law cannot be convincingly rejected, since there appears to be no significant relationship between expected growth rate and size (see the analyses provided by Bottazzi et al. (2005) for French manufacturing firms, Droucopoulos (1983) for the world’s largest firms, Hardwick and Adams (2002) for UK Life Insurance companies, and Audretsch et al. (2004) for small-scale Dutch services). Notwithstanding these latter studies, however, we acknowledge that in most cases a negative relationship between firm size and growth is observed. Indeed,
5We should be aware, however, that ‘mean-reversion’ does not imply that firms are converging to anything
resembling a common steady-state size, even within narrowly-defined industries (see in particular the empirical work by Geroski et al. (2003) and Cefis et al. (2006)).
it is quite common for theoretically-minded authors to consider this to be a ‘stylised fact’ for the purposes of constructing and validating economic models (see for example Cooley and Quadrini (2001), Gomes (2001) and Clementi and Hopenhayn (2006)). Furthermore, John Sutton refers to this negative dependence of growth on size as a ‘statistical regularity’ in his revered survey of Gibrat’s law (Sutton, 1997: 46).
A number of researchers maintain that Gibrat’s law does hold for firms above a certain size threshold. This corresponds to acceptance of Gibrat’s law according to Mansfield’s third rendition, although ‘mean reversion’ leads us to reject Gibrat’s Law as described in Mansfield’s second rendition. Mowery (1983), for example, analyzes two samples of firms, one of which contains small firms while the other contains large firms. Gibrat’s law is seen to hold in the latter sample, whereas mean reversion is observed in the former. Hart and Oulton (1996) consider a large sample of UK firms and find that, whilst mean reversion is observed in the pooled data, a decomposition of the sample according to size classes reveals essentially no relation between size and growth for the larger firms. Lotti et al. (2003) follow a cohort of new Italian startups and find that, although smaller firms initially grow faster, it becomes more difficult to reject the independence of size and growth as time passes. Similarly, results reported by Becchetti and Trovato (2002) for Italian manufacturing firms, Geroski and Gugler (2004) for large European firms and Cefis et al. (2006) for the worldwide pharmaceutical industry also find that the growth of large firms is independent of their size, although including smaller firms in the analysis introduces a dependence of growth on size. It is of interest to remark that Caves (1998) concludes his survey of industrial dynamics with the ‘substantive conclusion’ that Gibrat’s law holds for firms above a certain size threshold, whilst for smaller firms growth rates decrease with size.
Concern about econometric issues has often been raised. Sample selection bias, or ‘sample attrition’, is one of the main problems, because smaller firms have a higher probability of exit. Failure to account for the fact that exit hazards decrease with size may lead to underestimation of the regression coefficient (i.e. β). Hall (1987) was among the first to tackle the problem of sample selection, using a Tobit model. She concludes that selection bias does not seem to account for the negative relationship between size and growth. An alternative way of correcting for sample selection is by applying Heckman’s two-stage procedure. This is the methodology used by Harhoff et al. (1998), who also observe that selection bias has only a small influence on the Gibrat coefficient. In short, the “problem of sample selection does not seem to significantly affect the relationship between growth rate and size of firm” (Marsili, 2001: 15). The possibility of heteroskedasticity is also frequently mentioned, although it can be corrected for quite easily, for example by applying White’s (1980) procedure. In any case, heteroskedasticity does not introduce any asymptotic bias in the coefficient estimates. Serial correlation in growth rates can lead to biased estimates, although Chesher (1979) proposes
a simple framework for dealing with this. Finally, Hall (1987) investigates whether ‘errors-in-variables’ may be influencing the regression results, but concludes that measurement error does not appear to be an important factor.
2.2.3 Firm size and growth rate variance
Hymer and Pashigian (1962) were among the first to draw attention to the negative relationship between growth rate variance and firm size. If firms can be seen as a collection of ‘components’ or ‘departments’, then the overall variance of the growth rate of the firm is a function of the growth rate variance of these individual departments. In many cases, the variance of the firm’s growth rate will decrease with firm size. For example, in the case there these departments (i) are of approximately equal size, such that the size of the firm is roughly proportional to the number of components; and (ii) have growth rates that are perfectly independent from each other, then Central Limit Theorem leads us to expect a decrease in growth rate variance that is proportional to the inverse square root of the firm’s size. However, Hymer and Pashigian (1962) were puzzled by the fact that the rate of decrease of growth rate variance with size was lower than the rate that would be observed if large firms were just aggregations of independent departments. At the same time, they found no evidence of economies of scale. They saw this as an anomaly in a world of risk-averse agents. Why would firms want to grow to a large size, if there are no economies of scale, and if the growth rate variance of a large firm is higher than the corresponding variance of an equivalent group of smaller firms? Subsequent studies did not attempt to answer this question, but they did bear in mind the existence of a negative relationship between growth rate variance and firm size. As a consequence, empirical analyses of Gibrat’s law began to correct for heteroskedasticity in firm growth rates (e.g. Hall (1987), Evans (1987a,b), Dunne and Hughes (1994), Hart and Oulton (1996), Harhoff et al. (1998)).
In recent years efforts have been made to quantify the scaling of the variance of growth rates with firm size. This scaling relationship can be summarized in terms of the following power law: σ(gi) ∼ eβsi; where σ(gi) is the standard deviation of the growth rate of firm i, β is a
coefficient to be estimated, andsiis the size (total sales) of firmi. Values ofβhave consistently
been estimated as being around -0.2 for US manufacturing firms (Amaral et al. (1997, 1998), Bottazzi and Secchi (2004)) and also for firms in the worldwide pharmaceutical industry (Bottazzi et al. (2001), Matia et al. (2004), Bottazzi and Secchi (2006a)). Lee et al. (1998) find that a scaling exponent of -0.15 is able to describe the scaling of growth rate variance for both quoted US manufacturing firms and the GDP of countries. For French manufacturing firms, the analysis in Bottazzi et al. (2005) yields estimates of β of around -0.07, although in the case of Italian manufacturing firms Bottazzi et al. (2007) fail to find any relation between growth rate variability and size.
The discussion in Lee et al. (1998: 3277) gives us a better understanding of the values taken by β, the scaling exponent. If the growth rates of divisions of a large diversified firm are perfectly correlated, we should expect a value of β = 0. On the other hand, if a firm can be viewed as an amalgamation of perfectly independent subunits, we expect a value of β = -0.5. The fact that the estimated exponents are between these extreme values of 0 and -0.5 suggest that the constituent departments of a firm have growth patterns that are somewhat correlated.
Matia et al. (2004) and Bottazzi and Secchi (2006a) return to the scaling-of-variance puzzle by considering firms as being composed of a certain number of products that correspond to independent submarkets.6 The average size of the submarkets increases with firm size, but
the growth rates are independent across submarkets. These authors provide support for their model by examining evidence from the worldwide pharmaceutical industry, where a firm’s portfolio of activities can be decomposed to a fine level of aggregation. As a result, “the explanation of the relationship between the variance of the growth rates distribution and the size of the firm based on the Central Limit Theorem is valid, as long as one considers the actual number of sub-markets a firm operates in, instead of assuming that this number is somehow proportional to the size of the firm” (Bottazzi and Secchi 2006a: 860).
2.2.4 Autocorrelation of growth rates
Early empirical studies into the growth of firms considered serial correlation when growth was measured over a period of 4 to 6 years. Positive autocorrelation of 33% was observed by Ijiri and Simon (1967) for large US firms, and a similar magnitude of 30% was reported by Singh and Whittington (1975) for UK firms. However, much weaker autocorrelation was later reported in comparable studies by Kumar (1985) and Dunne and Hughes (1994).
More recently, availability of better datasets has encouraged the consideration of annual autocorrelation patterns. Indeed, persistence should be more visible when measured over shorter time horizons. However, the results are quite mixed. Positive serial correlation has often been observed, in studies such as those of Chesher (1979) and Geroski et al. (1997) for UK quoted firms, Wagner (1992) for German manufacturing firms, Weiss (1998) for Austrian farms, Bottazzi et al. (2001) for the worldwide pharmaceutical industry, and Bottazzi and Secchi (2003) for US manufacturing. On the other hand, negative serial correlation has also been reported – some examples are Boeri and Cramer (1992) for German firms, Goddard et al. (2002) for quoted Japanese firms, Bottazzi et al. (2007) for Italian manufacturing, and Bottazzi et al. (2005) for French manufacturing. Still other studies have failed to find any
6Their model bears a certain similarity with the model in Amaral et al. (1998, 2001), who explain scaling
of variance in terms of firms being composed of independent ‘divisions’ in a diversified firm, rather than independent ‘submarkets’.
significant autocorrelation in growth rates (see Almus and Nerlinger (2000) for German start-ups, Bottazzi et al. (2002) for selected Italian manufacturing sectors, Geroski and Mazzucato (2002) for the US automobile industry, and Lotti et al. (2003) for Italian manufacturing firms). To put it mildly, there does not appear to be an emerging consensus.
Another subject of interest (also yielding conflicting results) is the number of relevant lags to consider. Chesher (1979) and Bottazzi and Secchi (2003) found that only one lag was significant, whilst Geroski et al. (1997) find significant autocorrelation at the 3rd lag (though not for the second). Bottazzi et al. (2001) find positive autocorrelation for every year up to and including the seventh lag, although only the first lag is statistically significant.
To summarize these regression-based investigations, then, it would appear that decades of research into growth rate autocorrelation can best be described as yielding “conflicting results” (Caves, 1998: 1950). It is perhaps remarkable that the results of the studies reviewed above have so little in common. It is also remarkable that previous research has been so little concerned with this question. Indeed, instead of addressing serial correlation in any detail, often it is ‘controlled away’ as a dirty residual, a blemish on the ‘natural’ growth rate structure. The baby is thus thrown out with the bathwater. On reason for this confusion could be that, if indeed there are any regularities in the serial correlation of firm growth, they are more complex than the standard specification would be able to detect (i.e. that there is no ‘one-size-fits-all’ serial correlation coefficient that applies for all firms). A fresh approach is needed.
The analysis in Bottazzi et al. (2002) begins with the observation that the mean autocor-relation coefficient for a given industry is either insignificantly different from zero, or else very small in magnitude. However, the authors go on to calculate firm-specific autocorrelation coef-ficients and observe that firms do in fact have idiosyncratic growth patterns that are not visible simply by looking at averages across firms. They create a purely random ‘benchmark’ case in which the growth rates of all firms are pooled together and then growth rates are extracted ran-domly to construct growth patterns for ‘artificial firms’. Bootstrap resampling methods allow them to generate a distribution of autocorrelation coefficients for this random scenario. They then compare this stochastic benchmark with the empirical distribution of autocorrelation co-efficients (see Figure 5 for the case of autocorrelation of employment growth). The differences between the distributions are supported by formal statistical tests (i.e. Kolmogorov-Smirnov tests). The authors conclude that firm growth patterns are indeed idiosyncratic, that they do have a memory process, and that there are indeed persistent asymmetries in growth dynamics across firms.
Coad (2006b) also explores the issue of heterogeneous growth profiles across firms and goes some way towards finding regularities in growth rate autocorrelation patterns. A firm’s growth dynamics are seen to depend on two dimensions – a firm’s size and its lagged growth
Figure 5: Observed empirical frequency for the autocorrelation coefficient of employment growth (steps function) and the associated ‘benchmark’ density distribution generated using bootstrapped time series (dotted line). Source: Bottazzi et al. (2002: Fig. 5).
rate. First of all, it is demonstated that smaller firms are more prone to experience negative autocorrelation, whilst larger firms have a tendency towards positive autocorrelation. This is consistent with propositions that small and large firms operate on a different ‘frequency’ or time scale, with the actions of large firms unfolding over a longer time horizon. This dependence of autocorrelation on firm size helps to explain why the studies reviewed above yielded different autocorrelation coefficients for databases with different firm-size compositions. Second, Coad (2006b) demonstrates that the autocorrelation coefficient depends on thegrowth rate. Firms whose growth rate is close to the average in one year are likely to not experience any autocorrelation in the following year. For those firms that experience extreme growth rates (either extreme positive or negative growth rates), however, these firms are likely to experience considerable negative autocorrelation. This is especially true for fast-growth small firms, whose growth patterns are particularly erratic (see also Garnsey and Heffernan (2005)). Large firms, however, display a smoother dynamics – they are likely to experience positive autocorrelation irrespective of their growth rate in the previous period.
2.3
Other determinants of firm growth
2.3.1 Age
The relationship between size and growth has received a great deal of attention in empirical work, as we discussed above in Section 2.2.2. Relatedly, the relationship between a firm’s age and its growth rate has also been frequently investigated. Age and size are certainly closely related, and indeed, in some cases, they are both taken to represent what is essentially the same phenomenon (see e.g. Greiner’s (1972) model). One of the earliest investigations of the influence of age on growth was made by Fizaine (1968), who examined the growth of establishments from the French region of Bouches-du-Rhone. She observed that age has a negative effect on the growth of establishments, and also that the variance of growth rates decreases with age. Fizaine (1968) also argued that the correct causality runs from age to growth, rather than from size to growth as supposed by many investigations into firm growth based on Gibrat’s law (this argument was subsequently reiterated by Evans 1987b). Dunne et al. (1989) analyse US establishments and concur with Fizaine’s findings that both the expected growth rate and also the growth variance decrease with age. Age is also observed to have a negative effect on growth at the firm level, as a large number of studies have testified – see inter alia Evans (1987a,b) for US manufacturing firms, Variyam and Kraybill (1992) for US manufacturing and services firms, Liu et al. (1999) for Taiwanese electronics plants, Geroski and Gugler (2004) for large European companies, and Yasuda (2005) for Japanese manufacturing firms.
Generally speaking, then, the negative dependence of growth rate on age appears to be
a robust feature of industrial dynamics. This is not always observed, however. Das (1995) examines the growth of firms in a young, fast-growing industry in a developing economy (i.e. the computer hardware industry in India) and obtains the unusual results that that growth increases with age. Another exception to the general rule is in Barron et al. (1994), who observe a non-monotonic relationship between age and growth for New York Credit Unions. They observe that older firms grow faster than adolescent firms, although it is the very young firms that experience the fastest growth.
2.3.2 Innovation
Innovation and sales growth The relationship between innovation and sales growth
can be described as something of a paradox – on the one hand, a broad range of theoretical and descriptive accounts of firm growth stress the important role innovation plays for firms wishing to expand their market share. For example, Carden (2005: 25) presents the main results of the McKinsey Global Survey of Business Executives, and writes that “[e]xecutives overwhelmingly say that innovation is what their companies need most for growth.” Another survey focusing on SMEs (Small and Medium Enterprises) reports that investment in product innovation is the single most popular strategy for expansion, a finding which holds across various industries (Hay and Kamshad, 1994). Economic theorizing also recognizes the centrality of innovation in growth of firm sales (see for example the discussion in Geroski (2000, 2005) or the theoretical model in Aghion and Howitt (1992)). On the other hand, empirical studies have had difficulty in identifying any strong link between innovation and sales growth, and the results have often been modest and disappointing. Indeed, some studies fail to find any influence of innovation on sales growth at all. Commenting on the current state of our understanding of firm-level processes of innovation, Cefis and Orsenigo (2001) write: “Linking more explicitly the evidence on the patterns of innovation with what is known about firms growth and other aspects of corporate performance – both at the empirical and at the theoretical level – is a hard but urgent challenge for future research” (Cefis and Orsenigo, 2001: 1157).
A major difficulty in observing the effect of innovation on growth is that it may take a firm a long time to convert increases in economically valuable knowledge (i.e. innovation) into economic performance. Even after an important discovery has been made, a firm will typically have to invest heavily in product development. In addition, converting a product idea into a set of successful manufacturing procedures and routines may also prove costly and difficult. Furthermore, even after an important discovery has been patented, a firm in an uncertain market environment may prefer to treat the patent as a ‘real option’ and delay associated investment and development costs (Bloom and Van Reenen, 2002). There may therefore be considerable lags between the time of discovery of a valuable innovation and its conversion into
commercial success.7 Another feature of the innovation process is that there is uncertainty at
every stage, and that the overall outcome requires success at each step of the process. In a pioneering empirical study, Mansfield et al. (1977) identify three different stages of innovation that correspond to three different conditional probabilities of success: the probability that a project’s technical goals will be met (x); the probability that, given technical success, the resulting product or process will be commercialized (y); and finally the probability that, given commercialization, the project yields a satisfactory return on investment (z). The overall success of the innovative activities will be the product of these three conditional probabilities (x×y×z). If a firm fails at any of these stages, it will have incurred costs without reaping benefits. We therefore expect that firms differ greatly both in terms of the returns to R&D (measured here in terms of post-innovation sales growth) and also in terms of the time required to convert an innovation into commercial success. However, it is anticipated that innovations will indeed pay off on average and in the long term, otherwise commercial businesses would obviously have no incentive to perform R&D in the first place.
How then do firms translate innovative activity into competitive advantage?8 Our gleaning
of this literature of the influence of innovative activity on sales growth yields a sparse and rather motley harvest. (This may be due to difficulties in linking firm-level innovation data to other firm characteristics.) Mansfield (1962) considers the steel and petroleum sectors over a 40-year period, and finds that successful innovators grew quicker, especially if they were initially small. Moreover, he asserts that the higher growth rate cannot be attributed to their pre-innovation behavior. Another early study by Scherer (1965) looks at 365 of the largest US corporations and observes that inventions (measured by patents) have a positive effect on company profits via sales growth. Furthermore, he observes that innovations typically do not increase profit margins but instead increase corporate profits via increased sales at constant profit margins. Mowery (1983) focuses on the dynamics of US manufacturing over the period 1921-1946 and observes that R&D employment only has a significantly positive impact on firm growth (in terms of assets) for the period 1933-46. Using two different samples, he observes that R&D has a similar effect on growth for both large and small firms. Geroski and Machin (1992) look at 539 large quoted UK firms over the period 1972-83, of which 98 produced an innovation during the period considered. They observe that innovating firms (i.e. firms that produced at least one ‘major’ innovation) are both more profitable and grow faster than non-innovators. Their results suggest that the influence of specific innovations on sales growth are
7However, it is reasonable to assume that the time lag from innovation to superior firm-level performance
is shorter when this latter is measured in terms of stock market valuation – this line of reasoning is pursued in Coad and Rao (2006c).
8This is not the place to consider how innovative activity affects other aspects of firm performance such
as stock market success. For a survey of the literature on innovation and market value appreciation, see Coad and Rao (2006c). For a survey of the relationship between innovation and employment growth (i.e. the ‘technological unemployment’ literature, see the following section.
nonetheless short-lived (p81) – “the full effects of innovation on corporate growth are realized very soon after an innovation is introduced, generating a short, sharp one-off increase in sales turnover.” In addition, and contrary to Scherer’s findings, they observe that innovation has a more noticeable influence on profit margins than on sales growth. Geroski and Toker (1996) look at 209 leading UK firms and observe that innovation has a significant positive effect on sales growth, when included in an OLS regression model amongst many other explanatory variables. Roper (1997) uses survey data on 2721 small businesses in the U.K., Ireland and Germany to show that innovative products introduced by firms made a positive contribution to sales growth. Freel (2000) considers 228 small UK manufacturing businesses and, interestingly enough, observes that although it is not necessarily true that ‘innovators are more likely to grow’, nevertheless ‘innovators are likely to grow more’ (i.e. they are more likely to experience particularly rapid growth). Finally, Bottazzi et al. (2001) study the dynamics of the worldwide pharmaceutical sector and do not find any significant contribution of a firm’s ‘technological ID’ or innovative position9 to sales growth.
One observation that emerges from the preceding survey is that innovation can be measured in several ways, although the most common approach is to use R&D statistics or patent counts. However, each of these indicators has its drawbacks. R&D statistics are typically quite smoothed over time, which contrasts with the lack of persistence frequently observed in patent statistics. Furthermore, R&D expenditure is an innovative input and it gives only a poor indication of the value of the resulting innovative output that a firm can take to market. Patent statistics are very skewed in value, with many patents being practically worthless whilst a fraction of patents generate the lion’s share of the economic value. Another limitation is that many previous studies have lumped together firms from all manufacturing sectors – even though innovation regimes (and indeed appropriability regimes) vary dramatically across industries.10 To deal with these difficulties of quantifying firm-level innovative activity, the
analysis in Coad and Rao (2006a,b) combines information on a firm’s recent history of R&D expenditures as well as patenting activity to create a synthetic ‘innovativeness’11 variable for
each firm-year. In this way we extract the common variance associated with each of these indicators while discarding the idiosyncratic noise and measurement error. We also focus on four two-digit ‘complex technology’ manufacturing industries that were hand-picked because of their relatively high intensities.
Using semi-parametric quantile regressions, we explore the influence of innovation at a
9They measure a firm’s innovative activity by either the discovery of NCE’s (new chemical entities) or by
the proportion of patented products in a firm’s product portfolio
10Patenting is an effective means of protecting innovations in the pharmaceutical industry, for example,
although it is not very effective in the steel, glass or textile industries (Cohen et al., 2000). Therefore, it is problematic to compare one patent for a pharmaceutical firm with one patent for a steel, glass or textile firm.
11Note that our use of the word ‘innovativeness’ does not correspond to Mairesse and Mohnen’s (2002) use
of the same word.
range of points of the conditional growth rate distribution. Our results indicate that most firms don’t grow very much, and their growth is hardly related to their attempts at innovation. Nevertheless, innovation is seen to be of critical importance for a handful of fast-growth firms. This emphasizes the inherent uncertainty in firm-level innovative activity – whilst for the ‘average firm’ innovativeness may not be very important for sales growth, innovativeness is of crucial importance for the ‘superstar’ high-growth firms. Standard regression techniques which implicitly give equal weights to both high-growth and low-growth firms, and that yield a summary point estimate for the ‘average firm’, are unable to detect this relationship.
Innovation and employment growth Whilst firm-level innnovation can be expected
to have a positive influence on sales growth, the overall effect on employment growth is a priori ambiguous. Innovation is often associated with increases in productivity that lower the amount of labour required for the production of goods and services. In this way, an innovating firm may change the composition of its productive resources, to the profit of machines and at the expense of employment. As a result, the general public has often expressed concern that technological progress may bring about the ‘end of work’ by replacing men with machines. Economists, on the other hand, are usually more optimistic.
To begin with, it is useful to decompose innovation into product and process innovation. Product innovations are often associated with employment gain, because the new products create new demand (although it is possible that they might replace existing products). Process innovations, on the other hand, often increase productivity by reducing the labour requirement in manufacturing processes. Thus, process innovations are often suspected of bringing about ‘technological unemployment’.
The issue becomes even more complicated, however, when we consider that there are not only direct effects of innovation on employment, but also a great many indirect effects operating through various ‘substitution channels’. For example, the introduction of a labour-saving production process may lead to an immediate and localized reduction in employees inside the plant (the ‘direct effect’), but it may lead to positive employment changes elsewhere in the economy via an increased demand for new machines, a decrease in prices, and increase in incomes, an increase in new investments, or a decrease in wages (see Spiezia and Vivarelli, 2000). As a result, the overall effect of innovation on employment needs to be investigated empirically.
Research into technological unemployment has been undertaken in different ways. As a consequence, the results emerging from different studies are far from harmonious – “[e]mpirical work on the effect of innovations on employment growth yields very mixed results” (Niefert 2005:9). Doms et al. (1995) analyse survey data on US manufacturing establishments, and observe that the use of advanced manufacturing technology (which would correspond to process
innovation) has a positive effect on employment. At the firm-level of analysis, Hall (1987) observes that employment growth is related positively and significantly to R&D intensity in the case of large US manufacturing firms. Similarly, Greenhalgh et al. (2001) observe that R&D intensity and also the number of patent publications have a positive effect on employment for British firms. Nevertheless, Evangelista and Savona (2002, 2003) observe a negative overall effect of innovation on employment in the Italian services sector. When the distinction is made between product and process innovation, the former is usually linked to employment creation whereas the consequences of the latter are not as clear-cut. Evidence presented in Brouwer et al. (1993) reveals a small positive employment effect of product-related R&D although the combined effect of innovation is imprecisely defined. Relatedly, work by Van Reenen (1997) on listed UK manufacturing firms and Smolny (1998) for West German manufacturing firms shows a positive effect on employment for product innovations. Smolny also finds a positive employment effect of process innovations, whereas Van Reenen’s analysis yields insignificant results. Harrison et al. (2005) consider the relationship between innovation and employment growth in four European countries (France, Italy, the UK and Germany) using data for 1998 and 2000 on firms in the manufacturing and services industries. Whilst product innovations are consistently associated with employment growth, process innovation appears to have a negative effect on employment, although the authors acknowledge that this latter result may be attenuated (or even reversed) through compensation effects. To summarize, therefore, we can consider that product innovations generally have a positive impact on employment, whilst the role of process innovations is more ambiguous (Hall et al., 2006).
2.3.3 Financial performance
Research into the relationship between financial performance and firm expansion has tradition-ally taken the view that any sensitivity between financial performance and investment signals the problem of ‘financial constraints’ and ‘information asymmetries’. We begin by explaining how this interpretation became predominant. However, we prefer what we might call here an ‘evolutionary’ interpretation of the relationship between financial performance and growth. In any case, it is clear that financial performance is not a major determinant of firm growth rates.
Mainstream research into the expansion of firms has based itself on the q-theory of in-vestment. (Note however that the literature does not elaborate upon the distinction between replacement investment and expansionary investment.)12 If some initial assumption are
sat-12The author is not aware of any relevant empirical work that distinguishes replacement investment and
expansionary investment. In the present discussion, we place more emphasis on the latter when we speak of ‘investment’. In any case, the distinction between the two may not be very clear-cut in the first place, especially when we consider that firms tend to replace their exhausted capital stock with more recent vintages.
isfied (including the assumption that firms are rational profit-maximizers, and that financial markets are efficient), then a firm’s growth prospects can be entirely summarized by the stock market’s expectations concerning a firm’s expected future profits. In other words, the only predictor of firm-level investment should be the marginal change in the ratio between the mar-ket value of the firm and the replacement value of the firm’s existing assets. This latter ratio is known as marginalq. Empirical investigations ofqmodels, such as Blundell et al. (1992), have not had great success, however. Tobin’s q does not seem to explain a great deal of investment behavior. One possible interpretation is that profit-maximization on an infinite horizon is not a useful explanation for firm’s investment decisions. Furthermore, and contrary to theoretical predictions, other variables are significant, such as lagged q, output, or cash flow.
Following on from the literature on the ‘q-theory of investment’, Fazzari et al. (1988) demonstrate that the investment behavior of US listed manufacturing firms depends not only on q but also on cash-flow. Starting from the assumption that firms are rational optimizers, they interpret any sensitivity of investment to cash flow as evidence that capital markets are imperfect, and that these ‘optimal’ firms cannot rely on external finance but instead they must finance their investment using internal funds. In their view, investment should not be related to cash flow, and if it is, this indicates that firms are receiving insufficient external finance for their investment plans. Although this ‘financial constraints’ interpretation of investment-cash flow sensitivities has been quite influential and has generated a large following, there are also several major flaws in this interpretation. Kaplan and Zingales (1997, 2000), for example, examine the firms that were classified a priori as financially constrained according to the methodology of Fazzari et al. (1988, 2000), but they find, upon closer inspection using annual reports, that these firms are actually in good financial standing.13 Further evidence against
the ‘financial constraints’ interpretation of investment-cash flow sensitivities is provided by Levenson and Willard (2000) who analyze survey data on small businesses in the US in 1987-88. They estimate that an upper bound of 6.36% of firms were credit-rationed. This leads them to conclude that “the extent of true credit rationing appears quite limited” (2000: 83). The main prediction for firm expansion coming from the evolutionary approach (surveyed in Section 3.4) is that investment or firm growth can be expected to respond to financial performance. This is due to the principle of ‘growth of the fitter’. In this view, firms fight for growth opportunities, they are in a continual struggle to grow, and only those with superior financial performance will be able to gain additional market share. Empirical research in this evolutionary context is sparse, however. Coad (2005) finds a statistically significant relationship between financial performance and sales growth for French manufacturing firms.
13One notable example mentioned by Kaplan and Zingales (2000) is that, in 1997, Microsoft would have
been labelled as ‘financially constrained’ according to the classification schemes of Fazzari et al. (1988, 2000) even though it had almost $9 billion in cash, corresponding to eighteen times its capital expenditures!
Nevertheless, the magnitude of the coefficient is so small that he concludes “it may be more useful to consider a firm’s profit rate and it’s subsequent growth rate as entirely independent” (2005: 15). Bottazzi et al. (2006) find similar results in their analysis of Italian firms.
A common finding in these approaches, however, is that financial performance does not seem to be an important determinant of firm growth, whether this latter is measured in terms of investment or sales growth. Although the coefficients on financial performance are often statistically significant, there is a large amount of unexplained variation in growth rates. Firms appear to have a large amount of discretion in their growth behaviour.
A further discussion of financial performance and growth can be found in the survey in Coad (2007).
2.3.4 Relative productivity
It is perhaps quite natural to assume that the most productive firms will grow while the least productive will decrease in size. However, this assumption does not seem to be borne out by empirical work. A number of studies have cast doubt on the validity of the evolutionary principle of ‘growth of the fitter’, when relative productivity is taken as a proxy for fitness. One explanation for this is that while some firms become more productive through expansion, others become more productive through downsizing. An illustration of this is provided by Baily et al. (1996) who observe that, among plants with increasing labour productivity between 1977 and 1987, firms that grew in terms of employees were balanced out by firms that decreased employment. They find that about a third of labour productivity growth is attributable to growing firms, about a third to downsizing firms, and the remaining third is attributable to the processes of entry and exit. Similarly, Foster et al. (1998) also fail to find a robust significant relationship between establishment-level labour productivity or multifactor productivity and growth (see also the review in Bartelsman and Doms (2000: 583-584)). In addition, using a database of Italian manufacturing firms, Bottazzi et al. (2002, 2006) fail to find a robust relationship between productivity and growth. (Notwithstanding this latter result, Bottazzi et al. (2006) observe a strong positive relationship between productivity and profitability.) Perhaps more worrying is the evidence reported for US and UK manufacturing establishments in Disney et al. (2003: 683) revealing a negative between-effect in allocation of market share between establishments according to productivity.
While there is ample evidence suggesting that low productivity helps to predict exit (see e.g. Griliches and Regev (1995), Foster et al (1998)), productivity levels are not very helpful in predicting growth rates. Put differently, it appears that selection only operates viaelimination
of the least productive firms or establishments, while the mechanism of selection viadifferential growth does not appear to be functioning well. As a result, the mechanism of selection appears
to be rather ‘suboptimal’ in the sense that its effectiveness is lower than it could conceivably be. For Baily and Farrell (2006), the lack of a positive relationship between relative productivity and growth corresponds to a lack of competition. In an ideal scenario, firms would compete for growth opportunities, and selective pressures would attribute these growth opportunities discriminating in favour of the most productive firms. In this way, there would be some sort of dynamic efficient reallocation at work, whereby an economy’s scarce resources are redistributed to those firms that are able to employ them most efficiently. In reality, however, this mechanism does not seem to be operating. Instead, the evidence is consistent with the hypothesis that many of the more productive firms may not actually seek to grow, or may be unable to grow. As a consequence, the absence of selection via differential growth testifies of missed productivity growth opportunities for the economy as a whole. Whilst we can put forward here that stimulating the growth of high-productivity firms might constitute an objective for policy, it is evident that there are large question marks surrounding how such a policy intervention might be engineered.
2.3.5 Other firm-specific factors
A number of other firm-specific variables have been associated with growth rates. Owner-ship structure appears to be a relevant factor because there is evidence that multiplant firms have higher growth rates, on average, than single-plant firms. This appears to be the case for US small businesses (Variyam and Kraybill, 1992; Audretsch and Mahmood, 1994), large European corporations (Geroski and Gugler, 2004), and also Italian manufacturing firms (Fa-giolo and Luzzi, 2006). In their analysis of West German firms, Harhoff et al. (1998) identify that subsidiary firms grow faster than non-subsidiaries in construction and trade industries, although no difference can be found for manufacturing and services. Furthermore, a plant-level analysis reveals that plants which belong to large companies are observed to have higher growth than stand-alone plants (Dunne et al., 1989). Whilst there is weak evidence that foreign-owned firms experience faster growth rates, government-owned firms seem to grow more slowly (Beck et al., 2005). A firm’s legal status is also proposed as a determinant of its growth rate. Harhoff et al. (1998), among others, examine the growth of West German firms and observe that firms with limited liability have significantly higher growth rates in com-parison to other companies. However, these firms also have significantly higher exit hazards. These results are in line with theoretical contributions, along the lines of Stiglitz and Weiss (1981), that emphasize that the limited liability legal form provides incentives for managers to pursue projects that are characterized by both a relatively high expected return and a relatively high risk of failure.
Another approach has been to consider the characteristics of the management. The
agerial’ theory (surveyed in Section 3.3) suggests that managers attach utility to the size and growth of their firms, such that they will pursue growth above the shareholder-value-maximizing level. This leads to the hypothesis that owner-controlled firms will have lower growth rates (and perhaps higher profits) than manager controlled firms. Whilst Radice (1971) and Holl (1975) find no support for this claim in their analyses of large UK firms, Hay and Kamshad (1994) find that owner-controlled SMEs have lower growth rates than non-owner-controlled SMEs. The human capital embodied in the proprietor has also been suspected of having an effect on firm growth, although the evidence is mixed. Whilst Almus (2002) identifies a positive effect of human capital (i.e. university degree or above) on growth for fast-growing German firms, Robson and Bennett (2000) fail to find a significant effect of skill level in explaining employment or profitability growth in their sample of UK small businesses. McPherson (1996) observes that the level of human capital embodied in the proprietor has a positive and significant influence on the growth of micro and small businesses in five Southern African nations. He also observes that firms owned by female persons have lower growth rates for the businesses in his sample.
It has also been shown that c