1. Introduction
The Anomalous-Propagation (AP) Clutter
Mitigation Scheme (Kessinger et al. 2001) is being implemented within the Open Radar Product Generator (ORPG) (Saffle and Johnson 1998; Saffle et al. 2001) of the Weather Surveillance Radar–1988 Doppler (WSR-88D) of the National Weather Service (NWS). This scheme is designed to automatically identify and remove the AP ground clutter caused by atmospheric conditions favorable for refraction of the radar beam towards the surface. Removal of AP ground clutter is necessary because it is a contaminant within the radar base data fields that causes erroneous radar-derived rainfall estimates within the WSR-88D precipitation processing subsystem (PPS; Fulton et al. 1998; O’Bannon 1998) as well as errors in interpretation.
Ground clutter filters are able to remove the clutter contamination in most situations. However, the filters also introduce biases into the base data within precipitation echo. The reflectivity is biased low in regions having near zero radial velocity, resulting in underestimates of rain rate and adversely impacting hydrological estimates. The radial velocity estimates are also biased,
potentially influencing velocity-based algorithms. Due to the clutter filter biases, it is not optimal to apply clutter filters globally.
Currently, manual application of ground clutter filters is used within the WSR-88D data quality control system to remove AP clutter within affected regions. The goals of the AP Clutter Mitigation Scheme are automated clutter filter control and correction of clutter filter biases in precipitation. The result will be improved weather radar base data quality, benefiting a wide range of end users including hydrology, numerical weather prediction and air traffic control. Radar operators will no longer have the tedious responsibility of clutter filter control.
The AP Clutter Mitigation Scheme consists of three parts: the Radar Echo Classifier (REC) (Kessinger and Van Andel, 2001), the Reflectivity ______________________
Corresponding author address: Scott Ellis, NCAR P.O. Box 3000, Boulder, CO 80307-3000. [email protected]
and Radial Velocity Compensation Scheme (ZV-Comp) (Ellis, 2001) and Clutter Filter Control. The REC is a multi-channel fuzzy logic algorithm that objectively identifies radar echoes using the base data fields of the WSR-88D. Currently the REC consists of algorithms to identify AP clutter, precipitation and clear air (insect) echoes. An algorithm for sea clutter detection is under development. The ZV-Comp algorithm uses a lookup table of corrections created from a series of Gaussian approximations to precipitation spectra and a simulated WSR-88D ground clutter filter. The output of the REC determines where to apply ZV-Comp so that only regions identified as precipitation are compensated. Clutter Filter Control will be accomplished on a gate-by-gate basis using the output of the REC.
Implementation of the AP Clutter Mitigation Scheme has begun with the AP Detection
Algorithm (APDA) of the REC being incorporated into the WSR-88D Open Radar Product Generator (ORPG) build two. The APDA is to be delivered to the field by early October 2002. The
Precipitation Detection Algorithm (PDA) and the ZV-Comp are to be implemented in ORPG build 4 in September of 2003.
An overview of the AP Clutter Mitigation scheme is presented in section 2, results from the
deployment of the REC and ZV-Comp algorithms on NCAR’s S-Pol radar during two recent field programs are shown in section 3, section 4 updates the implementation on the WSR-88D radar network and section 5 discusses the acquisition of a new radar processor for S-Pol and plans for spectral domain processing.
2. AP Clutter Mitigation Scheme
The AP Clutter Mitigation Scheme has the goal of automated AP clutter detection and removal as well as clutter filter bias correction. To accomplish this the Radar Echo Classifier objectively
determines the echo type. If AP clutter is detected, the clutter filter will be automatically invoked in only the affected areas, avoiding clutter filter bias throughout the entire scan. If the clutter filter is applied to regions of precipitation, the Reflectivity and Velocity Compensation (ZV-Comp) algorithm will automatically correct for clutter filter biases.
Mitigating Ground Clutter Contamination in the WSR-88D
Scott Ellis1, Cathy Kessinger1, Timothy D. O’Bannon2 and Joseph VanAndel1
1. National Center for Atmospheric Research, Boulder, CO.
2. National Weather Service, Radar Operations Center, Norman OK.
The clutter filter will expire after a user-specified length of time. If the AP clutter remains, it will be detected and clutter filters invoked again.
Automated specification of the clutter filter notch width is also planned.
A. Radar Echo Classifier
The Radar Echo Classifier (REC) is an expert system that uses “fuzzy-logic” principles (Kosko, 1992) to estimate the type of scatterer measured by the WSR-88D. The REC algorithms use only the base data as input, including Z (reflectivity), V (radial velocity) and W (spectrum width). Currently, the REC consists of three algorithms: the AP Detection Algorithm (APDA) detects regions of anomalously-propagated (AP) ground clutter return, the Precipitation Detection Algorithm (PDA) defines convective and stratiform precipitation regions, and the Insect Clear Air Detection Algorithm (ICADA) defines return from insects in the boundary layer. These algorithms have been developed using data from several WSR-88D radars and the NCAR S-Pol radar (Kessinger et al. 1999). A sea clutter detection algorithm is under development. As depicted in Figure 1, the REC ingests the base data and computes numerous quantities, called
Figure1. Schematic showing the organization of the Radar Echo Classifier (REC)
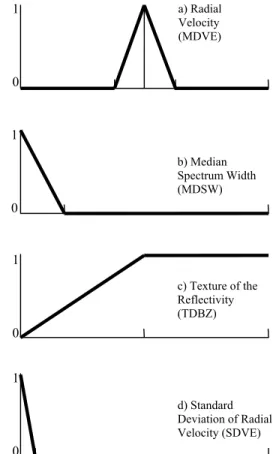
features, useful for distinguishing echo types. The standard deviation of reflectivity and mean velocity computed over a small, user defined region, are examples of features. Each algorithm within the REC uses a unique list of features. Next, the appropriate features are ingested into the fuzzy recognizers and the interest (or membership) values computed from pre-defined membership functions. The interest value is a measure of the likelihood that a feature is an indicator of the category in question, e.g. clutter, precipitation etc. The interest values range from 0 to 1. Examples of membership functions for the APDA are shown in Figure 2. After a-priori weights are applied, the interest values for each of the features are summed, averaged and a threshold is applied to determine if the data point is a member of the class for which the recognizer was designed. A full
Figure 2. Examples of membership functions for the APDA algorithm.
0 45 1000 c) Texture of the Reflectivity (TDBZ) 0 3.2 30 b) Median Spectrum Width (MDSW) -50 -2.3 0 2.3 50 a) Radial Velocity (MDVE) 0 0.7 30 d) Standard Deviation of Radial Velocity (SDVE) 0 1 0 1 0 1 0 1
description of the REC algorithms and
membership functions is presented by Kessinger et al. (2003).
B. Reflectivity and velocity compensation
The ZV-Comp method uses "look-up" tables of corrections that have been generated a-priori, making it computationally efficient. The corrections are computed using Gaussian approximations for precipitation spectra and a simulated clutter filter consistent with the characteristics of the clutter filter used by the radar. Each clutter filter configuration requires a separate table of corrections. It is straightforward to obtain filtered and unfiltered power as well as filtered radial velocity and spectrum width from the simulated data, from which the look-up tables are constructed.The first step in creating the look-up table is to generate a family of Gaussian spectra, Su, using,
( )
(
( )
)
,
2
exp
2 2
−
−
=
v uV
V
V
S
σ
Eq. 1where
V
and σv are the input (unfiltered) radialvelocity and spectrum width and V is the velocity spectrum. Numerous spectra are computed using
V
and σv inputs that span a range of physicallyrelevant values. The unfiltered power (M0) is
estimated as
( )
∫
∞ ∞ −=
S
V
dV
M
0 u Eq. 2 Next, the corresponding filtered power (M0filt),filtered velocity (Vfilt) and filtered spectrum width (Wfilt) are calculated for each spectrum using the following moment calculations,
( ) ( )
V
h
V
dV
S
M
filt∫
u ∞ ∞ −=
0 Eq. 3( ) ( )
∫
∞ ∞ −=
filt u filtM
dV
V
h
V
S
V
V
0 Eq. 4(
)
( ) ( )
∫
∞ ∞ −−
=
filt u filt filtM
dV
V
h
V
S
V
V
W
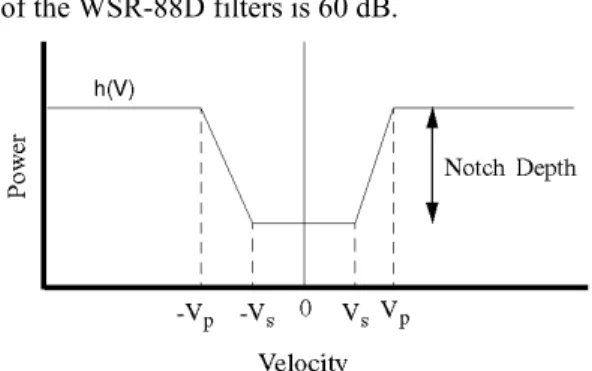
0 2where h(V) is a piecewise-continuous function designed to emulate the WSR-88D clutter filter response (Figure 3). The power estimates from equations 2 and 3 are unit-less linear quantities. The passband velocity (Vp) and stopband velocity (Vs) are selected using the reported filter response characteristics of the three WSR-88D clutter filter configurations (Sirmans, 1992). The notch depth of the WSR-88D filters is 60 dB.
Figure 3. Illustration of the approximated filter response, h(V), where Vp is the passband edge, and Vs is the stopband edge.
Finally, the correction factor (L) for Z is computed as the ratio filt
M
M
L
0 0=
. Eq. 6Thus, we end up with one table for each filter configuration consisting of Vfilt, Wfilt, L and
V
values spanning the range of
V
and σv inputs. Themeasured V and W pair (recall these are filtered values) is then matched to the nearest Vfilt and Wfilt pair from the proper look-up table to obtain the corresponding reflectivity correction factor, L, and the corrected radial velocity. The corrected power is computed by multiplying the measured power by L. Note that all of the computations on power are performed in linear space, and that the correction factor is independent of the range correction and radar constant used to convert power to reflectivity. The corrected value of radial velocity is obtained by substituting the table value
V
for the measured filtered radial velocity.In the WSR-88D, the resolution of the power data is degraded to 1 km resolution, while the Doppler data has 0.25 km resolution. This means that for every observation of power, there are four observations of radial velocity and spectrum width, creating the question of how to combine these data sets with differing resolutions. For each power observation the compensation method is performed four times, once for each Doppler observation. The compensated power then has a resolution of 0.25 km that is degraded to 1 km by using the median of the four values. The
compensated power is also quantized to 0.5 dB bins as is done in the current WSR-88D output. A 0.5 ms-1 quantization is applied to the corrected
value of radial velocity as well.
3. Field program results
As part of a continuing verification effort, the AP Mitigation Scheme was recently deployed in two field programs on the NCAR S-Pol radar. The first was the Improvement of Microphysical
Parameterization through Observational Verification Experiment II (IMPROVE II) near Sweet Home, Oregon during December 2001. The second was the International H20 Project (IHOP)
in the Oklahoma panhandle during May and June of 2002.
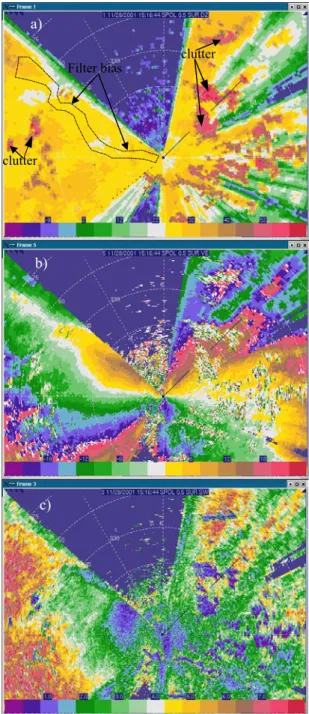
During the IMPROVE II project the S-Pol radar was operating from atop a large hill in the Cascade Mountains. The surrounding high terrain resulted in widespread and very strong ground clutter contamination as well as beam blockage. Ground clutter filters with a notch width of 0.5 m/s were used during most of the project, however strong ground clutter residue was present. Figure 4 shows a plan position indicator (PPI) of a) reflectivity, b) radial velocity and c) spectrum width at an elevation angle of 0.5o for a stratiform rain event
on 28 November 2001. The clutter filters were operating, however, ground clutter leakage is apparent by the high reflectivity values combined with the noisy velocity estimates. The noisy radial velocity values in the ground clutter are an artifact of the dual polarimetric signal processing and would simply be near zero (m/s) in the WSR-88D. The clutter filter affects data near the zero radial velocity line in the precipitation echoes to the west of the radar.
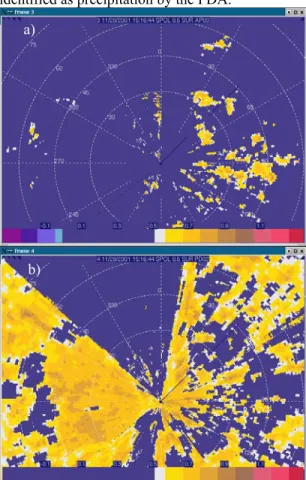
Figure 4. PPI scans of a) reflectivity (dBZ), b) radial velocity (m/s) and c) spectrum width (m/s) Figure 5 shows the REC results for a) the AP Detection Algorithm (APDA) and b) the
Precipitation Detection Algorithm (PDA) with 0.5 thresholds applied. Values of APDA (PDA) above 0.5 indicate the presence of ground clutter (precipitation). Both algorithms work well in this
a) b) c) clutter clutter Filter bias
case. The APDA successfully detects the ground clutter contamination and the PDA identifies the precipitation regions. The spatial coverage of the ground clutter identified by the APDA and the regions excluded from the precipitation identification of the PDA differ. This is not surprising considering the clutter filter is on throughout the domain and the clutter residue is mixed with precipitation echo. The ZV-Comp method is only applied to regions that are not identified as clutter by the APDA and are identified as precipitation by the PDA.
Figure 5. Results of the REC algorithms a) APDA and b) PDA.
The results of the reflectivity compensation are illustrated in Figure 6. As an example consider the small, circled region in Figures 6 a) and b) that compares the biased reflectivity field to the compensated reflectivity field. The zero m/s radial velocity line bisects the region resulting in a valley of negatively biased reflectivity values evident in Figure 6 a). The Z-Comp algorithm removes the
Figure 6. PPI displays of a) filtered reflectivity (dBZ) b) compensated reflectivity (dBZ) and c) the difference field (dB).
reflectivity bias resulting in a smooth field with no artificial valleys. The maximum of the difference field in Figure 6 c) is 3.0 dB, or half of the power. The region with the largest differences between filtered and compensated reflectivity occurs where there are small values of spectrum width and 0 m/s radial velocity close to the radar. Further in range where the widths are larger, the compensation values are less but cover a wider range of radial
-9 2 12 22 32 42 52 -0.2 0.2 0.6 1.0 1.4 1.8 2.2 a) b) b) c) a)
velocities. This is consistent with the characteristic response of the clutter filter.
The radial velocity correction results are shown in Figure 7. The clutter filter biases the radial velocity away from zero, i.e. positive velocities have a positive bias and negative velocities have a negative bias. The velocity compensation properly corrects these biases as evident in the difference field. On the positive (negative) side of the zero m/s line the correction acts to reduce (increase) the radial velocity, consistent with the expected clutter filter biases.
Figure 7. PPI displays of a) filtered radial velocity (m/s) b) compensated velocity (m/s) and c) the difference field (m/s) from IMPROVE II.
The radar estimated rainfall totals were computed using the filtered reflectivity and compensated reflectivity data for the period 13:33 to 20:08 UTC at an elevation angle of 1.5 degrees. The
computation was the standard Z-R relationship used in the WSR-88D radars. The results are plotted in Figure 8. The ovals in Figure 8 highlight where the clutter filter had the most impact on the estimated rainfall. It can be seen that using the compensated reflectivity smoothly fills in the rainfall deficit due to the clutter filters. The maximum difference in the rainfall totals is nearly 3.0 mm, or about 30%.
Figure 8. Radar estimated rainfall totals using a) uncorrected reflectivity and b) compensated reflectivity.
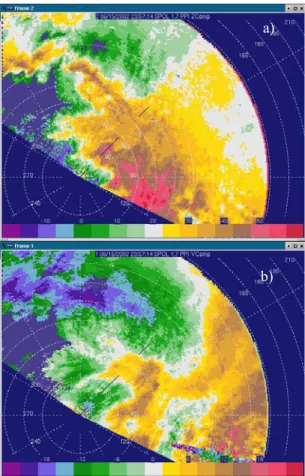
During the IHOP field program S-Pol was operating with the same 0.5 m/s notch width clutter filter used in IMPROVE II. Figure 9 shows a) compensated reflectivity and b) the corrected radial velocity for a convective case on June 15, -18 -12 -6 0 6 12 18 a) c) b) a) b)
2002. Figure 10 shows that the PDA correctly identifies the echoes as precipitation. The APDA (not shown) did not falsely detect AP clutter contamination.
Figure 9. PPI’s of a) compensated reflectivity (dBZ) and b) corrected radial velocity (m/s) from the IHOP field program.
Figure 11 shows the difference fields for a) reflectivity (Zcomp – Z) and b) radial velocity (Vcomp – V). This example demonstrates that the AP Clutter Mitigation Scheme performs well in convective cases.
4. Implementation
Implementation of the AP Clutter Mitigation Scheme on the WSR-88D radar network has begun. The Radar Echo Classifier is being deployed in ORPG build 2 by October 2002. Currently the AP Detection Algorithm (APDA) is the only REC algorithm to be implemented.
Incorporating the other REC algorithms is simplified in the context of the existing REC architecture.
Figure 10. PDA results for the convective example from IHOP.
Figure 11. Difference fields (corrected –
uncorrected) for a) reflectivity (dBZ) and b) radial velocity (m/s) from the IHOP field program.
a)
b)
a)
The WSR-88D users can view images of the REC output in the form of likelihood of AP clutter in 10% intervals on the Human Control Interface (HCI) of the ORPG and within the Automated Weather Information Processing System (AWIPS). The digital REC output data (likelihood in whole percents) is available for algorithm use. For example, the Precipitation Processing Subsystem (PPS) Enhanced Preprocessing (EPRE) algorithm will use the APDA output to remove AP clutter from the Hybrid Scan reflectivity data that is passed to the PPS Rate and Accumulation algorithms. EPRE will be deployed in ORPG Build 4. An example taken July 7 1994 in St Louis MO. is shown in Figures 12, 13 and 14.
Reflectivity (dBZ) Grey < 10 dBZ Blue 10- 20 dBZ Cyan 20-30 dBZ Green 30-40 dBZ Yellow 40-50 dBZ Red 50-60 dBZ Purple 60-70 dBZ
Figure 12. Reflectivity PPI showing AP clutter mixed with precipitation collected from the St Louis Missouri WSR-88D weather radar. Figure 12 shows the lowest elevation reflectivity factor (dBZ). The strong echoes to the northeast of the radar are AP clutter echoes and would strongly bias radar estimated rainfall rate if not removed. The results of the Radar Operations Center’s implementation of the APDA are shown in Figure 13 as a likelihood of clutter expressed in percent.
The algorithm successfully identifies the regions of AP clutter to the northeast of the radar. The clutter is removed by substituting uncontaminated higher elevation angle reflectivity data into regions where AP clutter was detected by the APDA. A threshold of 50% is used to define AP clutter. In this manner a clutter free hybrid scan is
constructed and can be used to estimate precipitation rate in the PPS. The hybrid
reflectivity scan corresponding to Figures 12 and 13 is shown in Figure 14. The clutter has been successfully replaced with uncontaminated data, enabling more accurate and useful radar precipitation estimates. Z - AP clutter Blue < 10% BlueCyan 10-20% GreenCyan 20-30% Green 30-40% GreenYellow 40-50% Orange 50-60% Red 60-70% Red/Purple 70-80% Blue/Purple 80-90% Grey/White > 90%
Figure 13. Display of the APDA results for the reflectivity shown in Figure 12.
Once automated clutter filter control and Z-Comp are implemented, the clutter filters will remove the AP clutter and Z-Comp will correct for the clutter filter bias in the lowest elevation angle of the next scan. This will enable the PPS to use the
Reflectivity Grey < 10 dBZ Blue 10- 20 dBZ Cyan 20-30 dBZ Green 30-40 dBZ Yellow 40-50 dBZ Red 50-60 dBZ Purple 60-70 dBZ
Figure 14. Hybrid reflectivity scan after removal of the AP Clutter contamination using the APDA results.
further improving the validity of the precipitation estimates.
5. Spectral domain processing
The National Weather Service (NWS) has plans to update the WSR-88D radar network with an Open Radar Data Acquisition (ORDA) processor beginning in the summer of 2004. The ORDA will allow spectral domain processing of radar data in real time, which has not been possible due to computing time limitations. Spectral domain processing has many advantages over the current radar signal processing. For example, ground clutter and point targets can be removed more easily. Also access to the spectral data should allow more precise reflectivity and velocity compensation. There are numerous existing techniques for clutter and point target removal and appropriate corrections, however, most are
untested in an operational setting due to computing limitations in the past.
In order to test and deploy spectral domain radar processing, the NWS is purchasing Sigmet Corporation’s RVP-8 Doppler processor. This system contains user programmable spectral processing capabilities. To facilitate research and development of spectral processing techniques, NCAR is in the process of acquiring the same Doppler processor and installing it on the S-Pol radar. This means that, as well as verifying the performance of existing spectral processing methods, new techniques can be developed and tested on S-Pol and readily implemented within the WSR-88D radars.
6. Acknowledgements
The NOAA Radar Operations Center (ROC) sponsors this research.
7 References
Ellis, S.M., 2001: Compensating reflectivity for clutter filter bias in the WSR-88D, Preprints, 17th Int’l IIPS Conf., AMS, Albuquerque, NM, 14-18 Jan 2001, 142-145.
Kessinger, C, S. Ellis and J. VanAndel, 2003: The radar echo classifier: A fuzzy logic algorithm for the WSR-88D. Preprints-CD, 3rd Conference on Artificial Intelligence Applications to the
Environmental Sciences, AMS, 9-13 February 2003, Long Beach CA.
Kessinger, C., and J. Van Andel, 2001: The Radar Echo Classifier for the WSR-88D. Preprints, 17th Int’l IIPS Conf., AMS, Albuquerque, NM, 14-18 Jan 2001, 137-141.
Kessinger, C., S. Ellis, J. Van Andel, 1999: A fuzzy logic, radar echo classification scheme for the WSR-88D, Preprints, 29th Int’l Conf. Radar Meteorology, AMS, Montreal, Canada, 12-16 July 1999, 576-579. Kosko, B., 1992: Neural Networks and Fuzzy Systems:
A Dynamical Systems Approach to Machine Intelligence. Prentice-Hall, N.J.
Vivekanandan, J., D.S. Zrnic, S. M. Ellis, R. Oye, A.V. Ryzhkov and J. Straka, 1999: Cloud microphysics retrieval using S-band dual-polarization radar measurements. Bull. Amer. Met. Soc., 80, 381-388.