Teaching and Learning with BlueJ: an Evaluation
of a Pedagogical Tool
Kelsey Van Haaster and Dianne Hagan
Monash University, Melbourne, Australia
[email protected]
[email protected]
Abstract
BlueJ is a programming environment that has been used to teach object-oriented introductory programming since 1999 in two consecutive first year units at Monash University. An earlier evaluation of its effectiveness in helping students to learn OO programming in the first unit was inconclusive, although most students who participated in the study believed that it did help them to learn Java. It was hoped at that time that students would show positive effects of using BlueJ more in the second unit than in the first. This paper reports on a later evaluation study, when the BlueJ environment had become more stable and easier to install. It examines the reactions and results of students in the second of the two units. It also introduces a set of criteria for evaluating environments designed for novice programmers.
Keywords: introductory programming, programming environment, BlueJ, Java, evaluation crite-ria.
Introduction
The BlueJ programming environment (Kölling & Rosenberg, 1996) was designed and imple-mented by Michael Kölling and John Rosenberg in order to improve the teaching and learning of introductory programming in an object-oriented style using Java as the implementation language. BlueJ gives students a graphical picture of the classes and objects in a system, allows students to interact with them directly, simplifies testing of methods and classes, and removes the necessity for much difficult and confusing Java code such as the main method in a class.
An earlier paper (Hagan & Markham, 2000b) described the advantages of using BlueJ to teach Java to novice programmers, and the kinds of help offered to students, and reported on the results of an initial evaluation of the effectiveness of BlueJ. This evaluation was done during the first semester of the use of BlueJ, in 1999, when it was still a comparatively unstable Beta version and many students found its installation procedure complicated. That study found that, of the one-third of students who participated in the study, most warmed to BlueJ during the semester after an initial period of frustration, and felt by the end of semester that BlueJ had been a help to them in learning Java. However, these self-selected students had significantly better results in the unit
than students who did not participate in the study, and therefore it was felt that more evaluation was needed. This is a follow-up study to that first one. It examines the perceptions of students in the second of the two con-secutive first year programming units, when they have become more
experi-Material published as part of this journal, either on-line or in print, is copyrighted by Informing Science. Permission to make digital or paper copy of part or all of these works for personal or classroom use is granted without fee provided that the copies are not made or distributed for profit or commercial advantage AND that copies 1) bear this notice in full and 2) give the full citation on the first page. It is permissible to abstract these works so long as credit is given. To copy in all other cases or to republish or to post on a server or to redistribute to lists requires specific permission from the pub-lisher at [email protected]
enced in programming and in using BlueJ. It was hoped that, by this time, students would no longer confuse BlueJ and Java and would be able to appreciate the benefits that BlueJ offers.
The Two First Year Programming Units
The first of these two units focuses on the basics of object-oriented programming. It covers classes and objects; message passing; sequence, selection, and repetition; basic data types and some library classes; arrays of basic data types and objects; objects as attributes of other classes; and testing of classes and methods. As part of their assessment, students are required individually to write a program that uses six to eight interacting classes, including at least one that is supplied by the teaching staff. Examples of assignments that have been used include a board game, a video shop, a gift registry system and an online cinema ticketing system.
Most students find this unit difficult and time consuming. This is partly because there is a great deal to learn, but also because it is their first semester at university. Many of them are disoriented for weeks, learning how the university system works, and not used to being expected to motivate themselves to work consistently on several different units. International students are adjusting to a different language and culture, finding accommodation, and generally concentrating on many other things besides learning to program. For these reasons, we offer a great deal of help with their programming units, as documented in Hagan & Markham (2000b). Student resources in-clude lectures, discussion classes and lab sessions, a helpdesk staffed by tutors in the unit, avail-ability of lecturers and tutors for personal contact by email and in person, and a unit website in-cluding an anonymous feedback facility. The unit assessment consists of two unit tests during the semester, three stages of the assignment, and a final examination.
At the end of the first semester, students are expected to be able to design and write small pro-grams in Java, debug them, and test them properly. There is an emphasis on software engineering principles such as coding standards, test strategies and maintainability of programs.
By the time students reach the second programming unit, they are expected to have settled into university life and know how to learn and motivate themselves. Those who are completely un-suited to the course have probably left.
This second unit moves on to more advanced object-oriented topics such as inheritance, abstract classes and polymorphism. Program design is covered in more detail, although there is a later unit in the course devoted to this. Data structures and algorithms are covered from an object-oriented perspective, i.e. students are taught to use the library classes rather than build their own data structures. This unit also covers more advanced Java topics such as exception handling, file han-dling, and interfaces. Students are still given the same kinds of help as for the first unit, but are expected to do a large amount of reading as well.
The assignment for this unit requires students to build a system that is considerably more exten-sive than the one they wrote for the first unit. They must submit design documents including class diagrams and use case and CRC analyses of the system. They must implement and test the system thoroughly. They must also submit a report explaining what they have done and why. The final examination is online, and requires students to write and test a substantial program that incorpo-rates most of the techniques introduced during the semester.
Initial Evaluation of BlueJ
The first evaluation of BlueJ was done during its first semester of use, in 1999 (Hagan & Mark-ham, 2000b). After an initial survey to collect demographic information about the students, we used two surveys (one in the middle of semester and one at the end) to ascertain their perceptions of BlueJ and how much help they thought it was in learning Java. Most students had a positive
shift in their perceptions of BlueJ during the semester. We also emailed a small sample of stu-dents for more detailed comments during the semester.
As this was the first semester we had used Java as the implementation language for first year pro-gramming, we could not compare students' results in Java with and without BlueJ. As a general indication of whether we were on the right track, we looked at the overall results of the students, compared with the two previous years when C++ had been the implementation language in the same unit (see Table 1).
It can be seen that the percentage of students achieving distinctions or high distinctions was about the same as the previous year, the percentage achieving a pass or credit had increased, and the
percentage of fails had decreased.
Subsequent Evaluation of BlueJ –
Background and Rationale
Information gathered during the first evaluation of BlueJ was used to inform the development of a production version of the tool, which was released for general use in late 2001. The results from the first study, whilst generally positive, clearly identified the extent to which the results were influenced by the problems inherent in the Beta version of the software and the lack of program-ming experience of the participants. This first study indicated the need for further evaluation us-ing a more complex evaluation model and a non-Beta version of the software (Hagan & Mark-ham, 2000b). The evaluation of BlueJ that is the focus of this paper was intended to address this need and was conducted using a stable release version of the tool. The participants in the second study were enrolled in their second programming unit and therefore had more programming ex-perience, and more experience using BlueJ, as did the staff who developed and taught the unit. The material in the second programming unit requires students to develop an understanding of more abstract object-oriented concepts; students are required to demonstrate their understanding of ideas such as inheritance and polymorphism, and use more complex programming techniques including dynamic data structures, exception handling and file and text input-output. These are exactly the kinds of concepts that tools such as BlueJ are intended to help with; therefore, it was felt that students completing their second programming unit might be in a better position to evaluate the tool itself than the group completing their first programming unit.
The objective of using software visualisation techniques to teach programming is to promote an understanding of the concepts being taught ( Stasko, Dominigue, Brown, & Prince, 1998), (Gomez Henrïquez, 2001), (DeClue, 1996). To this end, the last thirty years have seen the devel-opment of a large number of tools that employ these techniques to various extents. Some of the better known are BALSA-II (Brown, 1988) an algorithm animator and one of the earliest
soft-Table 1: Overall results in first semester programming unit
Number of Stu-dents % High Distinction %
Distinc-tion % Credit % Pass (Fail) % N
1997 (C++) 309 28 13 18 14 27
1998 (C++) 338 26 9 17 19 29
ware visualisation tools designed to run in student lab environments; Zeus, an algorithm anima-tion environment developed at the DEC systems Research Centre (Brown, 1990); and Jeliot 2000 (Levy, Ben-Ari, & Uronen, 2000), an application-based programming environment based on Jeliot, a web-based algorithm animator ( Haajanen, Pesonius, Sutinen, Tarhio, & Vanninen, 1997). Probably the best known visual programming tool is Logo, which now offers a mature language and environment (Malfatti, 2001).
Whilst these tools all use visualisation to support the understanding of algorithms and the flow of execution, many of them do not use commercially popular languages. Some require annotation or modification of source code in order to produce their visualisations. Tools that provide a fully integrated object-oriented programming environment, and which are designed to support the teaching process, are relatively few in number, and have not been extensively evaluated (Kölling & Rosenberg, 1996), (Jerding & Stasko, 1994). The evaluations that have been performed on vis-ual tools to date have been conducted on prototype versions of tools over a short period of time. It has not been shown conclusively that software visualisation promotes a greater understanding of object-oriented concepts (Ben-Ari, 2001; Wiggins, 1998).
Research Design
Methodology
The objective of the second evaluation of BlueJ was to investigate the effectiveness of BlueJ as a tool for teaching both principles and practice of object-oriented programming (OOP) to novice programming students. Several possible approaches were considered, and a descriptive study us-ing survey research was selected as the most appropriate instrument for the study. Survey re-search supported the collection of both qualitative and quantative data, and was considered to be the most effective way of collecting a broad range of responses.
A detailed review of the related literature revealed that, whilst a number of taxonomies for the evaluation of software visualisation tools already existed, these were often designed to support the selection of a tool rather than the evaluation of a tool. Further, many of these taxonomies were either very general (Roman & Cox, 1993), or focussed on specific aspects of visual tools
(Vanthienen & Poelmans, 1996). Only one of the taxonomies focussed on the use of software visualisation to support understanding in OOP (Jerding & Stasko, 1994), and only those taxono-mies designed for the evaluation of commercial tools included criteria for evaluating the usability or accessibility of the tools. It was apparent that a need existed to develop a taxonomy that could be used for the evaluation of tools designed for use in an educational environment.
The Development of an Interpretive Framework
All the existing taxonomies described groups of criteria that should be met by visual tools. In all cases these criteria were organised by category. Each taxonomy, however, described different categories and different criteria within each category. Points of agreement existed throughout the taxonomies, but these were diffuse and there was little consistency in either the scope or descrip-tion applied to each category and criterion. The process of preserving the commonalities between the various taxonomies, and identifying criteria that were not included, resulted in a three-part interpretive framework that could be used to evaluate an educational software visualisation tool. A detailed description of each category and the criteria it includes can be found in van Haaster (2003); this is summarised in Table 2.
Usability
The first category of essential criteria is usability; this category deals with general human-computer interface and performance issues, and identifies 5 criteria that should be met by an edu-cational tool. This area was least well addressed by the existing taxonomies. Whilst several dis-cussed the importance of the user interface (Jerding & Stasko, 1994; Roman & Cox, 1993), these focused on learnability. Only two discussed issues of accessibility, and both were designed for the evaluation of commercial tools, (Mosley, 1992; Phillips, Mehandjiska, Griffin, Choi, & Page, 1998). The critical point in terms of tool usability is the extent to which a user can transfer his existing knowledge to the tool; students should not have to invest a large amount of time obtain-ing, installing and learning to use a tool before they can begin to learn programming.
Paradigm support
Many of the software visualisation tools available require the annotation or mark-up of source code in order to produce their visualisations. Only a few are able to provide dynamic visualisa-tions of source code, and even fewer are able to provide visualisavisualisa-tions during the development process. A tool designed to teach object-oriented programming should fully support this approach and should use standard versions of a language and notation to do so. The links between the source code and the resulting visualisation must be clear; students should be able to identify a cause and effect relationship between the source code they write and the data structures that result from it. This is essential if the benefits of providing visualisations to support understanding are to be realised (Gomez-Henrïquez, 2001).
Teaching and learning support
Bloom's taxonomy of educational objectives (Bloom, 1956) identifies learning as changes in stu-dent behaviour in three domains: Cognitive, which describes the acquisition and use of knowl-edge; Psychomotor, which describes the development of practical skills; and Affective, which deals with a student's attitude and approach to new material. In order to provide value for time on task, any tool designed for student use must support learning across all three domains. Each do-main describes the progress of learning as a sequence of behaviours that a student at a given level can be expected to exhibit. In order to support the evaluation of BlueJ against this area of the in-terpretive framework, the expected behaviour of a first year programming student was mapped to each step within these three domains (van Haaster, 2003). For example, in the Cognitive domain, a student should be able to use a tool to experiment with the concepts and ideas introduced in
Table 2: Overview of the Interpretive Framework
Framework Area Essential Criteria
Usability
Uses familiar idioms
Is accessible and easy to install Is stable and predictable Is customisable
Supports both novice and expert users Paradigm Support
Uses a standard version of a programming language Uses standard notation and terminology
Links source code and visualisation Teaching and Learning
Support
Supports learning in the cognitive domain Supports learning in the affective domain Supports learning in the psychomotor domain
week 1, such as objects encapsulating attributes and behaviour and responding to messages passed to them. At the beginning, only basic knowledge is present, with little understanding. The tool should allow the student to move through the levels of Bloom's taxonomy from knowledge to comprehension, application, analysis, synthesis and evaluation, by supporting the structured de-velopment of programs as laboratory exercises or assignment work. Throughout this process the visual tool should not require any modification, and should be immediately usable regardless of the student's level of learning.
As an example of the mapping of expected student behaviour to Bloom's taxonomy, at the Analy-sis level in the Cognitive domain, a student might be expected to be able to make judgments about which control structures would be appropriate in certain situations, and to predict the output and execution behaviour of an arbitrary piece of source code.
The Evaluation Process
The interpretive framework was used to guide the evaluation of BlueJ by both direct examination of the tool itself and, where appropriate, using student responses to a survey. Students undertak-ing the second compulsory programmundertak-ing unit were asked to volunteer to participate in the study by completing a survey about their use and perceptions of BlueJ. The surveys were handed out during a tutorial class and participants were assured that their responses would be completely anonymous. In the first section of the survey, students were asked to supply some general demo-graphic information along with an indication of the amount of experience they had had using BlueJ. The subsequent sections of the survey took the form of several mini-surveys that asked students to indicate the degree to which they had found various features offered by BlueJ useful. Students were also invited to make written comments about the best and worst aspects of each feature. The final section of the survey asked students to indicate the degree to which they felt that BlueJ helped them to understand object-oriented programming and the degree to which BlueJ would help them to pass the unit.
Results and Discussion
The first survey returned 115 responses, from a total population of 214 students. Of those who responded, 88% had used BlueJ in the prerequisite unit sometime during the previous three se-mesters, and 89.6% were attempting the current unit for the first time. All the survey respondents indicated that they were using BlueJ to complete the unit work, even though they were not re-quired to use BlueJ. The code samples and tutorial exercises supplied during the course could have been used in any Java programming environment with no or only minimal modification. The data collected and analysed for this study is available online at (Van Haaster, 2004).
Usability
The usability of BlueJ was evaluated against the framework's usability criteria, using a combina-tion of direct evaluacombina-tion and survey responses.
The use of familiar idioms
The use of familiar idioms supports the transferability of knowledge. BlueJ, like Java, is designed to be platform independent. Since BlueJ is written in Java, its ability to match its look and feel to whatever operating system is being used is dependent on the capabilities of the Java Swing librar-ies for that particular platform. The students who participated in this study were using the Win-dows 2000 platform and noted some frustration with poor mouse functionality available to them, in particular right button and scrolling functionality. This was very much a limitation of the un-derlying Swing libraries in use at that time rather than a limitation of BlueJ, and would probably
not have been an issue had the students been using the Macintosh platform which, by default, supports only single mouse button functionality.
Ease of installation
Installation difficulties were highlighted in the earlier BlueJ study (Hagan & Markham, 2000) as a key problem for students. This was not evident in this later study; installation of the version used by this time was via a native Windows executable and was a simple process where the de-fault options could be selected in nearly all cases. There were no student reports of installation difficulties, in contrast to earlier semesters when students reported being still unable to install the software at home after several weeks.
Accessibility
BlueJ is very accessible; it is free of charge for educational use and involves a small download from the internet. The Java programming language is also free to download and, whilst it is much larger in size than BlueJ, it is available on CD from a variety of sources, including in many text-books.
Stability, predictability and performance
Stability is a key issue for novice programming students, as the process of learning to program often produces source code that results in instability in a system. Novice programmers often do not realise that it is their code that has caused the problem in the first place and may attribute this to the development environment or operating system; a number of student comments highlighted this issue:
“Sometimes you cannot terminate the execution of an infinite loop, you have to exit BlueJ and re-run the program”
“I use BlueJ 1.4 and sometimes I find it hangs/crashes sometimes or sometimes unexpected behav-iour"
Students were asked to rate the stability of BlueJ on a Likert scale ranging from 1 (very poor) to 5 (very good). 84.3% of the re-spondents indicated that they found BlueJ’s stability to be acceptable or better; the mean response to this question was 3.48, but the median was 4 (see Table 3). There were few reports from the student group during the semester of difficulties with BlueJ’s stabil-ity, and this, coupled with experience from previous semesters and the survey data, supports the belief that stability is not a sig-nificant problem.
Acceptability of speed or performance was raised as an issue. The mean response to this question was 2.75, but the median was 3. The issue was mentioned in several student comments, and was the most frequent response to the question “What do you like least about using BlueJ?” It should be noted, however, that the computers in the student laboratories at that time were due to be up-graded and did not have the optimal configuration for running BlueJ.
Table 3: Stability and speed of BlueJ
Stability BlueJ's BlueJ's Speed
N Valid 113 114
Missing 2 1
Median 4.00 3.00
Minimum 1 1
Customisability
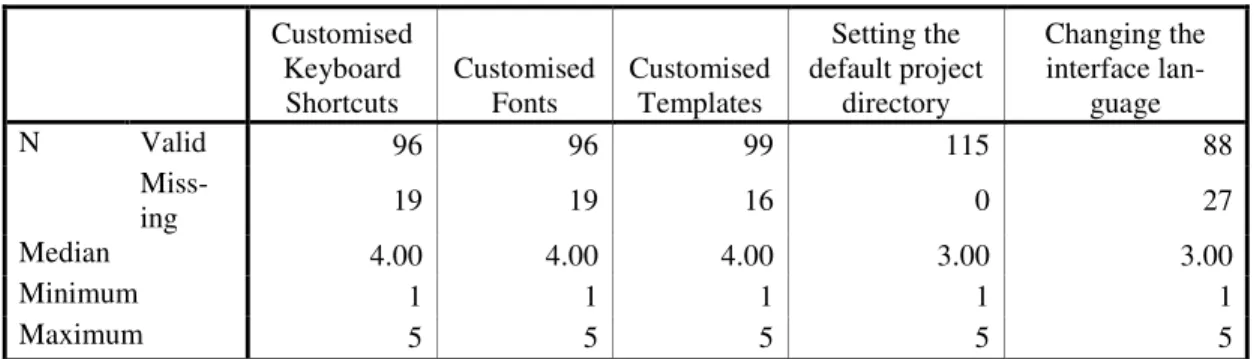
A tool should be customisable to whatever extent a user requires (Cooper, 1995), including being able to be used without any customisation. It is possible to customise BlueJ in a variety of ways, ranging from the very simple process of changing properties via a menu, to writing a new inter-face language template. Students were asked how useful they found the ability to customise BlueJ in a variety of different ways, including the ability to create their own keyboard shortcuts, cus-tomise the editor fonts used and change the default appearance of the class and method templates provided. In all cases the mean response suggested that students found these features useful to some extent. It is interesting to note that the lowest median response was recorded to the question about the usefulness of setting the default project directory (see Table 4). This is interesting be-cause the version of BlueJ used in the study defaulted to the folder in which BlueJ was installed, when a user chose to open or create a new project. This meant that students always needed to browse to the location of their work, especially as there was no facility to select from a list of re-cently used files. It seems likely that this behaviour is common to that exhibited by many Win-dows-based applications, although most of these do present users with the option of selecting from a list of recently used files.
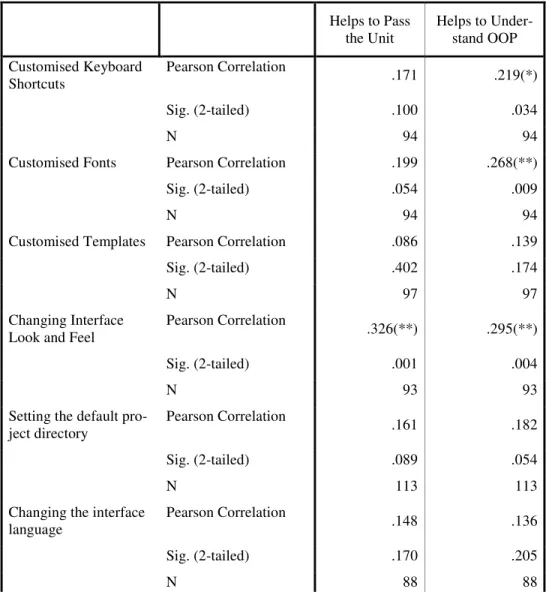
The relationship between the extent to which a student had found the ability to customise BlueJ useful and the extent to which they felt that BlueJ would help them to pass the unit was explored using a Pearson product-moment correlation (see Table 5). No significant relationship was found, which suggests that, whilst BlueJ is customisable, it does not require customisation in order to be useful.
Support for both novice and expert users
The speed with which a novice user of a piece of software becomes an intermediate or expert user is moderated by the extent to which the user can transfer his knowledge (Cooper, 1995). The stu-dents who participated in this study had all had at least one semester of experience with at least one programming language. Most had also used BlueJ for at least one semester, so none of them were complete computer programming novices as had been the case in the earlier study (Hagan & Markham, 2000a). That earlier study indicated that BlueJ provided excellent support for novice users, with the exception of some installation difficulties, which had since been resolved.
Table 4: How useful is it to be able to customise BlueJ? Customised
Keyboard
Shortcuts Customised Fonts Customised Templates
Setting the default project directory Changing the interface lan-guage N Valid 96 96 99 115 88 Miss-ing 19 19 16 0 27 Median 4.00 4.00 4.00 3.00 3.00 Minimum 1 1 1 1 1 Maximum 5 5 5 5 5
In their responses to this study, many students indicated that they were willing to customise and experiment with the tool to some extent. A few made comments that suggested some critical analysis of the tool, and therefore a deeper level of engagement with it:
“Able to instantiate an object from a class (visually) able to play around with libraries and understand the use of it (eg array list) tools - use library class”
“1. When something is running you can't compile again. It gives error message but in-stead of that if you design something which ask users that program is running, you want to compile it anyway. If user selects yes then terminate the executing program and com-pile again.
2. While you run something then again you run something both the o/p of these are on the terminal, we need to clear it manually. I think you can do something so if user closes that terminal it erases everything from terminal”
BlueJ provides users with a number of support mechanisms including an email discussion list and a website that includes a Frequently Asked Questions section. The website was reported as being useful by 68% of the survey respondents, and 41% reported that they had found the FAQ pages
Table 5. The relationship between customisation of BlueJ and the extent to which stu-dents found it useful in understanding OOP or in passing the unit.
Helps to Pass the Unit Helps to Under-stand OOP Customised Keyboard
Shortcuts Pearson Correlation .171 .219(*)
Sig. (2-tailed) .100 .034
N 94 94
Customised Fonts Pearson Correlation .199 .268(**)
Sig. (2-tailed) .054 .009
N 94 94
Customised Templates Pearson Correlation .086 .139
Sig. (2-tailed) .402 .174
N 97 97
Changing Interface
Look and Feel Pearson Correlation .326(**) .295(**)
Sig. (2-tailed) .001 .004
N 93 93
Setting the default
pro-ject directory Pearson Correlation .161 .182
Sig. (2-tailed) .089 .054
N 113 113
Changing the interface
language Pearson Correlation .148 .136
Sig. (2-tailed) .170 .205
useful to some extent. Both a reference manual and a user manual are available, but both of these were in an incomplete state and were not well used by the survey respondents.
When evaluating a tool against this criterion, it is important that the evaluation is performed in the correct context. BlueJ is designed to teach novice programmers, and is not intended to be an industrial strength development tool for an expert programmer. The results from the first study suggest that BlueJ supports the needs of novice programmers, by hiding complexity and present-ing a non-threatenpresent-ing interface, whereas the results of the second study suggest that more experi-enced and more adventurous students are still supported in the same way.
Paradigm and Language Support
The use of a standard version of a programming language, notation
and terminology
A tool designed to teach object-oriented programming should support the development of generic programming skills that can be immediately used by students outside of the development or teaching environment. Many of the software visualisation tools currently available do work with commercial programming languages; however, in some cases, they require that users annotate or modify their source code in order to produce visualisations. Some of the best known software visualisation tools introduce their own notation and methodology to support learning (The Logo Foundation, 2003). Whilst this approach has merit, students may then need to "unlearn" a particu-lar approach in order to begin using commercial tools. There is a great deal of support for the idea of an objects first approach to teaching object oriented programming, and this is supported by BlueJ (Kölling & Rosenberg, 2000), which uses a standard version of the Java programming lan-guage and a subset of UML (Object Management Group, 2003) as its design notation.
Linking source code and visualisation
The underlying objective of educational software visualisation tools is to support student under-standing of the mechanisms of software development. Visualisations can help students in numer-ous ways; for example, visual debuggers can help students to reconcile the cause and effect rela-tionship between the source code that they write and the resulting output. Algorithm animations can assist students to choose between different sorting or searching algorithms, and other kinds of visualisations can assist with the understanding of more abstract concepts such as object state and object identity versus equality. Some of the problems identified with visualisations of abstract concepts are the inherent difficulties associated with synchronising the mental models of the stu-dent and the teacher (Ben-Ari, 2001). In "The Design of Everyday Things", Norman (1990) ar-gues that a common starting point is essential in order to develop a shared mental model of a con-cept. As students entering a course may well have a range of different backgrounds, this cannot be assumed.
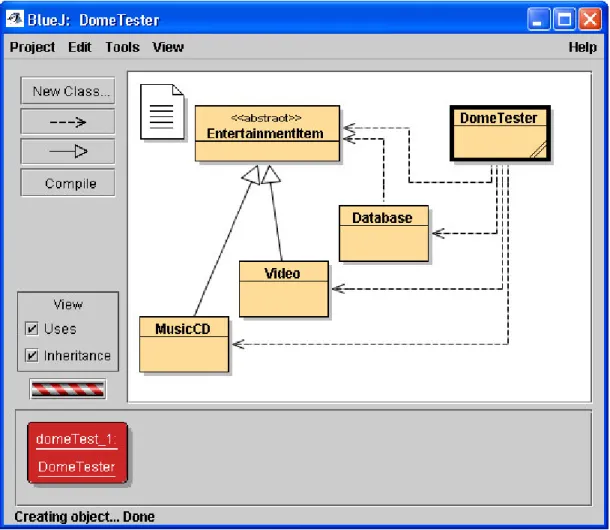
BlueJ provides students with a range of different visualisations that support the whole software development process, via its main project window (see Figure 1).
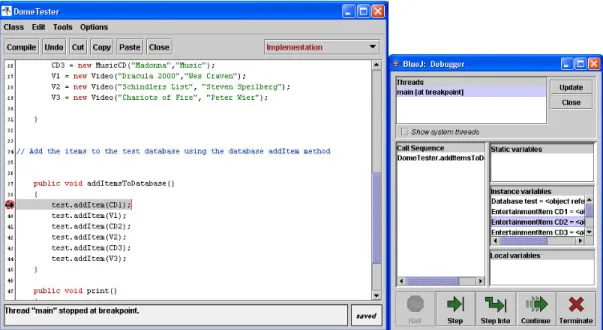
These include the automatic generation of simple UML notation to show the relationships be-tween classes. Complete novice students can create a visual representation of a class and then instantiate that class, inspect its state and call its methods without writing any source code at all. More advanced students can visually create and manipulate instances of classes they have written or classes provided by the Java API. BlueJ’s editor uses syntax highlighting of source code to provide constant visual feedback, and a simple interactive debugger allows students to watch the execution path and the changing state of variables in their code (see Figure 2).
Students were asked to indicate the degree to which they found the various visualisations pro-vided by BlueJ useful. Editor syntax highlighting was reported to be useful by 91% of respon-dents, and more than 60% of respondents indicated that they found each other feature useful to some extent.
A number of student comments elaborated on these results:
“The objects sit there as objects helps to put it together in your head, the object oriented concept that is”
“Good interface makes it easy to see the connection between classes and objects and un-derstanding encapsulation and inherited methods”
Figure 1 The BlueJ Project Window
Figure 1 The BlueJ Project Window
Teaching and learning support
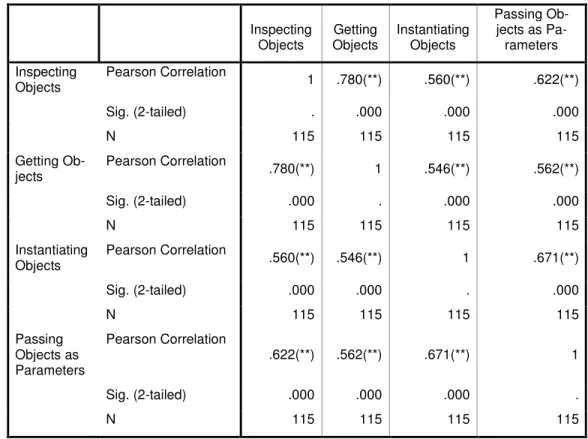
Student learning in the cognitive domain according to Bloom's Taxonomy (Bloom, 1956) was evaluated by exploring the degree to which students made use of the various features of BlueJ that are intended to support higher order skill development. These skills included the ability to instantiate a class and call the object's methods, to pass an instance of a class as a parameter to a method of another object, to instantiate and use library classes, and to accessand manipulate ob-jects that are attributes of other obob-jects. Pearson product-moment correlation was used to explore the interrelationships between a student's use of these features (see Table 6).
The results suggest that the use of one of these features increases the likelihood of others being used. The mapping of the domain to student behaviour proposed in (van Haaster, 2003) suggests that these students were working at the analysis and synthesis levels, which was considered ap-propriate as the survey was conducted at approximately mid-semester.
Student learning in the affective domain was evaluated by examining the students’ responses to error messages. A student working at the Valuing, Organising and Characterising level of the af-fective domain is willing to attempt to help firstly himself, and then others, when a problem is encountered. All students see error messages, but how they deal with them differs considerably. A student who is developing higher-level skills in this domain will see error messages as informa-tional. This student will attempt to devise his own solution, by trying to understand the message. A student who is still working at the Receiving or Responding levels may exhibit poor learning tendencies (Carbone, Hurst, Mitchell, & Gunstone, 2000) such as immediately calling for help.
Figure 2: The BlueJ Debugger Figure 2: The BlueJ Debugger
BlueJ presents compiler error messages one at a time in an editor window. The line of source code that precipitated the message is highlighted. Students can click on a question mark symbol in order to be presented with an explanation of the message and, in some cases, an approach to fixing the problem. This feature is, unfortunately, currently somewhat incomplete, which was the cause of some frustration amongst the survey respondents.
The respondents were asked to rate the usefulness of both the compiler generated error messages and the detailed error messages on a Likert scale of 1 (not useful) to 5 (very useful). The mean responses to these questions were 4.29 and 3.97 respectively, and the strength of the relationship between a student's rating of both kinds of messages suggests that students were seeking their own solutions to problems, and considered error messages as informative.
Learning in the Psychomotor domain is evidenced by the student's willingness to use and engage with the tool in order to improve her practice and expand her skills. Many of the comments made by students indicated that they found the tool helpful and easy to use.
"It is a good introductory tool as mentioned before it is non confronting like say Jbuilder to an inexperienced programmer which is quite complex to look at. Does have similari-ties with other tools like JBuilder so it would not be hard to move on but not necessary ei-ther, also like the applet viewer”
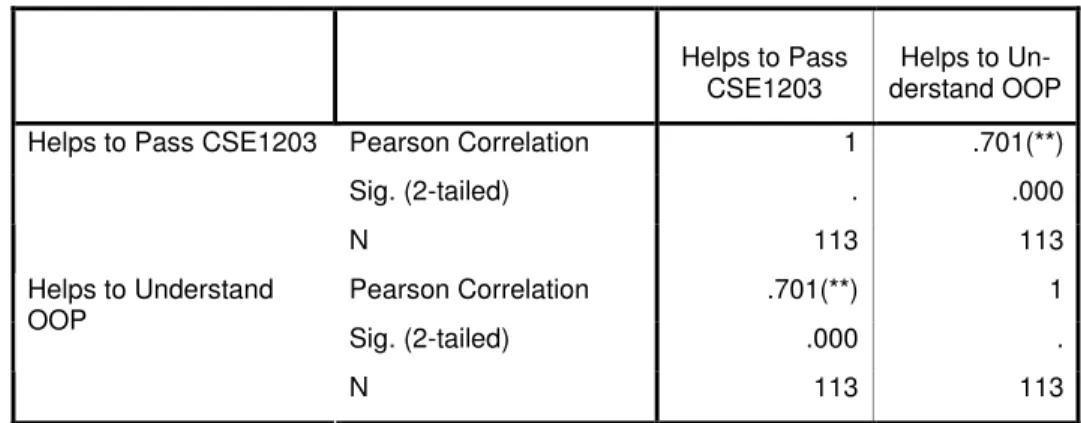
Students were asked to indicate the degree to which they felt the tool was helpful in supporting their understanding of object-oriented programming and in helping them to pass the unit (see Ta-ble 7).
Table 6: Student use of features that support cognitive learning
Inspecting Objects Objects Getting Instantiating Objects
Passing Ob-jects as Pa-rameters Inspecting
Objects Pearson Correlation 1 .780(**) .560(**) .622(**)
Sig. (2-tailed) . .000 .000 .000
N 115 115 115 115
Getting
Ob-jects Pearson Correlation .780(**) 1 .546(**) .562(**)
Sig. (2-tailed) .000 . .000 .000
N 115 115 115 115
Instantiating
Objects Pearson Correlation .560(**) .546(**) 1 .671(**)
Sig. (2-tailed) .000 .000 . .000 N 115 115 115 115 Passing Objects as Parameters Pearson Correlation .622(**) .562(**) .671(**) 1 Sig. (2-tailed) .000 .000 .000 . N 115 115 115 115
A strong relationship between the students’ responses to the two questions suggests that those students who had engaged with the tool found that it supported their understanding of the material presented.
Conclusion and Further Work
BlueJ performed well against all the criteria specified by the interpretive framework. Student re-sponses indicated that they were using the features of BlueJ that are designed to facilitate higher order skills development in the cognitive, affective and psychomotor domains. Their perceptions were that BlueJ helped them to understand the object-oriented paradigm. As we did not (for ethi-cal reasons) have a control group that studied Java but did not use BlueJ, we are unable to make a comparison between those who used BlueJ and those who did not. However, all students had been taught in the previous unit how to write and execute Java code without using BlueJ, using the Java SDK. In the second unit, they were not required to use BlueJ but could have chosen to use the SDK or some other integrated development environment. The fact that all of the respon-dents were using BlueJ indicates that they saw it as beneficial to them.
Some usability issues were identified, such as the incomplete nature of some of the documenta-tion and the support for detailed error messages. It should be noted that many of the usability problems identified by respondents of this study have been solved in subsequent releases of the software. BlueJ's ability to help students to link source code and visualisations is one of its great-est strengths and is integral to BlueJ’s ability to support learning in the cognitive domain. The interpretive framework developed for this study will be useful in evaluating other IDEs de-signed for teaching in the future.
Skills learned in the first programming courses should be transferable to other programming envi-ronments and languages. Questions about whether BlueJ’s approach makes this transfer easier or more difficult remain unanswered.
During the last two years the number of courses using BlueJ, across a range of educational levels throughout the world, has increased markedly to more than 300 in number. Many of these courses have been using BlueJ for several semesters. There is now a large body of experience and exper-tise amongst those using BlueJ to teach novice programmers. This knowledge and experexper-tise could be harvested via a study of the way in which teachers are using BlueJ, which might provide more insight into the degree to which BlueJ supports the teacher as well as the student.
References
Ben-Ari, M. (2001). Program visualisation in theory and practice. Upgrade, 11 (2), 8-11. Table 7: The relationship between understanding OOP and passing the unit
Helps to Pass CSE1203 derstand OOP Helps to
Un-Pearson Correlation 1 .701(**)
Sig. (2-tailed) . .000
Helps to Pass CSE1203
N 113 113 Pearson Correlation .701(**) 1 Sig. (2-tailed) .000 . Helps to Understand OOP N 113 113
Bloom, B. S. (1956). Taxonomy of educational objectives: The classification of educational goals. New York: Longman.
Brown, M. (1990). Zeus: A system for algorithm animation and multi-view editing. Proceedings 1991 IEEE Workshop on Visual Languages, 4-9.
Brown, M.H. (1988). Exploring algorithms using Balsa-II. IEEE Computer, 21(5), 14 - 36.
Carbone, A., Hurst, A.J., Mitchell, I. & Gunstone, D. (2000). Principles for designing programming exer-cises to minimise poor learning behaviours in students. Proceedings of Australasian Computing Edu-cation Conference ACE2000, 26-33.
Cooper, A. (1995). About face: The essentials of user interface design. New York: Wiley.
DeClue, T. (1996). Object-orientation and the principles of learning theory: A new look at problems and benefits. Proceedings of the twenty-seventh SIGCSE technical symposium on Computer science educa-tion.
Gomez Henrïquez, L.M. (2001). Software visualization: An overview. Upgrade, 11(2), 4-7.
Haajanen, J., Pesonius, M., Sutinen, E., Tarhio, J. & Vanninen, P. (1997). Animation of user algorithms on the Web IEEE Symposium on Visual Languages, 360-367.
Hagan, D. & Markham, S. (2000a). Does it help to have some programming experience before beginning a computing degree program? Proceedings of Integrating Technology into Computer Science Education Conference ITiCSE-2000, 25-28.
Hagan, D. & Markham, S. (2000b). Teaching Java with the BlueJ environment. Proceedings of Austral-asian Society for Computers in Learning in Tertiary Education Conference ASCILITE 2000. Jerding, D. F. & Stasko, J.T. (1994). Using visualisation to foster object oriented program understanding.
Technical report, Graphics Visualisation and Usability Centre, Georgia Institute of Technology. Kölling, M. & Rosenberg, J. (1996). An object-oriented program development environment for the first
programming course. SIGSE Bulletin, 28 (1), 83-87.
Kölling, M. & Rosenberg, J. (2000). BlueJ: The hitch-hiker's guide to object orientation. Technical report, The Maersk Mc-Kinney Moller Institute for Production Technology, University of Southern Denmark, Technical Report 2002, No 2, ISSN No. 1601-4219
Levy, R. B.-B., Ben-Ari, M., & Uronen, P.A. (2000). Tango: The Jeliot 2000 program animation system.
Journal of Visual Languages and Computing.
The Logo Foundation (2003). Retrieved 12/12/03 from http://el.www.media.mit.edu/logo-foundation Mosley, V. (1992). How to assess tools efficiently and quantitatively. IEEE Software, 29-32.
Norman, D. A. (1990). The design of everyday things. New York: Doubleday. Object Management Group (2003). Retrieved 12/12/03 from http://www.omg.org
Phillips, C., Mehandjiska, D., Griffin, D., Choi, M.D. & Page, D. (1998). The usability component of a framework for the evaluation of OO CASE tools Proceedings of Software Engineering: Education and Practice, 134-141.
Roman, G.-C. & Cox, K.C. (1993). A taxonomy of program visualisation systems. IEEE Computer, 11-24. Stasko J., Dominigue B., Brown, M. & Prince, B.A. (eds.) (1998). Software visualization: Programming as
a multimedia experience. Cambridge MA: MIT Press.
Van Haaster, K. (2003). Introductory programming in an OO environment: An evaluation of a visual tool. (Honours thesis, Monash University, 2003).
Van Haaster, K. (2004). Retrieved 5/3/04 from
Vanthienen, J. & Poelmans, S. (1996). A general framework for positioning, evaluating and selecting the new generation of development tool. EUROMICRO 96. Beyond 2000: Hardware and Software Design Strategies Proceedings of the 22nd EUROMICRO Conference, 233-240.
Wiggins, M. (1998). An overview of program visualisation tools and systems. Proceedings of 36th ACM South EastRegional Conference, 194-199.
Biographies
Kelsey van Haaster is an Assistant Lecturer and PhD student in the School of Computer Science and Software Engineering at Monash University, Australia. She has four years of experience in teaching introductory computer programming, and her major research interests are related to this. She is a member of Monash University's Computing Education Research Group. She is currently teaching first year programming using Java as the implementation language and BlueJ as the de-velopment environment, in the second unit in the sequence of first year programming units men-tioned in this paper.
Dianne Hagan is a Senior Lecturer in the School of Computer Science and Software Engineering at Monash University, Australia. She has almost twenty years of experience in teaching introduc-tory computer programming, and her major research interest is related to this. She is a member of Monash University's Computing Education Research Group, and is the director of the Bachelor of Computing undergraduate degree program. She is also currently teaching first year programming using Java as the implementation language and BlueJ as the development environment, in the first unit in the sequence of first year programming units mentioned in this paper.