Effective Classification Using Artificial Bee
Colony Based Feature Selector
S.H. Hassan, N. Yusup and D.N.F. Awang Iskandar
Faculty of Computer Science and Information Technology, Universiti Malaysia Sarawak, 94300, Kota Samarahan Sarawak.Abstract—Pepper classification is an important step in
measuring the quality of the pepper. As of today, Malaysia Pepper Board (MPB) performed its classification task by doing a semi-automated process; where a commercial colour sorter is used to differentiate and categorized the peppers into respective groups. However, it is proven to be a challenging and time consuming process This paper introduces an effective pepper classification by applying a feature selection method in Artificial Bee Colony (ABC) algorithm. ABC algorithm is a metaheuristic algorithm inspired by the collective behavior of bees, which has been used successfully to solve complex problems of optimization. From this study, the proposed ABC algorithm that incorporates feature selection method resulted an accuracy of 92% tested with a small sample size. Meanwhile, 89.7% of accuracy was obtained with a larger sample size and a set of Red Mean; Green Median; Red Standard Deviation; Solidity Ratio; and Contrast were chosen as the best optimal features' subset.
Index Terms—Artificial Bee Colony; Image Processing;
Classification Technique; Feature Selection.
I. INTRODUCTION
Pepper, scientifically known as Piper Nigrum, is one of the most sought-after spices of the ancient along with other spices such as cardamom, cinnamon, cloves, nutmeg, etc. Pepper is now grown in various regions, including India, Indonesia, Brazil, and Malaysia, specifically Sarawak. Pepper has been an important agriculture commodity especially for the state of Sarawak. According to Wong, [1] Sarawak remains Malaysia’s key pepper producing state, contributing more than 95% of the country’s output. Wong also quoted that Malaysian Pepper Board figures proven that 18,000 and 20,000 pepper farm families in Sarawak, with 68,000 to 70,000 people involved in pepper cultivation.
To ensure and emphasize on product quality, main thoughtfulness has been accentuate starting from the harvesting phase to export point phase. There are many initiatives and on-going programs that aimed to improve issues in related to pepper production, productivity, quality improvement and value addition. Challenges as mentioned by Yusup et. al [2] are among the issues that needed to be improves. This includes improving the human manual grading process; which in summary is time consuming, error prone, and subjective human perceptions. All these three challenges provide significant inconsistency in the performance of grading the pipper nigrum. As such, the main objective of this paper is to use the proposed study to overcome these challenges by improving grading time and accuracy in grading decision. Clustering analysis has been widely used in many fields such as engineering, computer
science as well as astronomy [3]. Hence, this paper will also discuss aclustering analysis approach that will adapt feature selection method within Artificial Bee Colony algorithm. By doing this, the algorithm is expected to determine the best feature subset that able to effectively increase the classification accuracy of Piper Nigrum.
In image analysis, total number of features gained is relatively high and it is impossible to employ a big number of features in classification tasks. This is because the features gained may be redundant and the information may not be useful in classification process. Using pointless information would result in respectively high dimensionality which loads unnecessary processing. Too many irrelevant variables may lead to impractically, and will obscure patterns [4]. The obscure pattern is a total opposite result that can be expected from a classification task. Hence, to improve the effectiveness of a classification tasks, it is at best to employ a feature selection approach in a good search mechanism algorithm.
Feature selection approach can be categorized into three types, namely filter method, wrapper method and embedded method. Filter methods look at the features not in context of model being built, but finding a fixed thresholds or criteria for inclusion. Filters method described as a separate entity and working independently of the learning algorithm in a process of classification. Even though this method is a faster learning pipeline, the feature subset chosen may not be as fit as it is expected due to the easy criterion used in its algorithm [5]. Wrapper Methods is where the subset selection takes place based on the learning algorithm used to train the subset [6]. On the other hand, embedded method is a combination of filter and wrapper methods; on the base of having to be implemented in algorithm that has its own built-in feature selection method. According to Subanya and Rajalaxmi [7], this method can be less computationally intensive compared to wrapper. However, the complexity to build a mathematical model for its classifier making it as a major drawback for this method.
II. MATERIALS
Subajaya and Rajalaxmi came out with a research on feature selection using ABC algorithm [7]. In the research, the usage of optimal feature subset in metaheuristic algorithm was discussed, for the purpose of improving classification accuracy in cardiovascular disease diagnosis. Swarm intelligence based Artificial Bee Colony (ABC) algorithm was used to find the best features and Support Vector Machine (SVM) classification is used to evaluate the result.
Their experiment proved that ABC-SVM performs better than Feature selection with reverse ranking good classification accuracy was obtained with only seven features.
An Ant Colony Optimization (ACO) novel approach for subspace clustering was introduced in Tomas and Ebroul research [8]. The approach, which was based on and its learning mechanism showed that the algorithm introduced was able to prove the assumption that all of clusters in a dataset are not found in same set of dimensions; by assigning weights to features according to local correlations of data along each dimension. The result of the research proved that the proposed ACO novel approach performed the best and concluded to be more stable among other algorithm tested. The result also proved that feature selection is necessary for clustering.
Another study which also uses ACO algorithm was done by Abd-Alsabour and Randal. The research proposed a system that combines ACO algorithm and SVM in order to learn the accuracy of a classifier and the time needed for learning [9]. The end result of the study showed that the accuracy of proposed algorithm outdone other approaches. The algorithm solved feature selection problems in terms of accuracy of the classifier.
A study on unsupervised feature selection using Binary Bat Algorithm also has been conducted to learn the accuracy performance [10]. This study compared the accuracy and number of selected features using several classification algorithm, namely Decision Tree, NavieBayes, k-nearest Neighbour, and other optimization algorithm such as Genetic Algorithm, Particle Swarm Optimization and ACO. The experiment showerd improved accuracy with reduced features in comparison with other methods.
Meanwhile, in a study related to feature selection based on moth-flame optimization (MFO) proved that it is more effective in comparison to other algorithms evaluated, namely PSO and Genetic Algorithm (GA). In this study, MFO, which applied in a wrapper based manner, proven to be a good searching algorithm in finding the optimal feature subset and maximizing classification performance [11].
In other study, Pal’s team [12] stated that Support vector machines (SVM) are attractive for the classification of remotely sensed data with some claims that the method is insensitive to the dimensionality of the data and, therefore, does not require a dimensionality-reduction analysis in preprocessing. In their study, classification analysis has been conducted by having two hyperspectral sensor data sets to reveal that the accuracy of a classification by an SVM does vary as a function of the number of features used. Although at some point of the study, the accuracy showed a weighty of drop (at 0.05 level of statistical significance) with the addition of features with a small training sample being used. This shows that there is a dependency between the accuracy of classification by an SVM on the dimensionality of the data and the possibility of performing feature-selection analysis prior to classification.
In a related study using Shuffled Frog Leap Algorithm
III. METHOD
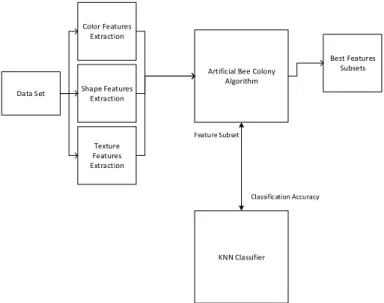
In this study, a general framework has been presented which contained layered structure indicating phases to be constructed and how they would interrelate. Details of the framework can be seen in Figure 1. In general, three major phases involved in this image classification process are image processing phase, feature selection processing phase, and post processing phase, which involves performance assessment or evaluation. Data Set Color Features Extraction Shape Features Extraction Texture Features Extraction
Artificial Bee Colony Algorithm KNN Classifier Feature Subset Classification Accuracy Best Features Subsets
Figure 1: Overall Framework of Piper Nigrum Classification In image processing phase, data sets given is utilized in order to escalate the right information to the classification phase. Various images of Piper Nigrum from the training samples are reduced and standardized to 4272x2848 pixel. The images were then processed by using feature extraction techniques, specifically for colour, shape and texture features. Properties of mean, median and standard deviation from Red, Blue and Green group being calculated and extracted. As for the shape feature, circularity and solidity of the pepper berries being calculated and extraction and Gray Level Co-occurrence Matrix (GLCM) is used as texture extraction method. This process involves converting the training samples to 256 gray level images. Once converted, GLCM will be calculated by identifying pixel’s size and the perimeters of Angular Second Moment; Contrast; Correlation and Inverse Difference; Moment; and Entropy. Once these values are obtained, it will then be normalized and used for ABC algorithm.
ABC algorithm will then kick-start the classification process after receiving extracted features from previous phase. In this study, wrapper method is being adopted in this ABC algorithm to perform feature selection process. ABC algorithm purpose is to optimize the process of selecting the best feature and produces the best feature subsets which increase the accurateness of the classifier. In other words, ABC algorithm is being used as a feature selector and
ABC algorithm only employs fewer control parameters. There are three control parameters in its optimization process, namely colony size, the value of limit and maximum number of cycle [14]. These three control parameters play major roles in ABC algorithm. The number of colony size is based on the number of food sources or the population size of the colony (the number of employed bees or onlooker bees). The value of limit is counted once the position of the food sources fail to recover after a certain cycle and the food sources are abandon. In maximum number of searching cycle, this process will be repeated until the termination criteria are satisfied [15].
In ABC algorithm, the bee colony consists of three groups namely Employed Bees, Onlookers and Scout. In this proposed study, employee bee will determine the neighbors of chosen food source, which in this case is the first feature subset to be evaluated. Then, on the second half of the searching process, onlookers will collect information of the solution and start distributing it. If it is successfully distributed, scout bee will then identify any abandon food source and stop searching once the criteria has been met. If the distribution process is not successful, employee bee will repeat the neighborhood exploration again until the searching criteria has been met.
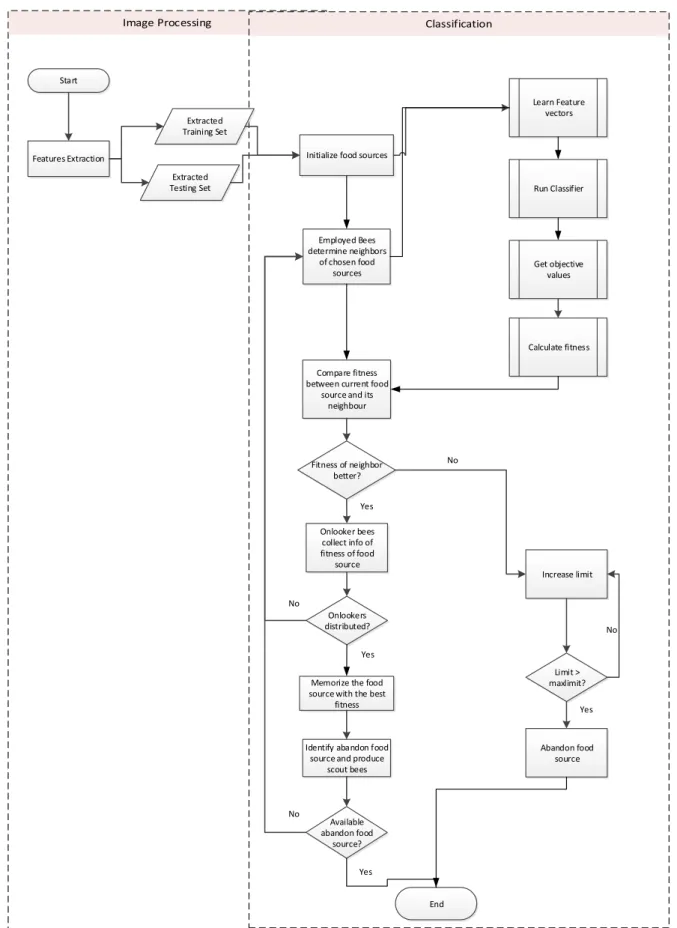
The following flowchart in Figure 2 illustrates the flowchart of feature selection method application in ABC algorithm. The details of the steps in ABC algorithm is presented below.
1. Create and initialize population of search space solution x_ij [16]. In this phase, x_i is determine randomly by: 𝑥𝑖= 𝑥 𝑗 𝑚𝑖𝑛 + 𝑟𝑎𝑛(0,1) (𝑥 𝑗 𝑚𝑎𝑥− 𝑥 𝑗 𝑚𝑖𝑛 ) (1) 2. Find objective value of each individual feature. 3. Calculate fitness for each individual feature.
4. In employed bee phase, its neighborhood is explored to produce a mutant solution of the previous solution. The neighborhood exploration is determined by having:
𝑣𝑖𝑗= 𝑥𝑖𝑗 + Φ𝑖𝑗 (𝑥𝑖𝑗− 𝑥𝑘𝑗) (2)
5. A greedy selection is applied between previous solution and its mutation. The mutant solution will be adopted if it is better than previous solution. Else, the limit will be increase.
6. For the value that has been selected as the most fit solution, the onlooker bee (from Onlooker Bee phase) will gather the necessary information and then memorize it as the best food source.
7. Scout bee will perform a new search and will return to step 4 in order to find and explore a new food sources. For every new food sources generated, fitness value will be gained and to be compared to the memorized food source that was done by onlooker bee. This step will be repeated until the stopping criteria is met. 8. A classifier is then used to evaluate the effectiveness
of the feature subset produced.
Result and Discussion
The experiment was conducted using MATLAB, and the computer specification were 3.10GHz processor, 8GB RAM, Windows 7 operating system The data set used for this experiment are digital images of the pepper berries captured in a control environment (lighting and camera distance). These images are divided into 534 images of testing data and 500 training data. The features of colour, shape and texture are being extracted to analyze the properties of each feature and to determine which of these properties are able to contribute in classifying the Piper Nigrum into its own respective group. There are five groups namely Group 1 (Standard Malaysian White Pepper), Group 2 (Sarawak Special White), Group 3 (Sarawak FAQ White), Group 4 (Sarawak Field White) and Grade 5 (Sarawak Coarse Field White).
The feature properties that represent the Piper Nigrum dataset are described in Table 1. For colour feature, there are three feature properties which consist of Red, Green, Blue (RGB) Mean, RGB Median and RGB standard deviation. For shape feature, the feature properties were circularity and solidarity ratio and for texture, the feature properties were contrast, correlation, moment and entropy.
Table 1
Feature Properties for Colour, Shape and Texture No. Property Feature
1. Red Mean Colour 2. Green mean 3. Blue Mean 4. Red Median 5. Green Median 6. Blue Median
7. Red Standard Deviation 8. Green Standard Deviation 9. Blue Standard Deviation 10. Circularity Ratio
Shape 11. Solidity Ratio
12. Angular Second Moment
Texture
13. Contrast
14. Correlation
15. Moment
16 Entropy
To test the optimal feature subset that produce by ABC algorithm, a cluster analysis has been performed. During cluster analysis, the distances and pairing similarities between data is studied without having to identify the actual group or class.
To achieve a good classification accuracy rate, we validated the best optimal feature subset produced by ABC algorithm. The K-Nearest Neighbor algorithm has been chosen for the purpose of evaluating the accuracy of a feature subset. K-Nearest Neighbor is commonly used in classification task.
Start Features Extraction Extracted Training Set Extracted Testing Set
Initialize food sources
Employed Bees determine neighbors of chosen food sources Learn Feature vectors Calculate fitness Get objective values Compare fitness between current food
source and its neighbour Fitness of neighbor better? Increase limit No Limit > maxlimit? Abandon food source Yes No Onlooker bees collect info of fitness of food source Onlookers distributed? No
Memorize the food source with the best
fitness
Identify abandon food source and produce
scout bees Available abandon food source? End Yes Yes No Yes Run Classifier
According to Table 2, test sample for Group 1 produced the highest accuracy among all groups, which is 92%. With test sample in Group 1, it was concluded that the best feature was Green Standard Deviation. However, the testing was done using the lowest number of test sample. A study by Foody [17] stated that the sample size selected and use in a study should be large enough to provide a sufficient chance of finding a statistically significant difference. This showed that sample size plays major role in determining classification accuracy.
To prove this, all test samples is combined into one group
in order to have a larger sample. During this test, parameter of maximum cycle periodically changed in order to see a variance of results. Results of this test can be seen in Table 3 below. By using 534 test samples and maximum cycle of 50, highest accuracy achieved was 89.7%. Even though the accuracy is lower relatively than the first test with a smaller size of samples, an optimal feature subset with variety of feature elements was able to be obtained from the results. It is also proven that feature colour with an element of red standard deviation to be the most significant in the test sets for each of test cycles.
Table 2
Classified Images According to Group
Group Test Samples Best Feature (Refer to Table 1) Accuracy (%) Correctly Classified
1 100 8 92.0 92/100 2 114 7 73.68 84/114 3 110 8 70.0 77/110 4 104 7 91.34 95/104 5 106 11 88.67 94/106 Table 3
Classified Images with Combined Test Samples
Test Samples Max Cycle Best Feature (Refer to Table 1) Accuracy (%) Correctly Classified
534 5 7 76.96 411/534 534 10 1,4,7,9,10,11,12,13, 15 67.04 358/534 534 50 7,10,11,16 82.58 441/534 534 100 1,2,7,11,13,15 69.28 370/534 534 500 1,6,7,10,11,12,14 72.09 385/534 534 1000 1,2,7,11,12,13 69.28 370/534 534 1500 1,5,7,11,13 66.10 353/534 534 2000 2,7,11,13,15 77.34 413/534 534 2500 2,5,7,11,14 70.41 376/534 534 3000 1,5,7,11,13 89.70 479/534
To ensure the efficiency of the ABC algorithm approach, another test has been done using four feature selection approaches. This test has been done using Weka. In this test, feature selection process is divided into two parts; namely attribute evaluator and search method. An attribute evaluator is a process whereby each features in dataset is evaluated in the basis of its own class (output of the value). Search method process is a procedure where it will try to examine all attributes and shortlisted them, find the best and/or variety of combinations of attributes in dataset.
Four approaches have been used in order to identify the best feature and/or feature subset. The first approach used in this test is Correlation Based Feature Selection (CFS). CFS uses a heuristic function based upon correlation to find the significance of the features examined, by quickly identifying any repetitiveness, as well as pertinent and irrelevant features. In this test, CFS function called CfsSubsetEval in Weka is used to calculate the value of the features. This evaluator will be paired with BestFirst (Forward Search) search method to calculate the worth of a subset of attributes. This approach works by considering the individual predictive ability of each feature along with the degree of redundancy between them. The chosen subset will be the one that is highly correlated with the class while having low inter-correlation.
Second approach used for this testing is Principal Components Analysis (PCA). PCA is an unsupervised dimensionality reduction technique, that works by finding a linear transformation that convert a dataset to a lower dimension. PCA will converting attributes into binary ones, chose from the variation and combine correlated attributes resulted in a transformed feature set, which is superior to its
original. The best feature subset can be obtained by interpreting the relative importance of a given attribute, which was initially normalized, by looking at the magnitude of its effectiveness. In other words, only the important attributes to be evaluated. This evaluator is best paired with Ranker method, where features will be determined and ranked according to its worth.
Ranker method also best-paired with a function called ReliefFAttributeEval. This approach to feature selection estimates the value of an attribute by repeatedly sampling an instance and evaluates how well their values distinguish between similar instances. An attribute is given a high score when its values separate similar observations with different class and do not separate similar instances with the same class values.
The final approach to feature selection tested in Weka is a Learner Based Feature Selection. This approach works by evaluating the performance of a learning algorithm on the dataset with variety of attributes selection combination. For the purpose of this testing, Decision Tree method has been selected as the algorithm to train the datasets. The attribute evaluator used for this is a function called WrapperSubsetEval. This function works together with a search method called GreedyStepWise.
The result from these approaches will be evaluated against the classifier used previously in testing the ABC algorithm accuracy. This evaluation process being done by having 534 testing data sets classification accuracy being tested against the best feature subset acquired from Weka’s feature selection approaches. From the table 4, an unsupervised feature evaluator, WrapperSubset with a search method
namely GreedyStepwise provides the highest accuracy, which is 75.09%. From this result, it is proven that ABC algorithm provide better accuracy compared to search method
performed in Weka; which gives 89.7% in ABC algorithm compared to 75.09% of accuracy using Weka.
Table 4
Classified Images with Feature Selection Approaches using Weka
Attribute Evaluator Search Method Best Feature Accuracy
(%)
Correctly Classified
CfsSubsetEval (Supervised) BestFirst (Forward Search) 1 23.4% 125/534
Principal Components (Unsupervised) Ranker 1,2,3,4 42.88% 229/554
ReliefFAttributeEval (Supervised) Ranker (Attribute Ranking) 16,15,6,5,4,3,2,7,8,9,13,14,12,10,11,1 66.85% 357/554 WrapperSubsetEval (Unsupervised) GreedyStepwise 2,3,6,7,9,11,13,14,15 75.09% 401/554
IV. CONCLUSION
ABC algorithm is best applied as a feature selection algorithm since it is known to be a good search mechanism algorithm. The ability to explore local solutions, flexibility and its robustness were able to provide the essential benefits for a good feature selection application. In this paper we have presented ABC algorithm with a feature selection wrapper method. The results of the experiments have been discussed as in section IV. Based on the experiments, the proposed approach using ABC algorithm was able to find the best features to be optimize defined by a good feature selector criterion.
In conclusion, ABC algorithm with a feature selection wrapper method was able to provide highest accuracy of 92% using a smaller sample size with one best feature selected, whereas 89.7% of accuracy was obtained with a larger sample size where a set of Red Standard Deviation, Circularity Ratio, Solidity Ratio, and entropy was selected as the best optimal features. This best optimal feature subset obtained also a mixture of colour, shape and texture feature. This feature subset is much more optimal considering that it provides more information for the algorithm to process rather than just one feature. In addition to that, compared to feature selection approaches in Weka, ABC algorithm still provide better efficiency in classification. This is proven from the result of 75.09% accuracy when using feature selection technique in Weka compared to 89.7% of accuracy when applying feature selection technique within ABC algorithm.
As for our future work, we plan to include testing the feature selection method using other metaheuristic algorithm.
ACKNOWLEDGMENT
The authors would like to thank Universiti Malaysia Sarawak for the institutional support, the Malaysian Pepper Board for their assistance and the Higher Ministry of Education for the financial support through Research Acculturation Grant Scheme (RAGS) Artificial Bee Colony Optimization Algorithm for Piper Nigrum Classification -RAGS/SG/05(3)/928/2012(29).
REFERENCES
[1] J. Wong, Community, Jun. 2016. Retrieved from The Star Online:
pepper-farming-prices-soar-as-more-people-use-the-spice-in-food-processing-and-manufacturi/
[2] N. Yusup, D. Awang Iskandar, and S. Hassan, “Classifying Piper Nigrum using Artificial Bee Colony Algorithm,” 2014 4th International Conference on Artificial Intelligence with Applications in
Engineering and Technology, 2014
[3] A. Jain, “Data Clustering: 50 Years Beyond K-Means,” Pattern
Recognition Letters, pp. 651-666, 2010.
[4] U. Stańczyk and L. C. Jain, Feature Selection for Data and Pattern
Recognition, Springer Berlin Heidelberg, 2015.
[5] A.-C. Liew, H. Yan, and M. Yang, “Pattern Recognition Techniques for the Emerging Field of Bioinformatics: A Review,” Pattern
Recognition, pp. 2055-2073, 2005.
[6] I. Jeffrey, D. G. Higgins, and A. C. Culhane, “Comparison and evaluation of methods for generating differentially expressed gene list from microarray data,” BMC Bioinformatics, pp. 1471-2105, 2006. [7] B. Subanya, and R. Rajalaxmi, “Feature Selection using Artificial Bee
Colony for Cardiovascular Disease Classification,” 2014 International
Conference on Electronics and Communication System (lCECS), pp.
1-6, 2014. IEEE.
[8] T. Piatrik and E. Izquierdo, “Subspace clustering of images using Ant colony Optimisation,” 2009 16th IEEE International Conference on
Image Processing (ICIP), Cairo, pp. 229-232, 2009.
[9] N. Abd-Alsabour and M. Randall, “Feature Selection for Classification Using an Ant Colony System,” 2010 Sixth IEEE International
Conference on e-Science Workshops, Brisbane, pp. 86-91, 2010.
[10] A. Rani and R. Rajalaxmi, “Unsupervised feature selection using binary bat algorithm,” 2015 2nd International Conference on
Electronics and Communication Systems (ICECS), Coimbatore, pp.
451-456, 2015.
[11] H. Zawbaa, E. Emary, and B. Parv, “Feature selection approach based on moth-flame optimization algorithm,” 2016 IEEE Congress on
Evolutionary Computation (CEC), Vancouver, pp. 4612-4617, 2016.
[12] M. Pal and G. M. Foody, “Feature Selection for Classification of Hyperspectral Data by SVM,” IEEE Transactions on Geoscience and
Remote Sensing, pp. 2297 - 2307, 2010. IEEE.
[13] B. Hu, Y. Dai, and Y. Su, “Feature Selection for Optimized High-dimensional Biomedical Data using the Improved Shuffled Frog Leaping Algorithm,” IEEE/ACM Transactions on Computational
Biology and Bioinformatics, 2016.
[14] D. Wu, W. Yu, and Z. Yin, “Parameter estimation of rational models based on artificial bee colony algorithm,” Proc. of the International
Conference on Modelling, Identification and Control (ICMIC), pp.
219-224, 2011.
[15] D. Karaboga, “Artificial bee colony algorithm,” Scholarpedia, p. 6915, 2010.
[16] D. Karaboga and B. Basturk, “A powerful and efficient algorithm fornumerical function optimization: artificial bee colony (abc) algorithm,” Journal of Global Optimization, pp. 459-471, 2007. [17] G. M. Foody, Sample Size Determination for Image Classification
Accuracy. International Journal of Remote Sensing, Taylor & Francis, pp. 5273 – 5291, 2009.
[18] M. Karunyalakshmi and N. Tajunisha, “Classification of Cancer Datasets using Artificial Bee Colony and Deep Feed Forward Neural Networks,” International Journal of Advanced Research in Computer