CCE Theses and Dissertations College of Computing and Engineering
2019
Reduction of False Positives in Intrusion Detection Based on
Reduction of False Positives in Intrusion Detection Based on
Extreme Learning Machine with Situation Awareness
Extreme Learning Machine with Situation Awareness
Donald A. Burgio
Nova Southeastern University, dburgio@yahoo.com
Follow this and additional works at: https://nsuworks.nova.edu/gscis_etd
Part of the Computer Sciences Commons
Share Feedback About This Item
NSUWorks CitationNSUWorks Citation
Donald A. Burgio. 2019. Reduction of False Positives in Intrusion Detection Based on Extreme Learning Machine with Situation Awareness. Doctoral dissertation. Nova Southeastern University. Retrieved from NSUWorks, College of Engineering and Computing. (1093)
https://nsuworks.nova.edu/gscis_etd/1093.
This Dissertation is brought to you by the College of Computing and Engineering at NSUWorks. It has been accepted for inclusion in CCE Theses and Dissertations by an authorized administrator of NSUWorks. For more information, please contact nsuworks@nova.edu.
Reduction of False Positives in Intrusion Detection Based on Extreme
Learning Machine with Situation Awareness
by
Donald A. Burgio
A dissertation submitted in partial fulfillment of the requirements for the degree of Doctor of Philosophy
in
Information Assurance
College of Engineering and Computing Nova Southeastern University
An Abstract of a Dissertation Submitted to Nova Southeastern University in Partial Fulfillment of the Requirements for the Degree of Doctor of Philosophy
Reduction of False Positives in Intrusion Detection Based on Extreme
Learning Machine with Situation Awareness
by
Donald A. Burgio 2019
Protecting computer networks from intrusions is more important than ever for our privacy, economy, and national security. Seemingly a month does not pass without news of a major data breach involving sensitive personal identity, financial, medical, trade secret, or national security data. Democratic processes can now be potentially compromised through breaches of electronic voting systems. As ever more devices, including medical machines, automobiles, and control systems for critical infrastructure are increasingly networked, human life is also more at risk from cyber-attacks. Research into Intrusion Detection Systems (IDSs) began several decades ago and IDSs are still a mainstay of computer and network protection and continue to evolve. However, detecting previously unseen, or zero-day, threats is still an elusive goal. Many commercial IDS deployments still use misuse detection based on known threat signatures. Systems utilizing anomaly detection have shown great promise to detect previously unseen threats in academic research. But their success has been limited in large part due to the excessive number of false positives that they produce.
This research demonstrates that false positives can be better minimized, while maintaining detection accuracy, by combining Extreme Learning Machine (ELM) and Hidden Markov Models (HMM) as classifiers within the context of a situation awareness framework. This research was performed using the University of New South Wales - Network Based 2015 (UNSW-NB15) data set which is more representative of contemporary cyber-attack and normal network traffic than older data sets typically used in IDS research. It is shown that this approach provides better results than either HMM or ELM alone and with a lower False Positive Rate (FPR) than other comparable approaches that also used the UNSW-NB15 data set.
Acknowledgements
First, my appreciation and thanks go out to my dissertation committee of Drs. Cannady, Cerkez, and Li for agreeing to support my research and for giving their time, talents, and feedback. And thanks especially to Dr. Cannady for his willingness to be my advisor, along with his encouragement, concise guidance, and patience. Dr. Cannady’s
description of his research efforts as the “intersection between artificial intelligence and information security” had resonated with me while exploring program options prior to embarking on this journey as it still does today.
I’d also like to thank my family, friends, and colleagues, especially Mark, that provided their support, understanding, and encouragement along the way. Finally, this work would not have been possible without drawing upon the prior research of the many that are cited within this dissertation report.
Table of Contents
Approval ii Abstract iii
Acknowledgements iv List of Tables vii List of Figures viii List of Equations ix Chapters 1. Introduction 1 Background 1 Problem Statement 3 Goals 4
Relevance and Significance 5
Barriers and Issues 9
Assumption, Limitations, and Delimitations 10
Definition of Terms 11
List of Acronyms Used 13 Summary 15
2. Literature Review 17 Overview 17
Types of IDS 17
IDS Performance Measurements 19
Data Sets for Training and Testing 21
IDS and Machine Learning Techniques 25 Biologically Inspired Models 26
Clustering 26
Similarity and Distance Measures 27
Decision Trees 27 Boosting 28 Mixture Models 29 Bayesian Approaches 30 Generic Algorithm 30 Neural Networks 31 Self-Organizing Map 32 Kernel Machines 32 ELM 33
Deep Learning Approaches 36
Markov Models 38 Hybrid Methods 41 Voting Schemes 43
False Alarm Reduction Techniques 44
Situation Awareness 47
C2: Botnets 51
Data Preprocessing and Feature Selection 52
Summary 54
3. Methodology 56 Overview 56
The Data Set 59 Feature Selection 62 ELM Classifier 64
HMM Architecture 66
The Combined Classifier 68
Experiments 68
Evaluation Criteria 70
Computing Resources Used 70
Summary 71
4. Results 72
Experiment A (Time-Ordered Data) 72
Experiment B (Non-Time Ordered Data) 81
Training and Test Time Comparison 87
Comparisons to Other Literature 87
Summary of Results 89
5. Conclusions, Implications, Recommendations, & Summary 90
Conclusions 90
Summary 95
Implications 98
Recommendations 99
Appendices 101
A: UNSW-NB15 Features Description for Experiment A (Full 2.54M) 101
B: Information Gain Analysis of UNSW-NB15 Features for Experiment A 103
C: HMM Parameters for Experiment A 104
D: UNSW-NB15 Features Description for Experiment B (Train and Test) 106
E: Information Gain Analysis for Experiment B 108
F: HMM Parameters for Experiment B 109
Reference List 112
List of Tables
Tables
1. UNSW-NB15 Based Data Sets 62
2. Distribution of Training and Test Data by Traffic Type (440K Data Set) 73
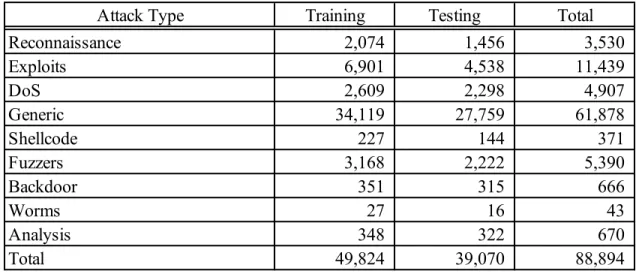
3. Distribution of Training and Test Data by Attack Type (440K Data Set) 74
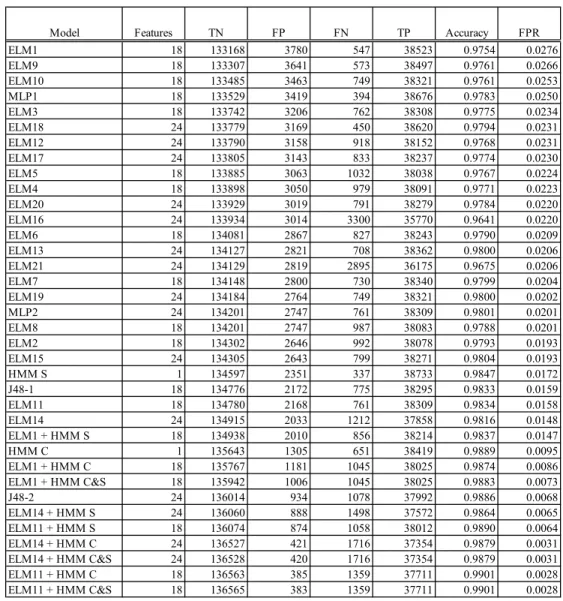
4. Experiment A Results Sorted by Highest to Lowest FPR 80
5. Summary of Results Compared to Goals for Experiment A 81
6. Distribution of DoS Data by Traffic Type (DoS Data Set) 81
7. Experiment B Results Sorted by Highest to Lowest FPR 86
8. Summary of Results Compared to Goals for Experiment B 86
9. Training & Testing CPU Time Comparison by Classifier 87
10. Comparisons to Other Research Using UNSW-NB15 Data Sorted by FPR 88
11. UNSW-NB15 Features Description 101
12. Experiment A: Information Gain Analysis of UNSW NB-15 Features 103
13. UNSW-NB15 Features Description for the Train and Test Data Set 106
14. Experiment B: Information Gain Analysis of UNSW NB-15 Features 108
List of Figures
Figures
1. IDS Model with Situation Awareness Level Boundaries 57 2. Feature Selection Process 64
3. HMM State Transition Representation 67
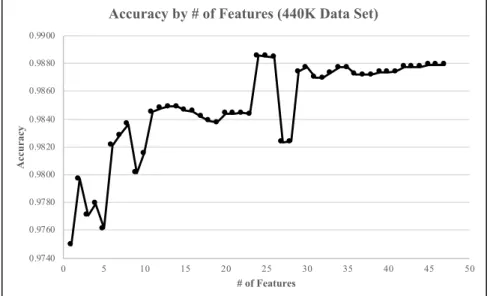
4. Accuracy by # of Features (440K Data Set) 75
5. FPR by # of Features (440K Data Set) 75
6. Accuracy by # of ELM Hidden Neurons (440K Data Set) 76
7. FPR by # of ELM Hidden Neurons (440K Data Set) 76
8. Accuracy by # of Features (DoS Data Set) 82
9. FPR by # of Features (DoS Data Set) 83
10. Accuracy by # of ELM Hidden Neurons (DoS Data Set) 83
11. FPR by # of ELM Hidden Neurons (DoS Data Set) 84
List of Equations
Equations
1. Accuracy 20
2. False Positive Rate (FPR) 20
3. False Negative Rate (FNR) 20
4. True Positive Rate (TPR) or Detection Rate (DR) 20
5. False Alarm Rate (FAR) 20
Chapter 1
Introduction
Background
Intrusion Detection Systems (IDSs) are a collection of hardware and software resources that can detect, analyze, and report indications of intrusions in computer systems and networks. Extending from IDS research, there are Intrusion Prevention Systems and Intrusion Response Systems focused on the prevention and response aspects of intrusions respectively (Inayat, Gani, Anuar, Khan, & Anwar, 2016). Some IDSs can be used in-line to both detect indications of and prevent intrusions in near real-time and are sometimes referred to as Intrusion Detection and Prevention Systems. In other cases, these systems can communicate with other security devices such as firewalls, which monitor and control network traffic into and out of a protected network, to automatically implement blocking rules in response to detection.
Research into IDSs began several decades ago with a key paper on computer threat monitoring and surveillance, based on mainframe audit logs, by Anderson (1980). The concept of intrusion detection analysis existed prior to Anderson’s report but
typically just consisted of system administrators manually scanning audit logs for anomalies. Yost (2015) reported that Clyde began work in 1977 on a limited scope commercial IDS, named Control, but that effort was not considered as influential or comprehensive as Anderson’s analysis.
Initially, intrusion detection was focused on after-the-fact batch analysis of audit records until Denning and Neumann (1985) proposed requirements and a model for the real-time Intrusion Detection Expert System with the goal of being able to detect most intrusions while making it extremely difficult to avoid detection. In a follow-on seminal paper, Denning (1987) went on to further the research into this field.
IDSs are characterized as either focused on misuse detection, based on known attack patterns or signatures, or anomaly detection, based on deviations in behavior from normal. Misuse detection has been preferred in commercial environments due to a higher level of accuracy since it is grounded in known attacks. Academic research has favored anomaly detection based on its higher potential to recognize novel attacks (Tavallaee, Stakhanova, & Ghorbani, 2010; Mitchell & Chen, 2014).
Substantial research has been done in anomaly detection across many domains including intrusion detection. Azad and Jha (2013), in a survey covering 75 research papers, list over a dozen different data mining techniques that have been applied to intrusion detection.
Other recent research using a variation of neural networks known as Extreme Learning Machine (ELM), first introduced by Huang, Zhu, and Siew (2004), has been applied to intrusion detection with promising results for reducing false positives while providing good generalized performance with extremely fast learning speeds (Creech & Jiankun, 2014; Fossaceca, Mazzuchi, & Sarkani, 2015). Baum and Petrie (1966) originated Hidden Markov Models (HMMs), a type of Markov chain, which model sequences of potential events. HMMs have been applied to several domains including speech and handwriting recognition and more recently to modeling cyber-attacks.
Endsley (1988) first introduced the concept of situation awareness in the context of human factors research. She defined situation awareness as consisting of perception of elements in time and space, comprehension of their meaning, and their projection into the future. Hutchins, Cloppert, and Amin (2011) subsequently took a military-inspired approach to cyber situation awareness, using a “kill chain,” citing the need to better detect indications of multistage attacks including Advanced Persistent Threats (APTs).
Problem Statement
Existing anomaly detection techniques for IDSs have a high False Positive Rate (FPR) (Zuech, Khoshgoftaar, & Wald, 2015; Fernandes, Rodrigues, Carvalho, Al-Muhtadi, & Proença, 2019). Anomaly based methods, which show promise of detecting indications of novel cyber-attacks, still typically generate more false positives than signature-based methods which tend to have more false negatives (Pao, Lee, & Huang, 2015). While substantial research has been conducted on IDSs in general, detection uncertainty still exists (Inayat et al., 2016). Contributing to this uncertainty is the growth in network sizes and the increasing complexity and variability of attacks. This, in turn, has significantly complicated the ability of IDSs to produce accurate alerts (Spathoulas & Katsikas, 2013a).
Axelsson (2000) in his widely cited paper on the base rate fallacy called false alerts the biggest issue in IDS effectiveness. Based on Bayesian statistics, he argues that the false alarm rate should be measured in relation to how many intrusions one would expect to detect rather than the maximum number of possible false alarms. And that an
IDS, to be considered effective, would need to have a very high standard of 1/100,000 false alarms per event.
Horne (2015), stressing the continued relevance of Axelsson’s research, illustrates the base rate fallacy by noting that due to Bayes’ rule that if an IDS has a 99.9% accuracy rate on a network where 1 in 100,000 inputs, the base rate, comes from a malicious source, that means that for every 1 true positive alert, the system will generate 99 false alerts (its positive predictive value).
Perdisci, Ariu, Fogla, Giacinto, and Lee (2009) conclude that the FPRs for IDSs must be very low. Sommer and Paxson (2010), examining the imbalance between
research into IDSs based on anomaly detection and their operational deployments, concur that reducing false positives in anomaly detection for IDS must be a top priority given that IDS error rates have a very high operational cost, as compared to other domains, which impedes the adoption of anomaly detection.
Goals
The primary goal of this research was to develop a new approach for an anomaly-based IDS that can better minimize false positives with the ability to detect indications of contemporary cyber-attacks while not sacrificing accuracy. This goal has been
demonstrated using a recent and relevant set of comprehensive benchmark data, a secondary goal, containing both cyber-attack and normal traffic.
However, while virtually all agree that FPRs for IDSs must be low, there is not a widely used benchmark rate for FPR cited in recent IDS research. Additionally, some researchers use terms such as false alerts and false alarms interchangeably with false
positives but others have different definitions which can create confusion and invalid comparisons.
While Axelsson (2000) put forth a high standard for false alarms and
effectiveness, McHugh (2000), in his critique of the evaluation of IDS systems conducted by Lincoln Labs for the Defense Advanced Research Projects Agency (DARPA) in 1998 and 1999, cited that DARPA had a criterion of 0.1% for false alarm rate. However, many researchers since then tend to compare their results among different algorithms and with other studies using the same data sets versus setting an absolute target for FPR. Though, more recently, Swarnkar and Hubballi (2016) cited 0.6% as an acceptable FPR for their anomaly-based detection method for Hypertext Transport Protocol (HTTP) cyber-attacks using a data set of more than one million events.
The primary evaluation measurement for this research was to demonstrate that the proposed two-stage approach produced a reduction of false positives by at least 10% compared to just using the first stage. A secondary measurement was to demonstrate an overall FPR of 0.6% or less. Both evaluation goals were achieved. In addition to
showing improved performance using two stages, the results were also compared to other algorithms using the same training and testing data sets and to published research.
Relevance and Significance
Despite substantial academic and commercial research and increased spending on computer and network security, major computer data breaches involving sensitive
personal identity, financial, medical, trade secrets, or national security data continue to occur. According to Ponemon and Trunkey (2016), the average cost of a data breach had
increased by 29% over the prior two years to $4 Million. Verizon (2016) reported that out of 2,260 confirmed breaches analyzed from 2015 that attackers take minutes or less to compromise a system but 80% of the victims did not realize they had been breached for weeks or longer.
Furthermore, Cyber-Physical Systems, which fuse network and computer
components with physical components such as actuators and sensors, have become more commonplace. With the related emergence of the Internet-of-Things (IoT), large
numbers of previously un-networked devices, including mundane consumer devices such as voice-activated speakers, thermostats, televisions, and even refrigerators, are being placed on the Internet and can pose a threat. An example is where a refrigerator was used to send spam email with hypertext links that could install malware if the links were clicked (Starr, 2014).
Another IoT related incident occurred in 2016 when the Mirai botnet slowed or stopped major portions of the Internet in the eastern United States. It accomplished that by merely taking advantage of poor security controls in low-cost IoT devices, such as surveillance cameras and wireless routers, that were connected to the Internet via high-speed broadband connections. Mirai, a self-replicating worm, doubled in size every 76 minutes and at its peak controlled around 600,000 devices around the world. It was used to launch a then record setting Distributed Denial of Service (DDoS) attack using the bandwidth harnessed (Graff, 2017).
Other trends such as cloud computing, where computing resources are being increasingly distributed, virtualized, and outsourced, and similar large-scale disruptive networking technology shifts including Network Function Virtualization and Software
Defined Networks, create new cyber-attack surfaces and challenges (Modi, et al., 2013; Alsmadi & Xu, 2015). Cyber-Physical Systems include controls for critical systems such as smart electrical grids hosting nuclear and other power generation plants, oil and gas pipelines, unmanned aircraft and drones, self-driving automobiles, chemical and other industrial plants, and healthcare devices. While many confirmed data breaches often result in many millions of dollars in economic losses, such as those related to credit card and financial account fraud, Cyber-Physical Systems raise the stakes with potential large-scale catastrophic consequences to life. Thus, it is increasingly important to secure them from intrusions, both known and novel (Mitchell & Chen, 2014).
Given the increased stakes, the need for faster and more automated responses to indications of potential cyber-attacks is critical. Many commercial IDSs and related systems are capable of blocking traffic in real-time, by source Internet Protocol (IP) address for example, based on intrusion alerts. Such an automated response is
categorized as an active response vs. a passive one. However, an action based on a false positive with an automated response could deny resource access to legitimate users or tasks that could be unacceptable based on the circumstance. An example of such would be preventing access to an Electronic Medical Records system by an emergency room doctor. Or more apocalyptically, the scenario from the 1983 movie War Games, where a computer program attempts to automatically launch nuclear missiles, based on the mistaken conclusion that the country is under attack, after humans are taken out of the decision loop. Thus, many organizations prefer a passive response that requires
a data breach or other undesired consequences (Marchetti, Pierazzi, Colajanni, & Guido, 2016).
Many researchers agree that the key to detecting novel threats is through anomaly-based detection (Tavallaee et al., 2010; Mitchell & Chen, 2014). IDSs are a mainstay of any defense-in-depth security strategy (Zuech et al., 2015) but many
commercial security infrastructure deployments are still predominately based on known threat signatures (Bhatt, Manadhata, & Zomlot, 2014). Intrusions evolve continuously and signature-based detection alone will often fail when presented with indications of intrusions that are not part of a known signature base (Wu & Banzhaf, 2010).
However, despite a large body of research on anomaly-based IDSs and the great promise they have shown, operational deployments have been impeded since error rates have very high operational costs (Wang & Lee, 2001; Sommer & Paxson, 2010). And, validating false positives can also distract human operators from real attacks (Ho, Lai, Chen, Wang, & Tai, 2012).
To put the significance of false positive percentages in the context of a real-world operational network, S. Bhatt et al. (2014) estimated that Hewlett Packard’s corporate network, which then spanned 166 countries with more than 300,000 employees,
generated between 100 billion to 1 trillion security events daily of which approximately 3 billion were processed by the security infrastructure. The infrastructure included IDSs feeding into a Security Information and Event Management system along with audit logs from other network devices. Thus, even a small percentage of false positives can
translate into a large number of events to review. IBM estimated that organizations spend $1.3 million a year dealing with false positives, wasting 21,000 hours on average,
and proposed more research on advancing Artificial Intelligence as a solution (Barlow, 2017).
According to research from the Information System Security Certification Consortium (2018), a non-profit organization which specializes in training and
certifications for cybersecurity professionals, the shortage of cybersecurity professionals is close to three million people globally. They also cite that nearly 60% of roughly 1,500 security professionals surveyed say their companies are at a moderate or extreme risk of cybersecurity attacks due to this shortage. Cisco (2016) had previously estimated that there would be a shortage of 2 million cybersecurity professionals globally by 2019, particularly amongst those monitoring and responding to alerts from IDSs and related systems in Security Operations Centers. Such staffing shortages further justify the need for more accurate and automated approaches to intrusion detection and response. While no credible research purports to completely eliminate false positives in IDS anomaly detection techniques, improvements to further reduce the rate and need for human intervention are well-justified.
Barriers and Issues
An anticipated issue prior to conducting this research was to identify a publicly available and suitable data set that reflects real-world conditions with ample benchmarks for comparison. Newer data sets exist for various purposes, such as cyber competitions, but given their recent nature there will generally be a lack of ample published research in the academic literature for comparison. However, more than a dozen research papers have been published between 2017 and 2019 for the chosen University of New South
Wales Network Based 2015 (UNSW-NB15) data set (Moustafa & Slay, 2015) which provided some basis for comparisons as this research evolved.
Assumptions, Limitations, and Delimitations
An assumption for this research is that the UNSW-NB15 data set is correctly labeled and reflective of both contemporary attack and normal traffic. Given the goal of using a contemporary data set, there will have been less academic scrutiny given the amount of time since the release of that data set as compared to the more traditional, and dated, ones typically used for intrusion detection research.
Another anticipated limitation of using a newer data set was that false positives may be much higher than would have been achieved using the same exact approach as on one of the more traditional intrusion research data sets. Moustafa and Slay (2016)
illustrated this in repeating five experiments using Naïve Bayes (NB), Decision Tree (DT), Artificial Neural Network (ANN), Logistic Regression, and Expectation-Maximization clustering on both the Knowledge Discovery in Databases Cup 1999 (KDD99) (University of California, Irvine, 1999), a classic and widely used intrusion detection research data set, and the UNSW-NB15 data set. The False Alarm Rate (FAR) obtained on the UNSW-NB15 data set was higher than when using KDD99 in all five cases. In the ANN example, KDD99 yielded a FAR of 1.48% while that same
experiment using UNSW-NB15 produced a 21.13% FAR.
Separately, Khammassi and Krichen (2017) explored feature selection algorithms and applied the same proposed method to both KDD99 and UNSW-NB15. For KDD99, they used a subset of 18 features with a 0.105% FAR while the same algorithm for
UNSW-NB15, with a subset of 20 features, provided a FAR of 6.390%. They concluded that the difference in FAR was due to UNSW-NB15 being more complex than KDD99.
This limitation was mitigated by setting goals as a marked improvement
compared to other experiments using the same data set as opposed to using benchmarks from experiments performed with outdated data sets. As for delimitations, the scope of this research focused on network-based intrusion detection as opposed to host-based.
Definition of Terms
Definitions without citations are the local definitions of this research only.
Analysis: attack methods which breach Internet-based applications
such as via ports (e.g., port scans), emails (e.g., spam), or web scripts (Moustafa, Turnbull, & Choo, 2018)
Attack Traffic: network packets containing an attempt to compromise the
confidentiality, integrity, or availability of a computer network or host such as through the manipulation of network packets, protocols, or payloads
Backdoor: an attack technique to bypass normal authentication to
secure unauthorized resource access (Moustafa, Turnbull, & Choo, 2018)
Classifier: a model designed to predict which target class, or category,
Denial of Service (DoS): an attempt to make host or network resources, such as memory, processing, and bandwidth, unavailable to authorized users by overwhelming those resources (Moustafa, Turnbull, & Choo, 2018)
IDS: a collection of hardware and software resources that can
detect, analyze, and report indications of intrusions in computer systems and networks (Inayat et al., 2016)
ELM: a type of classifier derived from neural network models
which does not require its hidden layer to be tuned (Huang, Zhu, & Siew, 2004)
Exploit: a sequence of instructions that takes advantage of a
vulnerability causing unintentional behavior on a host or network (Moustafa, Turnbull, & Choo, 2018)
Fuzzer: a program designed to discover weak points in an
application, an operating system, or a network by feeding it with massive inputting of random data (Moustafa,
Turnbull, & Choo, 2018)
Generic: a technique that works against a block-cipher to cause a
collision without respect to the configuration of the block-cipher (Moustafa, Turnbull, & Choo, 2018)
HMM: a type of Markov Chain that can be used to model and
classify series of events (Baum & Petrie, 1966)
False Positive (FP): the incorrect classification of a data element as belonging to a given class, such as attack traffic for the purposes of this research, when it actually belongs to another class, such as normal traffic
Reconnaissance: attacks that are designed to gather information about a
network or hosts to evade security controls; also called probing (Moustafa, Turnbull, & Choo, 2018)
Shellcode: a small piece of code, often written in machine language,
that is used as a payload to exploit a software vulnerability (Moustafa, Turnbull, & Choo, 2018)
Situation awareness: perception of elements in time and space, comprehension
of their meaning, and their projection into the future (Endsley, 1988)
Worm: a malware program that replicates itself in order to spread
to other hosts via a network by exploiting a vulnerability (Moustafa, Turnbull, & Choo, 2018)
List of Acronyms
ANN: Artificial Neural Network
APT: Advanced Persistent Threat
C2: Command and Control
CFS: Correlation Feature Selection
DARPA: Defense Advanced Research Projects Agency
DDoS: Distributed Denial of Service
DoS: Denial of Service
DNS: Domain Name System
DT: Decision Tree
DR: Detection Rate
ELM: Extreme Learning Machine
FAR: False Alarm Rate
FN: False Negative
FNR: False-Negative Rate
FP: False Positive
FPR: False-Positive Rate
HIDS: Host-based Intrusion Detection System
HMM: Hidden Markov Model
HTTP: Hypertext Transport Protocol
IDS: Intrusion Detection System
IoT: Internet of Things
IP: Internet Protocol
KDD99: Knowledge Discovery in Databases Cup 1999
KNN: K-Nearest Neighbor
MATLAB: Matrix Laboratory
ML: Machine Learning
NB: Naïve Bayes
NIDS: Network-based Intrusion Detection System
OS: Operating System
PCA: Principal Component Analysis
SVM: Support Vector Machine
TCP: Transmission Control Protocol
TN: True Negative
TP: True Positive
TPR: True-Positive Rate
UNSW-NB15: University of New South Wales - Network Based 2015
Summary
This chapter provided an overview of the problem of high rates of false positives and how they are impeding the adoption of anomaly detection techniques that are needed to better detect indications of compromise for today’s continuously evolving cyber-attacks. Several examples are given of the changing cyber landscape to illustrate that the relevance and significance of this research reaches far beyond merely preventing
financial losses. Life and liberty are now more at risk than ever before. The primary goal of this research, which was achieved, was to create a new technique to minimize false positives using promising emerging research into ELM as a classifier, in
conjunction with HMM, in a situation awareness framework. The anticipated primary challenge, which was overcome, was finding a data set for training and testing that is indicative of both modern normal and attack traffic patterns, along with a basis for
comparison, versus using one of the more commonly used, and dated, IDS research data sets prevalent in the literature.
Chapter 2
Review of the Literature
Overview
To appreciate and comprehend the problem of reducing false positives in
intrusion detection, it is necessary to cover several relevant areas of the literature starting with IDSs. The history of IDSs, going back to Anderson (1980), and earlier, was briefly covered in the introduction. This section will focus on their evolution post-Denning (1987) along with the different types of IDSs that have been researched and deployed. The review will then focus on how IDSs are evaluated including by measuring FPs and other metrics. Popular data sets for training and testing that have been used for research in the literature and the associated data set challenges will also be covered. This will be followed by a review of the literature of the various techniques that have been used in machine learning with a focus on the reduction of FPs along with the importance of feature selection. The review will then cover situation awareness. Different types of cyber-attacks, often as illustrated by the UNSW-NB15 data set chosen for training and testing, will also be discussed throughout the section.
Types of IDS
Many of the most widely deployed IDSs, such as Snort (Roesch,1999) and Bro (Paxson, 1999), are signature-based. These are often also referred to as misuse-based,
rules-based, knowledge-based, ontology-based, or expert systems. With this type of IDS, events are compared to predefined rules or patterns that are generalized knowledge of attacks. Each event observed is matched against fields such as source and destination IP addresses, ports, transport headers, and payload. In the Snort example, each rule often has documentation about the potential for false positives and negatives and often the corrective action that should be taken. Snort users can contribute rules and there are over 20,000 that were developed between 1999 and 2014 (Bhuyan, Bhattacharyya, & Kalita, 2014). However, signature rule writing is highly dependent on the expertise of the writer. There is latency between the time a new vulnerability or type of cyber-attack is
discovered and the time a new rule is written and implemented which renders signature-based systems vulnerable to novel attacks.
According to Inayat et al. (2016), at least 25 other IDSs of note, in addition to Snort and Bro, had been proposed between 1996 and 2015. Five were characterized as signature-based, four as anomaly-based, eight as both anomaly and signature-based (hybrid), and the rest as other.
In addition to classifying IDSs as based on their detection approach by either signatures or anomalies, IDSs are further classified as either Host-based IDS (HIDS) or Network-based IDS (NIDS), respectively, depending on the whether they analyze system logs generated by a host Operating System (OS) or network traffic data based on
communications to and from hosts (Tavallaee et al., 2010; Zuech et al., 2015). Hosts are sometimes referred to as end-points. An end-point could be a personal computer, server, mobile phone, Internet connected automobile, printer, voice-activated speaker, or other networked device.
NIDS can be based on either packet inspection or flow detection (Luh, Marschalek, Kaiser, Janicke, & Schrittwieser, 2016). Packet detectors analyze
communication packet payloads. Deep Packet Inspection requires significant computing resources so packet detectors often only analyze a subset of the packet such as HTTP headers for the case of web traffic. Encryption, in some cases, can thwart the analysis of certain payload data beyond the packet headers needed for routing or switching. Some flow-based detection systems analyze communications patterns using attributes such as source and destination IP addresses, port numbers, state flags, and the number of packets and amount of data transmitted. Many routers and switches can export flow data using common formats such as NetFlow.
NIDS generally free up resources by not having processing on each host, may be able to detect issues that could be obfuscated by log tampering on a compromised host, and are more OS independent. But they are considered more difficult to configure to have full coverage within a network. HIDS, on the other hand, benefit by distributing resources across hosts and use OS-specific rules that might improve detection
performance (Mitchell & Chen, 2014). Often, HIDS and NIDS are both used on the same network being monitored to provide better defense-in-depth.
IDS Performance Measurements
IDS performance for a binary classifier is typically defined using measurements based on four variables, which make up a confusion matrix, comparing the classifier’s predicted output with known labeled actual values (Fawcett, 2006; Mitchell & Chen, 2014). A True Positive (TP) occurs when the predicted output is positive, an indication
of an attack for this research, and the actual instance is positive. A True Negative (TN) occurs when the predicted output is negative, normal traffic for this research, and the actual instance is negative. An FP occurs when the predicted output is positive, an attack for this research, but the actual instance is negative, or normal traffic. A False Negative (FN) occurs when the predicted output is negative, or normal for this research, but the actual instance is positive. Various measurements can be calculated from these four variables, including:
Accuracy = TP + TN
TP + FP + TN + FN (1)
False Positive Rate (FPR) = FP
FP + TN (2)
False Negative Rate (FNR) = FN
FN + TP (3)
True Positive Rate (TPR) or Detection Rate (DR) = TP
TP + FN (4)
False Alarm Rate (FAR) = FPR + FNR
2 (5)
For the purposes of this research, the Moustafa and Slay (2015) definition of False Alarm Rate (FAR) is used unless otherwise noted. Other researchers often use FAR as interchangeable with FPR. Thus, it is important to verify the formulas used in different
research papers, that may have the same or similar name or acronym, before comparing results.
There is often a trade-off between desirable characteristics such as TPR with undesirable ones such as FPR. A Receiver Operating Characteristic graph (Fawcett, 2006; Bhuyan et al., 2014) can be used to depict how well a given algorithm is performing. The TPR is graphed on the Y-axis and the FPR on the X-axis. Different IDS algorithms can be compared on the same graph to show their respective lift from average detection based on a known test data set. Other related measures, including Area Under the Receiver Operating Characteristic Curve, have been proposed as a measure of classifier robustness. Another proposed measure is the geographic mean, G-Mean, which is the square root of the positive class accuracy times the negative class accuracy (Zong, Huang, & Chen, 2013).
Data Sets for Training and Testing
A significant and recurring issue for research in anomaly detection for IDSs is the availability of data sets for training and testing that reflect current real-world conditions and continuously evolving intrusion threats (Brown, Cowperthwaite, Hijazi, & Somayaji, 2009; Shiravi, Shiravi, Tavallaee, & Ghorbani, 2012). Some of the earliest IDS datasets commonly used for research are those produced for IDS evaluations for DARPA by Lincoln Labs in 1998 (Lippmann et al., 2000) and 1999 (Lippmann, Haines, Fried, Korba, & Das, 2000). Many more recent studies in IDS use the KDD99 data set (University of California, Irvine, 1999) which was derived from data originally created for the DARPA evaluations (Tavallaee et al., 2010). Weller-Fahy, Borghetti, and
Sodemann (2015), argue that the KDD99 intrusion data set remains the only
comprehensive and fully labeled benchmark data set that is widely used by researchers. Hu, Gao, Wang, Wu, and Maybank (2014) also suggest that the KDD99 is still the most credible data set for benchmarking IDS results.
However, KDD99 has also been criticized by many, including Tavallaee, Bagheri, Lu, and Ghorbani (2009), as a poor evaluator of anomaly detection techniques. The earlier DARPA evaluations, upon which KDD99 was based, were also criticized by McHugh (2000) for several issues associated with their design and execution. A refined version of KDD99, Network Security Lab-KDD, or NSL-KDD, which removes some of the duplicate records from both the training and testing data sets, was created to address some of the original criticisms of KDD99. Other researchers point out that the
cybersecurity landscape has changed significantly since the creation of the KDD99 data and that many don’t consider experiments that use older data sets as relevant today (Sommer & Paxson, 2010).
To address this, Song et al. (2011) developed their own data set since they could not find what they considered a viable alternative to the KDD99 data set. They used data collected from a diverse network of honeypots over three years to create a new data set called Kyoto 2006+. It includes 93 million sessions with 50 million being normal and the rest being attack. And, it was based on 14 features derived from KDD99 plus 10
additional features such as anonymized IP source address.
Other research has used commercial data sets from large security service providers. For example, Sundaramurthy, Bhatt, and Eisenbarth (2012), whom were affiliated with Hewlett Packard, analyzed Intrusion Prevention System data from Hewlett
Packard’s Tipping Point platform which had included over 35 billion alerts collected over a five-year period from devices located in over 1,000 customer networks worldwide. However, Zuech et al. (2015) point out that organizations can be reluctant or legally constrained from sharing such data. The results published from the above data sets were aggregate statistics and presumably the authors would not be able to share the underlying data sets from their employer even if anonymized. A study by Coull, Wright, Monrose, Collins, and Reiter (2007) discusses how similar network trace data can be
de-anonymized which provides a further disincentive for sharing potentially sensitive data. Dainotti, Pescape, and Claffy (2012), while researching related Internet traffic classification problems, cite a lack of sharable network packet traces which they believe is partially due to privacy concerns. Spathoulas and Katsikas (2013b) concur that such a lack of data sets to test intrusion detection methods are a problem. They also believe that the problem is further compounded when researchers create new data sets for studies but do not make them available to others.
Yet, despite the criticism of KDD99 in particular, Azad and Jha (2013) analyzed 75 research papers in intrusion detection from 2000 through 2012 and found that 42% used the KDD99 data set. Hubballi and Suryanarayanan (2014) cite data sets as an issue in truly understanding the impact of false positive reduction research. Milenkoski, Vieira, Kounev, Avritzer, and Payne (2015) also list errors as an issue in publicly
available data traces along with their limited shelf-life due to new attacks. In addition to DARPA and KDD99, other data sets are available from the Cooperative Association for Internet Data Analysis, capture the flag and cyber defense competitions such as DefCon, the Internet Traffic Archive, the Lawrence Berkeley National Lab/International Computer
Science Institute, MAWILab, and the Internet Storm Center (Milenkoski et al., 2015; Zuech et al., 2015).
More recently, Moustafa and Slay (2015), also concluded that there was a lack of a suitable comprehensive data set for evaluation of NIDS research efforts since data sets such as KDD99 do not reflect modern network traffic. In response, they created a new data set called UNSW-NB15. It consists of a hybrid of modern real normal activities and synthesized attack behaviors. The attack traffic was created using the Ixia PerfectStorm tool in the Cyber Range Lab of the Australian Centre for Cyber Security.
They have made UNSW-NB15 freely available to researchers for academic purposes. It contains nine categories of attack traffic (fuzzers, analysis, backdoor, DoS, exploit, generic, reconnaissance, shellcode, & worm) and 49 features. The 49 features are further divided as: flow, basic, content, time, connection, additional generated, and labeled features. Two of the 49 features are labels: one for normal or attack traffic and a second one for the attack traffic type. A full list of these features in included in Appendix A.
Moustafa and Slay (2016) provided a separate justification of the complexity of the data set. Moustafa (2017) also gave details of how the derived features were
constructed. A ground truth table giving additional information on each attack including the category and corresponding Common Vulnerability and Exposures data
cross-reference identifier and description is also available.
Khammassi and Krichen (2017) state that the NIDS research community considers UNSW-NB15 a new benchmark data set to be used for evaluations of IDSs. They explored feature selection algorithms and applied the same proposed method to
both KDD99 and UNSW-NB15. They concluded that UNSW-NB15 is more complex than KDD99 and that further research was needed to improve classification for this new benchmark data set.
IDS and Machine Learning Techniques
IDS research that is based on anomaly detection often uses Machine Learning (ML) techniques. Russell and Norvig (2003) define ML as part of the field of Artificial Intelligence and as the ability to adapt to new circumstances to detect and extrapolate patterns. Two of the main approaches to ML are supervised and unsupervised learning. In supervised learning, labeled training data is used to infer a function to predict future values. In unsupervised learning, the data instances are not labeled. Unsupervised techniques have more potential applicability, given a lack of sufficiently labeled data, but assume that normal instances are more prevalent in the test data than abnormal instances. If that is not true, then those algorithms tend to have higher false positive rates (Bhuyan et al., 2014). In addition to supervised and unsupervised learning, there is
semi-supervised learning where labeled training instances are only available for the normal class. Two primary types of supervised and unsupervised learning are classification and clustering respectively. Numerous ML algorithms have been applied in IDS research including: ANN, Bayesian statistics such as NB, Gaussian Regression, Support Vector Machine (SVM), HMM, DTs, and K-Nearest Neighbor (KNN).
Each method has its strengths and weaknesses. For many of the IDS methods above, algorithms are needed at some stage to optimize – either minimize or maximize – an objective function (Rai & Tyagi, 2013).
Biologically Inspired Models
Biologically inspired models, in addition to ANN, include the Genetic Algorithm, Particle Swarm Optimization, Ant Colony Optimization, and Artificial Immune Systems (Tsai, Hsu, Lin, & Lin, 2009; Bhuyan et al., 2014). Benmessahel, Xie, Chellal, and Semong (2019) created an IDS based on Locust Swarm Optimization in conjunction with a Feed-forward Neural Network and achieved a lower FPR than the same approach using Particle Swarm Optimization & Genetic Algorithm. Igbe (2019) proposed an IDS using an ensemble of Artificial Immune System techniques including Negative Selection Algorithm and Dendritic Cell Algorithm that achieved an FPR of 1.34% with a 98.11% accuracy using a subset of UNSW-NB15 consisting of DoS & normal traffic.
Clustering
Clustering is an unsupervised method that seeks to categorize items, such as alerts, based on similarity (Weller-Fahy et al., 2015). An example of clustering is k-means clustering where the data (observations) are split into k categories, or clusters. Each cluster is identified by its center. The algorithm is highly dependent on the initial states and can converge quickly to a local versus global optimum, which can lead to erroneous results (Liu & Yu, 2005). To overcome the local optima problem, researchers have proposed several techniques such as biologically inspired methods including ANN, evolutionary algorithms, and swarm intelligence such as Ant Colony and Particle Swarm Optimization (Rai & Tyagi, 2013).
Similarity and Distance Measures
Weller-Fahy et al. (2015) cite the importance of similarity and distance measures in network intrusion anomaly detection. They specifically call out measures used during feature selection, classification, and clustering. They broadly define measures as power based, such as Euclidean, Manhattan, and Mahalanobis or distribution based, including Kullback-Leibler distance and entropy.
Entropy is a measure of randomness and has been applied to detecting activities such as port scanning, DoS, and worms. Bereziński, Jasiul, and Szpyrka (2015) used entropy as a method of detecting behaviors related to botnets such as Command and Control (C2). They found that Tsallis and Renyi entropy performed better than Shannon entropy as measured using FPR and accuracy.
Decision Trees
DTs are implemented using “if then else” rules. To classify a data sample, they start with a root node and end with a leaf node. The attributes used to create the tree are important. Sindhu, Geetha, and Kannan (2012) evaluated several types of DTs including Decision Stump, C4.5, NB Tree, Random Forest, Random Tree, and Representative Tree for use as a light-weight IDS. They identified that a suitable subset of features and removing redundant instances are important to avoid bias in the learning algorithm and are key factors for achieving better detection accuracy. Shah, Khiyal, and Awan (2015) categorize DTs as simple but very powerful.
Valero León (2017) used the test and training set referenced in Moustafa and Slay (2016) to create his models but used the full UNSW-NB15 data set for testing. He
provided confusion matrices for two models. One model was based on a DT and the other one, for contrast, used Snort (Roesch, 1999), a signature-based system that was loaded with the latest rules that were available at the time of the experiment. The DT-based model outperformed Snort by a significant margin.
Boosting
Boosting is a technique that improves a weak classifier, or learner, to achieve a higher accuracy. Adaptive Boosting (AdaBoost) is the most commonly used form and was introduced by Freund and Schapire (1997). Another form is LogitBoost, introduced by Friedman, Hastie, and Tibshirani (2000) to better address the issue of noise and outliers than AdaBoost. AdaBoost uses an exponential loss function while LogitBoost uses a linear loss function hence making LogitBoost less sensitive to noise and outliers. Kamarudin, Maple, Watson, and Safa (2017) created a LogitBoost based IDS in
conjunction with a Random Forest DT. As a motivation, they cited achieving low false alarm rates with high attack recognition for novel attacks as a major challenge. They were able to achieve a slightly better performance in terms of DR and accuracy using LogitBoost as compared to AdaBoost. They concluded that their algorithm provided a comparable detection accuracy rate with a low false alarm rate. They called a low false alarm rate, which they defined the same as FPR, as the most crucial property of IDSs.
Tama and Rhee (2019) created an IDS using Gradient Boosted Machine, also known as a Gradient Boosted Regression Tree. Gradient Boosted Machine was created to improve the performance of Classification and Regression Tree. Using UNSW-NB15
data, they demonstrated that their approach achieved a lower FPR and a higher accuracy rate than compared to another type of DT.
Mixture Models
Mixture models are a type of unsupervised learning technique used to identify subpopulations. Moustafa, Slay, and Creech (2017) created a method they called Geometric Area Analysis based on Trapezoidal Area Estimation computed from the parameters of a Beta Mixture Model. They used Principal Component Analysis (PCA) for reducing the high dimensionality of the data. Citing the inability of conventional IDSs to detect new intrusive events due to a high FPR, they demonstrated that their method provided a lower FPR than several other techniques using the NSL-KDD and UNSW-NB15 data sets.
Moustafa, Creech, and Slay (2017) proposed an Anomaly Detection System based on Finite Dirichlet Mixture Model with a PCA-based feature reduction. Their approach yielded a lower FPR than other comparable approaches, such as Multivariate Correlation Analysis and Triangle Area Nearest Neighbor, using the NSL-KDD and UNSW-NB15 data sets. The other approaches that they used for comparison were based on correlation and distance measures which usually cannot detect modern attacks that mimic normal traffic. However, they imply that their approach can detect such attacks due to the precise boundaries that can detect small differences between normal traffic and attack vectors.
Moustafa, Adi, Turnbull, and Hu (2018) put forth a new scheme based on a Beta Mixture Model and HMM which they call Beta Mixture HMM. Using UNSW-NB15
data, they demonstrated that their scheme outperforms Classification and Regression Tree, KNN, SVM, Random Forest, and Outlier Gaussian Mixture in terms of FPR, DR, and Accuracy.
Bayesian Approaches
Bayesian networks are a common classifier based on a directed acyclic graph with nodes representing attributes and arcs representing dependencies. A simplified form is the NB classifier where all of the attributes are assumed to be independent. Barbara, Couto, Jajodia, Popyack, and Wu (2001) used NB for their Audit Data Analysis and Mining platform for classifying cyber-attacks and non-attacks without prior knowledge of new cyber-attacks. Koc, Mazzuchi, and Sarkani (2012) cite several prior uses of
Bayesian statistics for IDS and present a Hidden NB model that relaxes the NB
conditionally independence assumption for better accuracy than traditional NB models.
Genetic Algorithm
A genetic algorithm is based on Darwin’s evolutionary principle of survival of the fittest and seeks to optimize a population of candidate solutions based on a fitness
function. Genetic algorithms simulate natural reproduction using cross over and other techniques similar to gene selection, mutation, and recombination. Crosbie and Spafford (1995) were one of the first to propose using a genetic algorithm for intrusion detection. Hoque, Mukit, and Bikas (2012) and others subsequently used genetic algorithms for IDS research but the results in relation to false positives were not promising compared to
other cited research. A drawback of the genetic algorithm is the amount of time and computing resources it takes to reach an optimal solution.
Neural Networks
The concept of an ANN, inspired by the function of the human brain, particularly the interconnection between neurons, has been around since McCulloch and Pitts (1943) devised a mathematical model for a neuron. ANNs typically consist of layers of nodes, which contain activation functions, connected by weighted directed links. ANNs use supervised learning. Labeled data are used to train the ANNs to learn classification patterns such as intrusion or no intrusion in the case of a binary classifier. Data are presented to an input layer that often links with one or more hidden layers that then link to an output layer that provides a result.
Cannady (1998) presented an ANN for misuse detection with network traffic and concluded that the advantages of that approach included the ability to learn. He listed disadvantages as the difficulty of obtaining sufficiently large amounts of training data and the black box nature of neural networks. In addition to the ability to learn, Russell and Norvig (2003) cite another advantage of ANNs is being able to tolerate noisy inputs.
Wang, Hao, Ma, and Huang (2010) argued that ANNs can improve the performance of IDSs when compared with other methods but that enhancement is required. They proposed an approach based on ANN and fuzzy clustering to achieve a higher detection rate, lower false positive rate, and better stability.
There has been much research into ANNs around optimal network structures, optimization of weights, training methods such as Back Propagation, and methods to
avoid overfitting and other challenges. There are several different network structures but Multi-Layer Perceptron (MLP) is the one that is most used in IDS research (Shah et al., 2015).
Self-Organizing Map
Self-Organizing Map, as described by Kohonen and Somervuo (1998), is a type of neural network that can map highly dimensional data into a two-dimensional array. Rhodes, Mahaffey, and Cannady (2000) cite that the first use of a Self-Organizing Map in misuse detection was described by Cannady in 1998 which involved the output of a Kohonen map as input to a feed-forward ANN to detect temporally dispersed attacks (over a period of time by one attacker) and possibly collaborative attacks (multiple attackers). Self-Organizing Map does not need to learn intrusive behavior but rather it learns it through characterizing normal activities. Shah et al. (2015), concur that Self-Organizing Map provides a simple and efficient method to self-categorize inputs for clustering that offers a higher speed compared with other learning methods.
Kernel Machines
SVM, sometime referred to more generally as kernel machines, research was begun by Boser, Guyon, and Vapnik (1992). SVM requires labeled training data and operates as a classifier by creating a hyper-plane to group data into normal or abnormal classes.
Perdisci et al. (2009), citing SVMs tendency to have low FPRs, created an IDS using a multiple SVM voting scheme to detect malicious payloads including polymorphic
shell code. Li et al. (2012) cited good accuracy results when using SVM for IDS with clustering and Ant Colony Optimization.
Advantages of SVMs include low FPRs and the ability to work with data that are not linearly separable by other techniques. However, they tend to be complex to
implement due to the required mapping of the feature space into a higher dimension which often requires optimization techniques that lead to long training times (Gilmore & Haydaman, 2016).
Bamakan, Wang, and Shi (2017) created an IDS using a variant of SVM called Ramp Loss K-Support Vector Classification-Regression which is a multi-class SVM approach that is well-adapted for skewed and imbalanced data sets, such as attack data sets used in IDSs. To combat the presence of noise in training data, they introduced a ramp loss function instead of the hinge loss function usually used in SVMs. The ramp function helps to depresses outliers. They compared their method to regular K-Support Vector Classification-Regression and demonstrated, using UNSW-NB15 data, that their algorithm substantially improved accuracy and reduced FPR.
ELM
ELM, introduced by Huang, Zhu, and Siew (2004) is an emerging technology for ML. ELM was originally developed from single-hidden-layer feed forward ANNs. ELM overcomes issues including slow learning speed and poor scalability faced with other techniques, such as ANN and SVM. The crux of ELM is that the hidden layer need not be tuned (Huang, Wang, & Lan, 2011). The input biases and weights that connect the
inputs to the hidden layer are chosen randomly while the output weights are calculated using a Moore-Penrose inverse which results in faster training times.
Numerous variations of ELMs have been proposed. Ding, Xu, and Nie (2014) outlined the evolution of ELM and discussed eleven different variations that had been proposed to improve its performance. Huang, Zhou, Ding, and Zhang (2012) proposed the equality constrained-optimization-based ELM, which integrates with the learning rules of a variant of SVMs, called least squares SVM, to find a global solution for the weights of the output layer. They purport ELM tends to have much better generalized performance for multi-class classification problems at up to a thousand times faster learning speeds than traditional SVM.
For the basic version of ELM, the number of hidden nodes (neurons) needs to be determined by the user typically by trial-and-error. Ding et al. (2014) stated that
determining the number of hidden neurons to use for different data sets is an open research problem. However, Huang, Zhu, and Siew (2006) demonstrated that ELM is very stable across a wide range of hidden nodes but performance can degrade with too few or too many neurons.
Huang, Chen, and Siew (2006) proposed a solution for this called Incremental ELM where hidden neurons are added incremental until a given criteria is met. Huang and Chen (2008) offered an enhanced version of this called Enhanced Incremental Extreme Learning Machine. And Wang, Xu, Lee, and Lee (2018) proposed an enhanced version of Equality Constrained-optimization-based Extreme Learning Machine, called Construction with Adaptive Increments, where the number of hidden neurons are
determined in an adaptively incremental way and the output weights are derived without having to be recomputed.
Cheng, Tay, and Huang (2012) applied ELM to the intrusion detection domain and concluded that the basic ELM model outperforms SVM in training and testing speed but had slightly lower accuracy using KDD99 data. But, a kernel-based ELM achieved higher accuracy than an SVM.
Castaño, Fernández-Navarro, and Hervás-Martínez (2013) introduced PCA-ELM. Their method eliminates the random initialization of the ELM weights and determines them based on a PCA of the training data. This method transforms the data into a number of principal components which often better highlights anomalies. They trialed their method on various non-IDS related data sets and reported positive results.
Zong et al. (2013) introduced a weighted ELM to compensate for complex data classes, such as in IDSs, where the majority class tends to be favored based on training data. In many IDS implementations, this class would typically be normal events. They assigned a weight to each sample to heighten the impact of the minority class while dampening the majority class. Other techniques were discussed such as over sampling or under sampling of the testing data but were dismissed. The authors demonstrated their approach using a variety of non-IDS data sets and were able to influence the balance of FPR and TPR as shown on a Receiver Operating Characteristic graph. Xia and Hoi (2013) used Multiple Kernel Boosting with the Multiple Classification Reduced Kernel ELM (Deng, Zheng, & Zhang, 2013).
Creech and Jiankun (2014) used an ELM approach for a HIDS in conjunction with a full semantic analysis of system calls. That resulted in higher accuracy and
reduced false positives compared to other techniques including SVM, HMM, MLP, and KNN. They highlighted the decision engine training speed with ELM but noted it has slightly higher processing needs.
According to Fossaceca et al. (2015), ELMs are straightforward to implement, computationally efficient, and have excellent learning performance characteristics. They implemented an ELM based IDS solution, dubbed MARK-ELM, that they purport achieves superior detection rates and much lower false alarm rates than other approaches to intrusion detection. The authors compare ELM to SVM and note that ELM
significantly outperforms SVM in computational speed while being on par with SVM for accuracy.
Wang et al. (2018) also applied their ELM-based Construction with Adaptive Increments solution to different IDS data sets and compared the results to those of MLP and SVM solutions. They concluded that ELM had faster training times but had mixed results for other performance measures such as FPR.
Deep Learning Approaches
Another more recent area of research in ML is on deep networks, which are multi-layer ANNs. Types of deep networks based on Restricted Boltzmann Machine include Deep Belief Network and Deep Restricted Boltzmann Machine. Types based on Auto-Encoders include Stacked Auto-Auto-Encoders and Stacked De-noising Auto-Auto-Encoders. Kasun, Zhou, Huang, and Vong (2013) concluded deep networks outperform traditional multi-layer ANNs, SLFNs, and SVMs for big data sets but exhibit slow learning speeds. Yu, Zhuang, He, and Shi (2015) citing the success of deep learning models and ELM,
created a deep learning ELM named DrELM. They compared both ELM and deep learning methods including linear ELM, kernel-based ELM using both Gaussian and Sigmoid kernels, Optimally-Pruned ELM, Deep Restricted Boltzmann Machine, and Stacked Auto-Encoder. They concluded that their DrELM outperforms linear and kernel-based ELM and is comparable to other deep learning methods using non-IDS related data sets.
Tchakoucht and Ezziyyani (2018), stated that Recurrent Neural Networks, a type of ANN, are one of the most widely used deep learning techniques due to their predictive ability with sequential (temporal) data. They developed an IDS using a Multilayered Echo-State Machine based on Reservoir Computing which in turn is based on both ML and computational neuroscience. Reservoir Computing was introduced as a solution for Recurrent Neural Network training bottlenecks, from accurate but slow training methods such as Long Short-Term Memory, that can involve exploding gradient, vanishing gradient, and slow convergence. Recurrent Neural Networks as a reservoir have been described as Echo-State Networks. Using an Echo-State Network involves randomly generating an individual Recurrent Neural Network layer (reservoir) and then only training the reservoir to output connections. Tchakoucht and Ezziyyani (2018) used multiple layers of reservoirs based on promising results for other applications. They were able to show improved performance over select other IDS techniques and suggested additional research to further improve DR and FPR. They provided comparisons to prior results using three data sets including UNSW-NB15.
Blanco, Cilla, Malagón, Penas, and Moya (2018) proposed another deep learning technique, Convolutional Neural Networks, for a multi-class IDS in conjunction with a
genetic algorithm. Convolutional Neural Networks are a type of MLP with a convolutional step to generate intermediate features to preserve spatial relationships between inputs before input into an MLP. Convolutional Neural Networks were inspired by the biology of animal visual cortexes and are typically used for image processing tasks. They arranged the features of UNSW-NB15 to create a 5x5 pixel image and optimized the classifier using a genetic algorithm to find a better layout for the input features. They obtained an accuracy of 98.14% but did not provide an FPR.
Muna, Moustafa, and Sitnikova (2018) proposed an IDS approach using Deep Auto Encoder with a Deep Feed Forward Neural Network architecture. They tested their approach against both the NSL-KDD and UNSW-NB15 data sets and concluded that their proposed approach provided a lower FPR and higher DR than other techniques used for evaluation.
Vinayakumar et al. (2019) modeled an IDS using a Deep Neural Network. They compared results to several other algorithms and with varying numbers of layers. While the results beat some classifiers in terms of FPR, their four-layer Deep Neural Network had an FPR of 26.4% compared to NB with 2.5% for normal traffic using the UNSW-NB15 data set.
Markov Models
A Markov model attempts to calculate the likelihood of a system in a given state based on a sequence of observations. An HMM (Baum & Petrie, 1966) is a Markov model with unobserved (hidden) states. Hu, Yu, Qiu, and Chen (2009) described HMMs as a double stochastic process with an upper layer Markov process whose states are not
observable and a lower layer one where outputs are emitted and can be observed. An HMM requires a five-tuple for input and is written as λ = (A, B, π) in compact notation where N is the number of states, M is the number of symbols per state, A is the state transition probability, B is the observation symbol emission probability distribution, and
p is the initial state distribution (Rabiner, 1989; Gilmore & Haydaman, 2016). Warrender, Forrest, and Pearlmutter (1999), calling HMMs one of the most powerful data modeling methods in existence, compared an HMM analyzing system calls as part of a HIDS, with three other methods. They found their HMM gave the best accuracy on average but at a high computational cost. Other researchers such as Hu et al. (2009) continued the focus on using system calls with HMM for a HIDS and proposed improved training methods which reduce training time but at the expense of slightly more false positives.
Ourston, Matzner, Stump, and Hopkins (2003) used an HMM to model multi-stage attacks using system calls. Their states consisted of probe, consolidate, exploit, and compromise. They used a C4.5 DT, an ANN, and an HMM on the same data and
concluded the HMM had the most promise to detect multi-stage attacks. Bhatt, Yano, and Gustavsson (2014) proposed a framework using the kill chain and concluded that using an HMM for event correlation for detecting APTs looks promising.
Wright, Monrose, and Masson (2004) used HMMs for determining what network protocol, such as File Transfer Protocol was being used in a given packet, even if the payload was encrypted, based solely on packet size and inter-arrival time. They used network traces provided by George Mason University and DARPA and reported promising results.