University of South Florida
Scholar Commons
Graduate Theses and Dissertations Graduate School
3-23-2017
Simulation Studies on ECG Vector Dipole
Extraction in Liquid Medium
Pratheek Michael
University of South Florida, [email protected]
Follow this and additional works at:http://scholarcommons.usf.edu/etd
Part of theBiomedical Engineering and Bioengineering Commons, and theElectrical and Computer Engineering Commons
This Thesis is brought to you for free and open access by the Graduate School at Scholar Commons. It has been accepted for inclusion in Graduate Theses and Dissertations by an authorized administrator of Scholar Commons. For more information, please [email protected]. Scholar Commons Citation
Michael, Pratheek, "Simulation Studies on ECG Vector Dipole Extraction in Liquid Medium" (2017).Graduate Theses and Dissertations.
Simulation Studies on ECG Vector Dipole Extraction in Liquid Medium
by
Pratheek Michael
A thesis submitted in partial fulfillment of the requirements for the degree of Master of Science in Electrical Engineering
Department of Electrical Engineering College of Engineering
University of South Florida
Major Professor: V. K. Jain, Ph.D. Richard. D. Gitlin, Sc.D.
Selçuk Köse, Ph.D.
Date of Approval: March 10, 2017
Keywords: Immersion Electrocardiogram, Ellipsoidal Phantoms, Sensing System, COMSOL-3D-simulation
DEDICATION
ACKNOWLEDGEMENTS
Primarily, I want to thank my major professor, Dr. Vijay K. Jain for his useful comments, remarks, encouragement and assistance which has been continuously provided through the learning process of this master thesis.
Besides my advisor, I would like to thank the thesis committee members: Dr. Richard. D. Gitlin, and Dr. Selçuk Köse for their encouraging and insightful feedback.
I would also like to acknowledge the Department of Electrical Engineering at USF for its support and encouragement.
I would like to thank the DOM, Government of Karnataka, India for their support and financial assistance.
Foremost I would like to thank my parents, especially my mother for her constant support and spiritual insight. They are always encouraging me with their best wishes.
TABLE OF CONTENTS
LIST OF TABLES iii
LIST OF FIGURES iv
ABSTRACT ix
CHAPTER 1: INTRODUCTION 1
CHAPTER 2: LITERATURE REVIEW AND BACKGROUND 3
2.1. A Note on Heart and ECG 4
2.2. Bioelectric Sources and their Analysis 4
2.2.1. Primary Assumptions 4
2.2.2. Monopole Analysis 5
2.2.3. Dipole Analysis 6
2.2.4. Source Analysis of a Medium with Different Conducting Regions 9
2.2.5. Resultant Dipole Moment 12
2.2.6. Reciprocity Theorem 13
CHAPTER 3: ECG DIPOLE VECTOR EXTRACTION IN LIQUID MEDIUM 14 3.1. Dipole Potential Distribution in 1-Dimension and 2-Dimension 14 3.2. Block Diagram Representation of System Setup 16 3.3. Basis Signal Formulation and Extraction (Section 1) 17 3.4. Simulation of Bathtub-Ellipsoid Model in Water Medium (Section 2) 20
3.4.1. 3-Dimensional Current Dipole 22
3.4.2. Analysis of Single Ellipsoidal Phantom in Water Medium 23 3.4.3. Analysis of Double Ellipsoidal Phantom in Water Medium 27
3.5. Extraction of Sensing Matrix (Section 3) 28
3.5.1. Case Study for Single Ellipsoidal Phantom in Water Medium 30 3.5.2. Case Study for Double Ellipsoidal Phantom in Water Medium 32 3.6. Reconstruction of Basis Signals using Sensing Matrix (Section 4) 34
CHAPTER 4: CONCLUSIONS 36
4.1. Conclusions 36
4.2. Future Work 36
REFERENCES 38
A.1. Heart and ECG 44
A.1.1. Electrical Activity in the Heart 45
A.1.2. Path for Electrical Conduction in the Heart 46
A.1.3. A Note on Sinoatrial (SA) Node 47
A.1.4. A Note on Vector Representation of the Heart 48
A.1.5. ECG Terminology 49
A.1.6. Ventricular Depolarization for Generation of QRS Complex 52
A.2. Current Dipole Moments in Literature 53
APPENDIX B: DIPOLE EXPERIMENTS IN COMSOL 54
B.1. Model for Verifying Theoretical Concept in COMSOL 54
B.2. Different Types of Dipole Configuration 55
B.2.1. Horizontal Dipole Model 55
B.2.2. Vertical Dipole Model 57
B.2.3. Effect of Medium Size on the Potential Distribution Pattern 58
B.3. Dipole Model Using Small Copper Plates 61
B.4. Potential Distributions for Bathtub Ellipsoid Models 63 B.5. Effect of the Torso Geometry on the Potential Distribution in a Medium 66 B.5.1. Cuboidal Medium with Eccentric Dipoles in Varying Torso Shapes 66 B.5.2. Rectangular Medium with Dipoles in Varying Torso Shapes 67 B.6. COMSOL Procedural Steps in the Context of this Research 69
B.6.1. Research Problem 70
B.7. Proposed Experimental Setup Assembly 79
B.7.1. Structure for Creating 3-Dimensional Dipole (3D-D) 80
APPENDIX C: PRELIMINARY EXPERIMENTS ON 3D-MONOPOLE 81
C.1. System Setup 81
C.1.1. Noise and Bias Effects Reduction 81
C.2. Transferring an fECG or mECG File to BK Function Generator 83 C.3. Singular Excitation of Current Monopoles to Create a Balanced Effect 83
LIST OF TABLES
Table 3.1. NRMSE for reconstruction of different type of signals applied to the
3D-CD in COMSOL 34
Table A.1. Details of intrinsic frequencies of different heart locations 46
Table A.2. Dipole moments (P) from literature 53
Table B.1. Effect of monopole size on the potential distribution around the medium 63 Table B.2. Effect of dipole located at the center inside different torso shapes in a
cuboidal medium 67
Table B.3. Effect of dipole located at an eccentric point inside different torso shapes
in a cuboidal medium 67
Table B.4. Effect of dipole at the center inside different torso shapes in a rectangular
medium 68
Table B.5. Effect of dipole located at an eccentric point inside different torso shapes
in a rectangular medium 69
LIST OF FIGURES
Figure 2.1. Representation of positive monopole in a spherical medium 5 Figure 2.2. Representation of a current dipole in 2D inside an infinite conductive
medium 6
Figure 2.3. Representation of current dipole in 3D in an infinite volume
homogeneous medium 8
Figure 2.4. Representation of reciprocity theorem 13
Figure 3.1. Results for current dipole potential distribution equation plotted for 1D
case from theory and verified using COMSOL 15 Figure 3.2. Current dipole equation plotted for 2D case in MATLAB 15 Figure 3.3. Block diagram of the overall flow of the research 16 Figure 3.4. Representing the basis signals for the 3D-CD extracted from mECG 17 Figure 3.5. Representing the original ECG signals and the reconstructed perfectly
overlapping signals for mECG (through SVD approach) 19 Figure 3.6. Representing basis signals for the 3D-CD extracted from fECG 20 Figure 3.7. Original fECG and reconstructed fECG signals (through SVD
approach) 21
Figure 3.8. Showing the locations of the electrodes in the bathtub; #1, #2 are on the front surface; #3, #6 are on the side surface; #4, #5 are on the back
surface; #7, #8 are on the bottom surface. 21
Figure 3.9. 3D-current dipole 22
Figure 3.10. Signals recorded from the bathtub sensing electrodes for 3D-CD
responding to fECG basis signals 23
Figure 3.11. Showing a single ellipsoid placed in the bathtub (front face of the
Figure 3.12. Electrode signals recorded from the bathtub for mECG basis signals
exciting the 3D-CD inside the single ellipsoid model 24 Figure 3.13. Non-overlapping synthetic signals exciting the 3D-CD 25 Figure 3.14. Potential distribution recorded by the sensing probes on the inner
surface of the bathtub for non-overlapping synthetic signals exciting
the 3D-CD 26
Figure 3.15. Overlapping synthetic signals exciting the 3D-CD 26 Figure 3.16. Potential distribution recorded by the sensing probes on the inner
surface of the bathtub for overlapping synthetic signals exciting the
3D-CD 27
Figure 3.17. Showing the two ellipsoids (pregnant subject and the fetus) placed in
the bathtub 28
Figure 3.18. Potential distribution plot observed at the bathtub probes for the
activity of two 3D-CD in the two ellipsoidal phantoms 29 Figure 3.19. Non-overlapping synthetic signals acting as input to 3D-CD in one
ellipsoid model and 8×3 sensing matrix extracted is shown on the right 30 Figure 3.20. Overlapping synthetic signals acting as inputs to 3D-CD in one
ellipsoid model and 8×3 sensing matrix extracted is shown on the right 31 Figure 3.21. mECG basis signals acting as input to 3D-CD in one ellipsoid model
and 8×3 sensing matrix extracted is shown on the right 31 Figure 3.22. fECG basis signals acting as input to 3D-CD in one ellipsoid model
and 8×3 sensing matrix extracted is shown on the right 32 Figure 3.23. Two different types of synthetic signals exciting the two 3D-CDs
inside two ellipsoids and 8×6 sensing matrix extracted is shown on the
right 33
Figure 3.24. Basis signals from fECG and mIECG (derived from mECG) exciting the two 3D-CDs inside two ellipsoids and 8×6 sensing matrix extracted
is shown on the right 33
Figure 3.25. Highly overlapping original basis signals and reconstructed basis
signals; magnified sections are shown on the right 35
Figure A.1. Block diagram of systemic circulation 44
Figure A.3. Representation of the flow of impulse in the heart 47 Figure A.4. ECG waveform having details of various wave periods 49
Figure A.5. Standard leads or limb leads 51
Figure A.6. QRS complex during ventricular depolarization 52 Figure B.1. Simple rectangular medium for validation of results from COMSOL 54 Figure B.2. COMSOL analysis of 10 x 1 x 1 cm rectangular medium 55
Figure B.3. Horizontal dipole configuration 56
Figure B.4. Potential plot of horizontal dipole simulated in COMSOL 57
Figure B.5. Vertical dipole configuration 57
Figure B.6. Potential distribution due to the activity of vertically oriented dipole 58 Figure B.7. The potential distribution pattern (XZ) noticed for a dipole oriented in
X-direction (horizontally) along the length of the medium (where L>
B> H) 59
Figure B.8. The potential distribution pattern (XY) noticed for a dipole oriented in X-direction (horizontally) along the length of the medium (where L>
B> H) 60
Figure B.9. The potential distribution pattern (XY) noticed for a dipole oriented in Z-direction (vertically) along the height of the medium (where H< B<
L) 60
Figure B.10. The potential distribution pattern (XZ) noticed for a dipole oriented in Z-direction (vertically) along the height of the medium (where H< B<
L) 61
Figure B.11. Dipole created using tiny copper plates 62 Figure B.12. 2D potential map of dipole created using copper plates 62 Figure B.13. Potential distributions caused by the activity of 3D-CD in a bathtub
containing tap water; XY view 63
Figure B.14. Potential distributions caused by the activity 3D-CD in a bathtub
containing tap water; XZ view 64
Figure B.15. Potential distribution caused by the activity of 3D-CD inside single
Figure B.16. Potential distribution caused by the activity of 3D-CD inside single
ellipsoidal phantom placed in a bathtub containing water; XZ view 65 Figure B.17. Potential distribution caused by two 3D-CDs inside a double
ellipsoidal phantom laying in the bathtub filled with tap water; XY
view 65
Figure B.18. Potential distribution caused by two 3D-CDs inside a double ellipsoidal phantom laying in the bathtub filled with tap water; XZ
view 66
Figure B.19. Cuboidal medium containing different torso shapes 66 Figure B.20. Rectangular medium with dipole at different locations inside different
torso shapes 68
Figure B.21. Selection of dimension of workspace 69
Figure B.22. Selection of the appropriate physics 69
Figure B.23. Selection of study type 70
Figure B.24. Icon for starting a new simulation 70
Figure B.25. Workspace selection 71
Figure B.26. Selection of physics for solving the problem 71
Figure B.27. Selection of study type 71
Figure B.28. Option for selection of an ellipsoid 71
Figure B.29. Ellipsoid dimensions on the left and the model built is shown on the
right 72
Figure B.30. Details on explicitly selecting the ellipsoid 72
Figure B.31. Rotation setting and the built model 73
Figure B.32. Representation of double ellipsoids 73
Figure B.33. Inputs for the eccentric points in the medium 74 Figure B.34. Representation of double ellipsoidal phantom with eccentrically
located points 74
Figure B.36. Details depicting how to rotate the model built 75
Figure B.37. Bathtub ellipsoid model 76
Figure B.38. Options for selection of materials 76
Figure B.39. Importing a basis signal from external file 77
Figure B.40. Interpolation 77
Figure B.41. Option to create a point electric dipole 77 Figure B.42. Specification of the two vector dipoles located eccentrically inside
each ellipsoid 78
Figure B.43. Details on adding probes to the medium 78
Figure B.44. Details to choose the type of study 79
Figure B.45. Assembly of the ellipsoid and 3D-CD in the plastic container model 79 Figure B.46. Mounting structure for the 3D-D built using 6 copper plates in
orthogonal directions 80
Figure C.1. System setup 82
Figure C.2. Block diagram of fECG or mECG file transfer from PC to BK 83 Figure C.3. Experiment of 3D-M using singular excitations 85
Figure C.4. Inputs to the 3-axis monopoles 86
Figure C.5. Potential distribution recorded at the probes with mean subtracted
when X-axis monopole is active 86
Figure C.6. Potential distribution recorded at the probes with mean subtracted
when Y-axis monopole is active 87
Figure C.7. Potential distribution recorded at the probes with mean subtracted
ABSTRACT
To circumvent some inherent problems in the conventional ECG, this research reinvestigates an ‘unassisted’ approach which enables ECG measurement without the placement of leads on the body. Employed in this research is a widely accepted assumption that the electrical activity of the heart may be represented, largely, by a 3-D time-varying current dipole (3D-CD). From the PhysioBank database, mECG and fECG data were obtained, and Singular Value Decomposition (SVD) was performed to estimate the time varying Vector ECG dipole. To determine the sensing matrix responsible for transforming the activity of the 3D-CD into the potential distribution on the surface of the medium, the ECG vector dipole signals are used to excite a 3D-CD in water medium of specific shape-containing-ellipsoid model(s) in COMSOL tool. The sensing matrix thereby estimated is then utilized to reconstruct the 3D-CD signals from the signals measured by the probes on the surface of the medium. Fairly low NRMSEs (Normalized Root-Mean-Squared Errors) are attained. The approach is also successfully extended to the case of two ellipsoids, one inside the other, representing a pregnant female subject. Low NRMSEs (Normalized Root-Mean-Squared Errors) are again observed.
CHAPTER 1: INTRODUCTION
ECG measurements record the projections of the electrical activity of the heart vs. time. Bioelectric sources can emulate that activity. Therefore, this research focuses on a technique to extract the signals of origin based upon the recorded ECG waveforms which can represent the activity of the heart. Researchers profess that the electrical properties of the heart can reflect a current dipole. Therefore, the concept of SVD decomposition was applied to extract these basis signals (source signals) and excite a COMSOL model of a 3-dimensional current dipole (3D-CD) which best represents the electrical activity of the bioelectric source present in the heart. The aim is to make this research helpful and get proper applications. Therefore, we reinvestigate ECG measurements using liquid media and incorporate the research of ECG vector dipole to extract a “sensing matrix” which is responsible for transforming the electrical activity of the vector dipole into potential distribution in the surrounding media. The adoption of telehealth monitoring has been on the rise, where individuals can monitor their body vitals at the comfort of their home and a physician telephonically can interpret the results. This research can be used to test ECG telehealth monitoring systems to improve their accuracy and precision.
Chapter 2 gives an overview of the bioelectric sources and their analysis from literature, and some insight on sources embedded inside inhomogeneous media which can be quantified to just two regions to provide more focus on this research. Chapter 3, explains the main idea of using the source signals to extract sensing matrix using 3D-CD inside a liquid medium to facilitate the process. The thesis further stresses on the fact that with the help of the potential distribution on the
outer surface of the medium and the sensing matrix, reconstruction of the original basis signals and the original ECG signals are possible. Chapter 4 focuses on relevant conclusions which can be inferred from this research and the future research possibilities built on the research problem presented in this thesis.
Related useful information is provided in the appendices. Appendix A provides background and literature review about the Heart and ECG-related terminologies. Appendices B.1 to B.5 covers most significant results from the COMSOL experiments. A handy exposition on the procedural steps is provided in Appendix B.6. Appendix C embarks on the topic of 3D monopoles. The analysis of a pair of monopole by unequal excitation and its result is detailed in this section.
CHAPTER 2: LITERATURE REVIEW AND BACKGROUND
Recent ECG research has encompassed areas ranging from cardiac activation locations [1], electrode sensitivity variations [2], conductive fabric for sensing bio-potentials [3], Noise reduction techniques [4], wearable electronics [5], sleep apnea detection [6], Carbon black PDMS electrodes [7], Ubiquitous-ECG [8], non-contact electrodes [9]-[10], arrhythmia detections, and biometric recognition through ECG [11]. To understand the nature of cardiovascular health one requires a correct approach for measuring the bioelectrical and bio-magnetic data through invasive and non-invasive techniques.
These methods record the electrical activity of the heart and require human subjects for precision and accuracy of experimental results. An alternative is the inverse problem of ECG, which is adopted by many researchers sharing a similar view to model a bioelectric source. These include heart surface activation imaging [12]-[14], a moving dipole model [15], epicardial potential mapping [16]. Heart models are being used to solve the inverse problems in 3D which includes computational [17]-[18] and experimental results [19]. These are aided by heart models [17], [20], [21]. Telehealth monitoring involves the technological assistance in monitoring the patients, while the patient conducts the measurements themselves under no supervision [22]. These remote monitoring systems are seeing an increase in adoption rates as the reduced costs favor the users [23], [24]. However, the telehealth monitoring systems suffer from the decreased signal quality due to some factors ranging from non-expert users to single lead measurements which result in a distorted signal amplitude with noise infested waveforms.
2.1. A Note on Heart and ECG
The heart has specialized pacemaker cells which generate electrical impulses which result in the pumping of blood for systemic circulation. These impulses are responsible for the body surface potential distribution. Frank [30] suggested the use of Limb leads for recording the ECG potentials. More on the Heart and ECG is detailed in Appendix A.
For almost five decades there have been researchers who have tried to model the electrical activity of the heart with the help of bioelectric sources. The most accepted and professed bioelectric source is the current dipole. In this section, emphasis is given to topics like bioelectric current monopole, dipole and its use in the present research.
2.2. Bioelectric Sources and their Analysis 2.2.1. Primary Assumptions
For this research, we take into account a list of assumptions taken from the literature for supporting our results and stating our theory. The assumptions are as follows,
1) Helmholtz [31] introduced the reciprocity theorem. He pointed out that the principle of superposition could be the best bet to be applied to any bioelectric problem. The principle states that “The electric field arising from several sources is the sum of the fields that would be present for each source acting separately.”
2) Schwan and Kay [32] suggested that the current density in regions beyond the site of an action potential is linearly related to the Electric field intensity.
3) Schwan and Kay [33] suggested that the capacitive component of the impedance is negligible at frequencies below several kiloHertz, these sub kiloHertz frequencies are of interest in ECG.
5) The pulse rise times of the order of a microsecond suffer only minor distortion through the thorax
2.2.2. Monopole Analysis
When a point current source is present inside a uniform volume conductor, it will give rise to voltage gradients around it in the medium [35]. The monopole is considered to be point source whose effect can be analyzed as follows,
Consider that a point source of electric current is embedded in a uniform conducting medium of conductivity σ Siemens/m. Let the monopole be at the position (x, y, z) the currents are radial as the medium assumed is uniform. The current density for the monopole source is
(2.1) 4 2 r o a r I J (2.2) ) ( ) ( ) ( 2 2 2 2 x x y y z z r
where J is the current density, and ar is the unit vector which is directed radially outward. The potential at any point inside the medium is ΦPm given by
(2.3) 4 Pm r Io
Using equation (2.3) the potential at any point within the medium containing the monopole can be evaluated. Mathematically a monopole can be considered and modeled as a singularity. It is very rare that natural sources of bioelectricity involve monopoles (because of the need to conserve charges) since sources arising from sensitive tissues consist of differentially spaced source and sink combinations [35] Therefore, it is considered in this research that the dipole is the primary bioelectric source.
2.2.3. Dipole Analysis
A dipole can be considered as a pair of current monopoles of equal magnitude but opposite polarity separated by a small distance in an infinite medium of conductivity σ Siemens/m. The electric potential due to the dipole can be derived using (2.3), and it is given by
(2.4b) * 1 4 (2.4a) 4 Pd Pd d d r I r I d d o o wkt, (2.6b) 1 4 1 (2.6a) 1 4 (2.5) 1 1 Pd Pd p r d a r I a r r d d o d wkt, (2.7) d r for cos 4 1 (2.6c) 1 2 Pd 2 r p r a r r *d I p o where,
To find the potential distribution in between the two monopoles or at distances less than the separation distance between the dipoles we use,
(2.8) d r for 1 1 4 Pd r r I
where ‘p’ is the dipole moment vector, r, r+, r- are the vectors from (a) the dipole center, (b) the source and (c) the sink, ϴ is the angle between the vectors p and r as shown in Fig.2.2.
The single dipole model of the heart's electrical activity can be simplified and explained based on a dipole shown in Fig. 2.3 in an infinite volume homogeneous conductor. Then the potential generated at any location inside the volume conductor of conductivity Siemens per meter is given by (2.9) ) ( ) ( ) ( 4 1 4 ) ( ) ( 3 3 3 3 t p r r t p r r t p r r r r t p t V z z y y x x r Figure 2.3: Representation of current dipole in 3D in an infinite volume homogeneous medium
2 2 2 2 3 ) ( ) ( ) ( where, (2.10) ) ( ) ( ) ( 4 1 z z y y x x r r b t p r t p r t p r b x x y y z z 2.2.4. Source Analysis of a Medium with Different Conducting Regions
The discussion in this subsection attempts to prove a simpler method for the analysis of current dipole inside a medium separated by two boundaries [36]. Consider a current dipole inside a medium of conductivity that can be represented by an impressed current density, by a current dipole moment per unit volume. The medium including a source can be written as
(2.11) i J E J
Using assumption no.4, it can be said that Electric field can be obtained by the gradient of the electric scalar potential, V.
(2.12) V E
Using assumption no.3, it is stated that as sources vary, charges quickly gets redistributed on the boundaries without any delay.
(2.13) 0 J
Using (2.13), equation (2.11) can be modified as,
(2.14b) (2.14a) i i J V E J
Consider a surface Sj is separating regions of conductivity ’ and ’’ and let dSj be the differential element of area of this surface. Considering that dSj is directed from primed to double primed region. The currents must be continuous across each boundary, therefore,
(2.15) '' '' ' 'V dSj V dSj
The potential across the boundary has to be continuous as well,
'' (2.16) ' Sj V SjV
The solution to the source activity at the boundary of the second layer is given by using greens theorem on an element dv in a homogeneous region, v, with two functions and Φ, well behaved in each region,
]
(2.17) [ dS dv v v j jSj Using the boundary conditions (2.15) and (2.16) with the knowledge of the impressed current density one can find the potential on the boundary of the outer region. By appropriately identifying and Φ in the region. Choosing r and Φ=V and derive the equation for the potential at the outer surface of a region
4 1 ( ) 1 ] 1 o (2.18) o s j jSj v i dS r V dS r V dv r J V
The term in the tail end is separated and written as the outer surface after the double primed region has zero conductivity, and the summation only applies across the internal surface discontinuities. The inverse of the above-said problem is stated as “Knowing the potential distribution on the outer surface of a region the source activity can be evaluated” using (2.18).
By reapplying greens theorem, a relationship can be established between the surface measurements and the source distribution of an equivalent generator. Using equation (2.17) and letting 20 where and its first derivatives are continuous everywhere in the volume conductor. The result in (2.18) can be changed to
(2.19) ] ) ( o o s j j Sj v i dv V dS V dS J
If P is a fictitious volume distribution of sources in a homogeneous conductor of conductivity o chosen such that potential on the Surface So remains unchanged then,
(2.20) dv P dS V o o s o
The above equation can reflect this change as follows,
(2.21) ) ( j jSj v i o o s o dS P dv J dv V dS V
To evaluate the integral on the left of (2.21), the knowledge of the potential across the outer surface boundary of the region is required. The multipole expansion [37] gives a canonical description of P in terms of singularities at a single point.
The various terms can be obtained using (2.22)
(2.22) ) (cos )! ( )! ( ) 2 (
m im n n o m nm r P e m n m n Using the spherical coordinate system r, ϴ, Φ are the coordinates of a point in space relative to origin at the location of the multipoles, P is the associated Legendre polynomial, and δ is kronecker delta which is unity for m=0 and zero otherwise, both n and m are nonnegative integers, and m is less than or equal to n. Note that2nm0. The multipole components, anm and bnm are given by (2.23). This equation can be expanded using the term (2.21)
(2.23) dv P ib a nm s nm nm
(2.24) ) ( j jSj nm v nm i o nm o s o nm nm ib V dS J dv V dS a Thus one can say the multipole components can be evaluated from the knowledge of the surface potential distribution and can be related to the actual source distribution.
When n=1, dipole term is prominent for which
(2.25b) sin (2.25a) cos 11 10 iy x e r z r im
If the dipole moment, p is defined as,
(2.26) 10 11 11 jb ka a i p then (2.27) ) ( dSj Pdv jSj V dv v i J o dS o s V o p
Thus with the knowledge of potential distribution on the outer potential distribution, the information of the source activity of the source inside any inhomogeneous region of different conductivity can be known.
2.2.5. Resultant Dipole Moment
D. Gabor et al. [38]assert that the potential mapping could be recorded from a single dipole source located in a non-specified geometry conductor with small error compared to mapping the actual potential distribution in a human torso. If P represents the dipole moment, is the conductivity of the volume conductor containing sources and V accounts for the Potential on the body of the volume conductor, then the resultant moment is given by
(2.28) s dS V P
The theory was verified in electrolytic tank model made in the shape of the human thorax. In 2D, the model was based on a full-size cross section of the human thorax; consideration was taken of the different resistivity. A dipole was introduced near the heart region of this model and
the orientation of the heart vector which was found from practical experimentation and known calculated values the direction of the dipole calculated was within 1º, and the calculated locations were correct within 0.5 cm. The magnitude of the current dipole from literature survey is tabulated and given in the Appendix A.2 these results are the dipole moments in human subjects. In this research, a dipole moment of 10 mA-cm will be employed for simulation models.
2.2.6. Reciprocity Theorem
Herman Von Helmholtz [31] introduced reciprocity theorem in the late 1800’s, and it acts as a common property for all linear systems. The reciprocity theorem states that a current entering and current sink of equal magnitude leaving a volume conductor at two separate locations will give rise to fields everywhere and in particular to a potential difference measured between two locations on the surface of the conductor. The inverse of this experiment being that a current injected on the surface produces a potential difference at the locations inside the volume conductor is true as well. A summary of the reciprocity theorem can be as seen in Fig. 2.4.
(2.29) * * 12 4 3 I V I V
CHAPTER 3: ECG DIPOLE VECTOR EXTRACTION IN LIQUID MEDIUM
To interlink the topics of research on bioelectric sources, ECG measurements, and the present research described in this thesis, many software were used for simulating realistic 3D models. This chapter details the research idea of the thesis through COMSOL models, and the results are analyzed using MATLAB. Although all of the simulations performed during the investigation cannot be included here in detail, a few relevant results and their influence on this research are detailed in Appendix B.
3.1. Dipole Potential Distribution in 1-Dimension and 2-Dimension
This subsection provides results of the potential distribution of a current dipole with respect to a realistic model of current dipole set up in COMSOL and its theoretical analysis. For convenience, the dipole potential distribution equation given in chapter 2 is repeated
(2.8) d r for 1 1 4 (2.7) d r for cos 4 1 Pd 2 Pd r r I r p
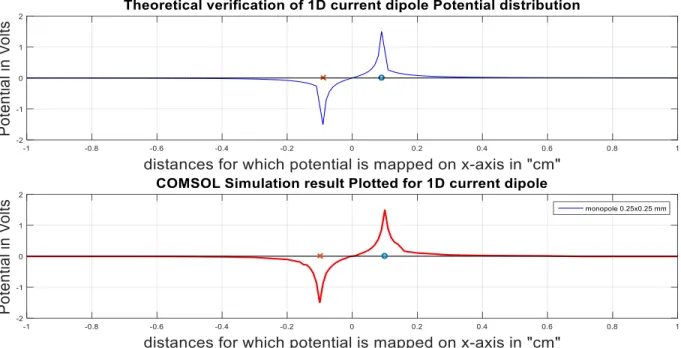
For 1D and 2D cases (2.7) and (2.8) were used to theoretically evaluate the potential distribution of a current dipole. A COMSOL model of a current dipole was created using 0.025 x 0.025 cm copper plates where dipole separation was maintained to be 2 mm in a homogeneous medium of conductivity 0.05 S/m and dimensions 10 x 5 x 5 cm. The distributions were mapped at distances incrementing on one axis only as shown in Fig. 3.1.
Figure 3.1: Results for current dipole potential distribution equation plotted for 1D case from theory and verified using COMSOL
The peaks of the resulting potential distributions of current dipole in both the theoretical analysis and COMSOL based simulation are almost the same as shown in Fig. 3.1. Using the equation for potential distribution of a current dipole, the potential distribution of any point varying with respect to the dipole on both x and y-axis can be found, and it is plotted as shown in Fig. 3.2. 3.2. Block Diagram Representation of System Setup
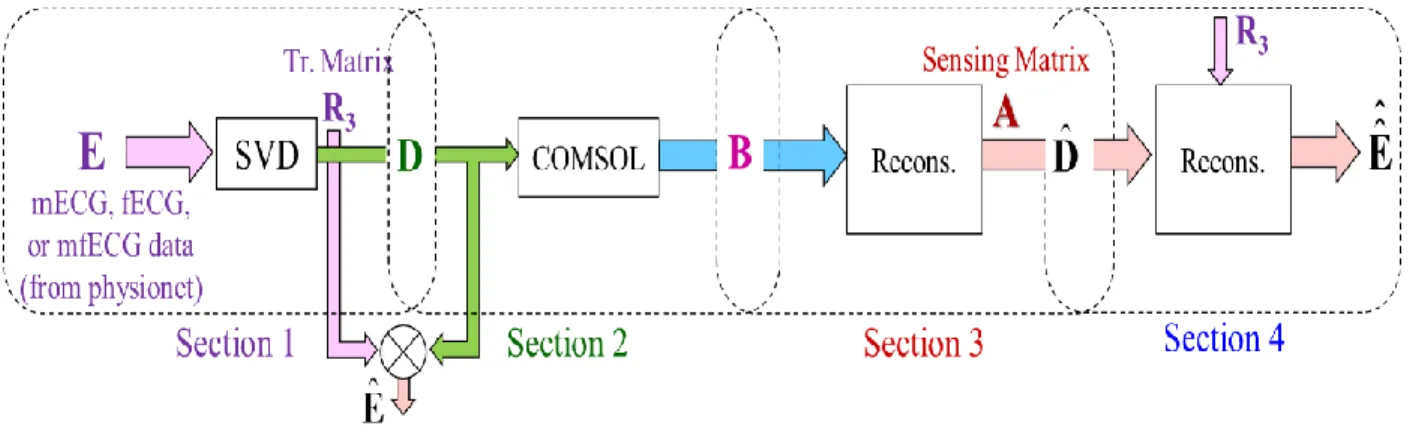
A representation of the overall process which is detailed in the succeeding pages of this chapter is represented by a block diagram in Fig. 3.3
First, upon publicly available ECG data from physionet [39], Singular Value Decomposition is applied to find the dominant singular values and, correspondingly, the 3-D time-varying Current Dipole (3D-CD) signals (compacted into a matrix D), which are responsible for the potential distribution inside a medium. These signals excite a COMSOL model of 3D-CD located inside a box shaped medium-ellipsoid model. The simulation outputs (compacted into a matrix B) are in turn used to extract the sensing matrix (A) which is used to reconstruct the 3D-CD signals which can, in turn, be used to reconstruct the basis signals (D-hat) and the original ECG data (E-hat). This block diagram of Fig. 3.3 will be explained in detail in the following subsections.
3.3. Basis Signal Formulation and Extraction (Section 1)
PhysioBank [39] is an extensive collection of digital recordings of physiological signals and related data which can be used for biomedical research. That database includes multi-parameter cardiopulmonary, neural, and other biomedical signals from healthy subjects and diseased subjects with chronic disorders. Our main focus was on the ECG database, as it contains data recorded and artificially created for healthy, pregnant, and diseased subjects. This research utilizes the mECG and fECG signals of 10 seconds record length from the Synthetic database in PhysioBank.
As every cardiac researcher has professed the bioelectric activity of the heart can be represented by a current dipole, this research mainly focuses on the concept of finding the Vector characteristics of the 3D-CD and will aid us in the reinvestigation of Bathtub approach for ECG recording [29]. The Singular Value Decomposition (SVD) approach is used to extract the dominant three singular values which we term as the basis signals from the ECG, fECG (fetal ECG), and mECG (mothers ECG) all from Physionet [39]. The approach for the extraction of singular values are as follows, If that data is of dimension ‘m×N’ where N>>m, then through SVD, (3.1) ] [ ] [ ] [ ] [E m N U mm S mN V TN N
where ‘E’ is the original ‘m×N’ ECG data which is decomposed into three different matrices U, S, and V. Here ‘U’ is an orthogonal m×m matrix, ‘S’ is a m×N matrix – where the lead m×m matrix is diagonal, and ‘V’ is an orthogonal N×N matrix. A more compacted form of (3.1) can be written as follows,
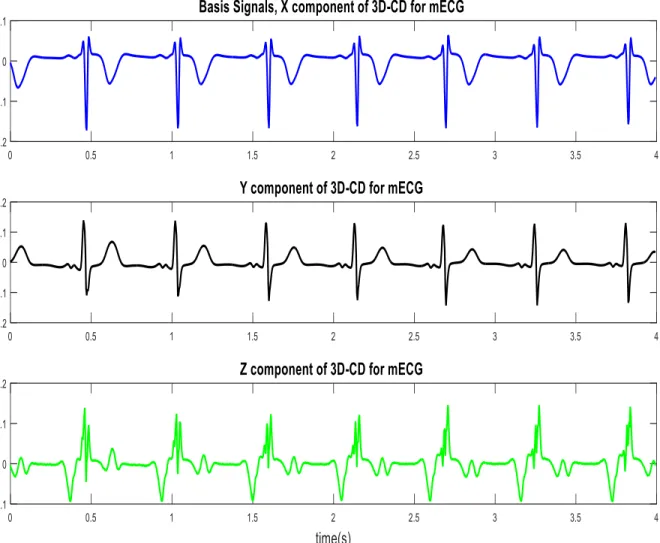
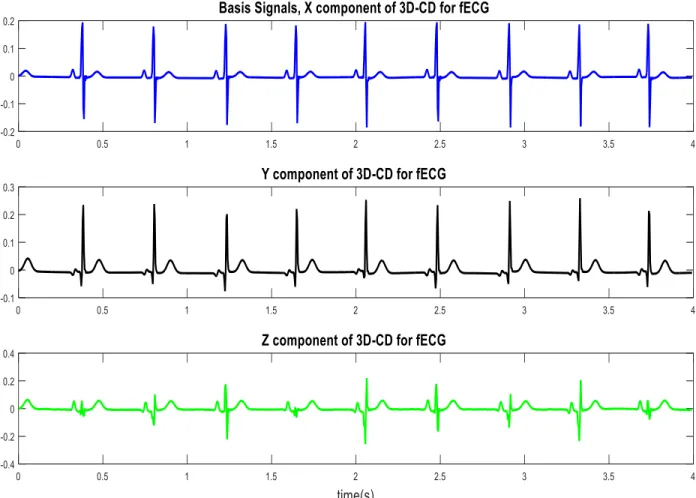
[E] m N [R]m N[V]TN N (3.2) Here ‘R’ represents the transmission matrix obtained through SVD analysis. The Singular value matrix is represented as ‘V’, and 3 dominant singular values are selected whose effect is profoundly noticed in E. These three singular values are named as ‘D’ .Quantitatively we can say that 0.022 Normalized Root Mean Squared Error (NRMSE) for the reconstruction of mECG and 0.086 NRMSE for the reconstruction of fECG was obtained from this approach of separating the dominant singular values. The basis signals from mECG and fECG extracted from the SVD process is shown in Fig. 3.4 and Fig. 3.6. The Reconstructed fECG and mECG signals using SVD approach are shown in Fig.3.5 and Fig.3.7. In a similar fashion, we represent the first three columns of the original transmission matrix ‘R’ and rename it as ‘R3’.
(3.4) 3 m ] [ ] 3 [ (3.3) N 3 T ] [ ] [ R R V D
The basis signals ‘D’, thus obtained are used for further analysis through COMSOL on the 3D-CD model inside the ellipsoid which will be explained in detail in the following subsection.
Figure 3.5: Representing the original ECG signals and the reconstructed perfectly overlapping signals for mECG (through SVD approach)
3.4. Simulation of Bathtub-Ellipsoid Model in Water Medium(Section 2)
This research reinvestigates an innovative approach [29] which utilized an unassisted bathtub approach of ECG recording using water as the conducting medium. The subject whose ECG was to be monitored has to lay in a Bathtub filled with tap water and passive sensing probes attached to the inner surface of the bathtub will record the ECG from the subject. The present research employs a 3-dimensional current dipole (3D-CD) simulation model for representing the activity of a human heart. In this research, COMSOL tool is employed for simulating a realistic bathtub and a 3D-CD for analyzing the potential distribution sensed by the passive sensing probes attached on different faces of the bathtub as shown in Fig. 3.8.
Figure 3.7: Original fECG and reconstructed fECG signals (through SVD approach)
Figure 3.8: Showing the locations of the electrodes in the bathtub; #1, #2 are on the front surface; #3, #6 are on the side surface; #4, #5 are on the back surface; #7, #8 are on the bottom surface.
3.4.1. 3-Dimensional Current Dipole
This research utilizes the concept of a current dipole and represents the vector dipole as 3-dimensional-current-dipole (3D-CD). The dipoles on all the three axes act simultaneously for mimicking the electrical behavior of the heart. The 3D CD can be visualized as shown in Fig. 3.9.
The activities of the 3D-CD can be recorded and analyzed using any analysis software. The 3D-CD was used on a model of the bathtub (created using Solid Works) and was analyzed using basis signals extracted from SVD as well as artificially generated signals for recording the potential distribution of the 3D-CD on the inner surface of the bathtub using passive sensing probes.
The details of the inner dimensions of the bathtub created using Solid Works are 142.5 cm x 67.05 cm x 45 cm. Probes added via COMSOL for recording the time-dependent activity of the 3D-CD and is shown in Fig. 3.8.
The output response which is recorded by applying a basis signal on the 3D-CD inside the bathtub is shown in Fig. 3.10. The Potential distribution on the surface of the bathtub for a stationary analysis is given in Appendix B this potential distribution pattern enabled the placement of probes for efficient signal capture.
3.4.2. Analysis of Single Ellipsoidal Phantom in Water Medium
An ellipsoidal phantom is used to represent the human torso (it is proved using simulation models that with considerable accuracy the human torso shape can be approximated to the simplest of shapes, proof and details are given in Appendix B). The dimensions of the ellipsoid are 70 cm×52 cm×30 cm which is almost equal to a human torso. The overall conductivity inside the ellipsoid is taken to be 0.21 S/m. The model is placed inside the bathtub containing tap water of conductivity 0.05 S/m. This represents an adult laying inside a bathtub equipped with sensing electrodes on its inner surface and filled with tap water.
Figure 3.10: Signals recorded from the bathtub sensing electrodes for 3D-CD responding to fECG basis signals
Figure 3.11: Showing a single ellipsoid placed in the bathtub (front face of bathtub removed for image)
Figure 3.12: Electrode signals recorded from the bathtub for mECG basis signals exciting the 3D-CD inside the single ellipsoid model
To represent the heart’s electrical activity, a 3D-CD is added at an off-centered location inside the ellipsoid. The strength of the 3D-CD is 10 mA-cm which is chosen after a thorough examination of literature (Refer to Table A.1 in Appendix A.2). The bathtub is tapped with probes at a finite number of points, particularly passive probes. Recorded bathtub potential distribution plots are shown in Fig. 3.11 and can be analyzed further with the help of MATLAB. Single ellipsoid model inside a bathtub can be visualized as seen in Fig. 3.12. The result of the potential distribution due to the activities of the 3D-CD on the single ellipsoidal phantom resting inside the bathtub are given in the following figures. Synthetic signals (Fig. 3.13 and Fig. 3.15) were applied as inputs to excite the 3D-CD, and the observed potential distribution which was recorded are displayed in Fig. 3.14 and Fig. 3.16 these distributions will be used in the computation of the sensing matrix.
Figure 3.14: Potential distribution recorded by the sensing probes on the inner surface of the bathtub for non-overlapping synthetic signals exciting the 3D-CD
3.4.3. Analysis of Double Ellipsoidal Phantom in Water Medium
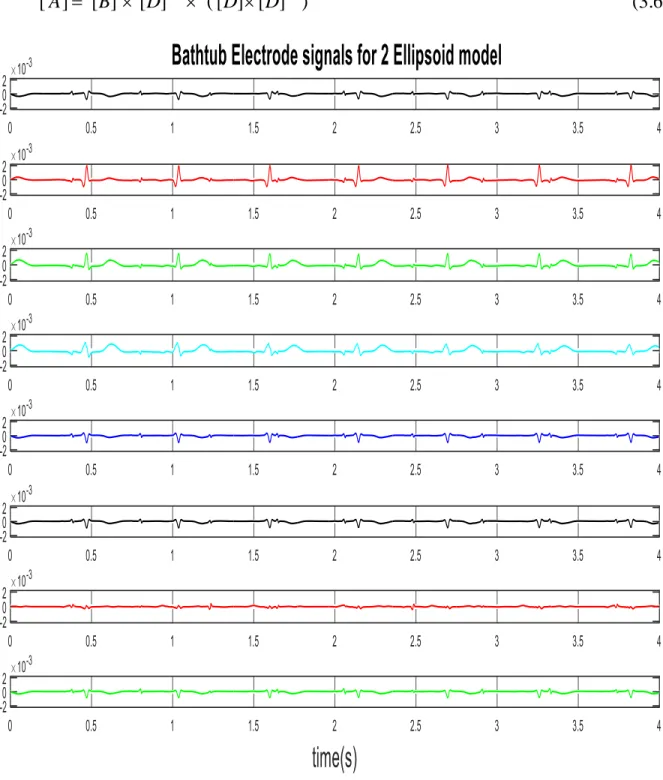
As an extended topic of this research, double ellipsoidal phantoms were employed (in approximately the dimensions of the torso of a pregnant subject) with the second smaller ellipsoid representing the fetus (or baby) both containing their own 3D-CD’s for the representation of the heart. The conductivity of the smaller ellipsoid is assumed to be 0.18 S/m, and the bigger ellipsoid is assumed to be 0.21 S/m and the dipole moment of the 3D-CD inside the smaller ellipsoid is 2 mA-cm, and the bigger ellipsoid has a 3D-CD having a dipole moment of 10 mA-cm. The setup
Figure 3.16: Potential distribution recorded by the sensing probes on the inner surface of the bathtub for overlapping synthetic signals exciting the 3D-CD
of these two ellipsoids inside the bathtub is shown in Fig. 3.17. In this case, the potential distribution due to the activity of the 3D-CDs is captured at a finite number of points, specifically at the passive probes on the inner surface of the bathtub, which act as sensing system. The plot in Fig 3.18 represents the activity of two 3D-CDs in the bathtub ellipsoid model. The simulation is performed for a total span of 4 seconds; the sampling interval is 4 ms, which results in 1000 points of ECG data; note the sampling frequency is 250Hz. The results which are obtained through the COMSOL simulation for the three cases, (a) 3D-CD inside a bathtub, (b) one 3D-CD inside an Ellipsoidal phantom laying inside the bathtub, and (c) two 3D-CD’s inside two ellipsoidal phantoms laying inside the bathtub can be used in the next section to extract the Sensing matrix for representing the characteristics of the 3D-CD.
3.5. Extraction of Sensing Matrix (Section 3)
The potential distribution observed around the bathtub as seen through one of the three cases mentioned in the previous subsection is the result of the transformation of the basis signals and can be represented by the following equation.
) 3.5 ( ] [ ] [ ] [ B A D
where the matrix B denotes the potential distribution on the inner surface of the bathtub at the electrode locations, D is the basis signals, and A is the sensing matrix.
The sensing matrix can be back extracted using
(3.6) 1 ) T ] [ ] [ ( T ] [ ] [ ] [A B D D D
For the purpose of verifying the sensing matrix found, basis signals and synthetic overlapping signals were used to excite the 3D-CD in the COMSOL models. The results from two cases are discussed in 3.5.1 and 3.5.2.
3.5.1. Case Study for Single Ellipsoidal Phantom in Water Medium
Two forms of synthetic signals, fECG and mECG basis signals were used to excite the 3D-CD in single ellipsoid model in the bathtub and it was noticed that the dominant dipole amongst the 3 orthogonal-dipoles was found to be the dipole oriented in the X-direction, the second highest dominance was from the Y-direction dipole and the least contribution was from the dipole oriented in the Z-direction. (Details on how dimensions of medium affect the potential distributions due to a dipole is given in Appendix B)
Figure 3.19: Non-overlapping synthetic signals acting as input to 3D-CD in one ellipsoid model and 8×3 sensing matrix extracted is shown on the right.
Figure 3.20: Overlapping synthetic signals acting as input to 3D-CD in one ellipsoid model and 8×3 sensing matrix extracted is shown on the right.
Figure 3.21: mECG basis signals acting as input to 3D-CD in one ellipsoid model and 8×3 sensing matrix extracted is shown on the right.
A comment can be made on the Sensing matrix which is obtained, the sensing matrix is of 8 x 3 dimension as the number of rows represents the number of passive sensing probes attached on the surface of the bathtub and the number of columns represents the 3D-CD basis signals. It can be inferred that the sensing matrix ‘A’ which is extracted with the help of bathtub electrode probes are almost the same when four different types of signals are exciting the 3D-CD. The maximum Normalized Root-Mean-Squared Difference (NRMSD) amongst the comparison of sensing matrix obtained from the four cases is found to be 0.026.
3.5.2. Case Study for Double Ellipsoidal Phantom in Water Medium
For this particular case, a smaller ellipsoid inside a bigger ellipsoid is present to represent the two ellipsoidal phantom model. Two different types of signals are used to excite 3D-CD inside each ellipsoid. The result for the case of synthetic signals and basis signals exciting the 3D-CD is
Figure 3.22: fECG basis signals acting as input to 3D-CD in one ellipsoid model and 8×3 sensing matrix extracted is shown on the right.
discussed below. A note almost similar to the case I is applicable here, the dominance of X-direction oriented dipoles are more than dipoles oriented in any other X-direction. Fig. 3.23 and Fig.
Figure 3.23: Two different types of synthetic signals exciting the two 3D-CDs inside two ellipsoids and 8×6 sensing matrix extracted is shown on the right.
Figure 3.24: Basis signals from fECG and mIECG (derived from mECG) exciting the two 3D-CDs inside two ellipsoids and 8×6 sensing matrix extracted is shown on the right.
3.24 give details on the type of signals used to excite each ellipsoidal phantom and the sensing matrix which was extracted from each case.
The NRMSD between the sensing matrices obtained is 0.032. From the two case studies which were discussed, it can be inferred that the concept of sensing matrix is valid.
3.6. Reconstruction of Basis Signals using Sensing Matrix (Section 4)
The sensing matrix which was extracted with the help of the bathtub signals can be reused to reconstruct the information about the 3D-CD signals using,
(3.7) ] [ T ] [ 1 -) ] [ T ] [ ( ] ˆ [D Α A A B
where ‘B’ is the potential distribution signals mapped by the sensing probes located at the inner surface of the bathtub, ‘A’ is the sensing matrix, and ‘D’ is the basis signals which is reconstructed. The Table (3.1) shows the NRMSE observed for reconstruction of different type of test signals which are used to excite the 3D-CD in the COMSOL model. A plot of reconstructed basis signal overlapping the original basis signal extracted is shown in Fig. 3.25
The original ECG signals ‘E’ can also be reconstructed as the intermediary transmission matrix R3 is known.
Table 3.1: NRMSE for reconstruction of different type of signals applied to the 3D-CD in COMSOL
3.8b) ( N 3 ] ˆ [ 3 m ] 3 [ N m ] ˆˆ [ 3.8a) ( N 3 ] [ 3 m ] 3 [ N m ] ˆ [ D R E D R E
The NRMSE observed in reconstructing the actual ECG data given in (3.8a) is found to be 0.039. Thus as a concluding remark on this chapter, can be said that extraction of the sensing matrix is possible, using which we can reconstruct the source signals of the 3D-CD.
A joint paper by the author and his major professor (Dr. V. K. Jain) is in preparation which largely subsumes the concepts discussed in this chapter.
Figure 3.25: Highly overlapping original basis signals and reconstructed basis signals; magnified sections are shown on the right.
CHAPTER 4: CONCLUSIONS
4.1. Conclusions
With emphasis on inversion and accurate reconstruction, this thesis has employed SVD decomposition and to estimate the time varying vector ECG dipoles and also reinvestigated, via simulation, an important method for unassisted ECG measurement in liquid media. On the surface of the container of that liquid are placed the sensing electrodes. Two case studies where single 3D-current dipole and double 3D-3D-current dipoles inside a single and double ellipsoidal phantom of dimensions resembling an adult torso and pregnant subject with fetus, respectively, were used to successfully extract the sensing matrix which is responsible for transforming the electrical activity of the heart into the potential distribution on the surface of the container. Using advanced simulation, this thesis has demonstrated that the 3D-CD signals could be successfully reconstructed using the sensing matrix and the outputs at the container leads from the simulation, and in turn using this information the original ECG data was reconstructed with low Normalized Root Mean Squared Error.
4.2. Future Work
The areas in which further investigation should be performed in the future are the following:
Experimental verification
Separation of mECG and fECG signals from the potential distribution recorded on the surface of the medium using Independent Component Analysis [57]-[59] or JadeR [60]
Theoretical investigation to estimate the potential distribution on the surface of the medium by a bioelectric source inside three conducting sub-regions.
REFERENCES
[1] Giffard-Roisin, S., Jackson, T., Fovargue, L., Lee, J., Delingette, H., Razavi, R., & Sermesant, M. (2016). Non-Invasive Personalisation of a Cardiac Electrophysiology Model from Body Surface Potential Mapping. IEEE Transactions on Biomedical Engineering.
[2] Pei, W., Zhang, H., Wang, Y., Guo, X., Xing, X., Huang, Y., & Chen, H. (2016). Skin-potential variation insensitive dry electrodes for ECG recording. IEEE Transactions on Biomedical Engineering.
[3] Yokus, M. A., & Jur, J. S. (2016). Fabric-based wearable dry electrodes for body surface biopotential recording. IEEE Transactions on Biomedical Engineering, 63(2), 423-430. [4] Freeman, D. K., Gatzke, R. D., Mallas, G., Chen, Y., & Brouse, C. J. (2015). Saturation of
the Right-Leg Drive Amplifier in Low-Voltage ECG Monitors. IEEE Transactions on Biomedical Engineering, 62(1), 323-330.
[5] Da He, D., Winokur, E. S., & Sodini, C. G. (2015). An ear-worn vital signs monitor. IEEE Transactions on Biomedical Engineering, 62(11), 2547-2552.
[6] Varon, C., Caicedo, A., Testelmans, D., Buyse, B., & Van Huffel, S. (2015). A novel algorithm for the automatic detection of sleep apnea from single-lead ECG. IEEE Transactions on Biomedical Engineering, 62(9), 2269-2278.
[7] Reyes, B. A., Posada-Quintero, H. F., Bales, J. R., Clement, A. L., Pins, G. D., Swiston, A., & Chon, K. H. (2014). Novel electrodes for underwater ECG monitoring. IEEE Transactions on Biomedical Engineering, 61(6), 1863-1876.
[8] Lim, K. M., Jeon, J. W., Gyeong, M. S., Hong, S. B., Ko, B. H., Bae, S. K., & Shim, E. B. (2013). Patient-specific identification of optimal ubiquitous electrocardiogram (U-ECG) placement using a three-dimensional model of cardiac electrophysiology. IEEE Transactions on Biomedical Engineering, 60(1), 245-249.
[9] Lin, B. S., Chou, W., Wang, H. Y., Huang, Y. J., & Pan, J. S. (2013). Development of novel non-contact electrodes for mobile electrocardiogram monitoring system. IEEE journal of translational engineering in health and medicine, 1, 1-8.
[10] Lee, J., Reyes, B. A., McManus, D. D., Maitas, O., & Chon, K. H. (2013). Atrial fibrillation detection using an iPhone 4S. IEEE Transactions on Biomedical Engineering, 60(1), 203-206.
[11] Wang, Y., Agrafioti, F., Hatzinakos, D., & Plataniotis, K. N. (2007). Analysis of human electrocardiogram for biometric recognition. EURASIP journal on Advances in Signal Processing, 2008(1), 148658.
[12] Pullan AJ, Cheng LK, Nash MP, Bradley CP, Paterson DJ. Noninvasive electrical imaging of the heart: theory and model development. Ann. Biomed. Eng. Oct.; 2001 29(10):817– 836. [PubMed:11764313]
[13] Huiskamp G, Greensite F. A new method for myocardial activation imaging. IEEE Trans. Biomed. Eng. Jun.; 1997 44(6):433–446. [PubMed: 9151476]
[14] Tilg B, Fischer G, Modre R, Hanser F, Messnarz B, Schocke M, Kremser C, Berger T, Hintringer F, Roithinger FX. Model-based imaging of cardiac electrical excitation in humans. IEEE Trans. Med. Imaging. Sep.; 2002 21(9):1031–1039. [PubMed: 12564871] Han et al. Page 10 IEEE Trans Med Imaging. Author manuscript; available in PMC 2009 November 1. NIH-PA Author Manuscript NIH-PA Author Manuscript NIH-PA Author Manuscript
[15] Greensite, F. Heart surface electrocardiographic inverse solutions. In: He, B., editor. Modeling and Imaging of Bioelectric Activity—Principles and Applications. Kluwer Academic/Plenum; New York: 2004. p. 119-160.
[16] Gulrajani RM, Roberge FA, Savard P. Moving dipole inverse ECG and EEG solutions. IEEE Trans. Biomed. Eng. Dec.; 1984 31(12):903–910. [PubMed: 6396217]
[17] Greensite F, Huiskamp G. An improved method for estimating epicardial potentials from the body surface. IEEE Trans. Biomed. Eng. Jan.; 1998 45(1):98–104. [PubMed: 9444844] [18] He B, Wu D. Imaging and Visualization of 3-D Cardiac Electric Activity. IEEE Trans. Inf.
Technol. Biomed. Sep.; 2001 5(3):181–186. [PubMed: 11550839]
[19] He B, Li G, Zhang X. Noninvasive three-dimensional activation time imaging of ventricular excitation by means of a heart-excitation-model. Phys. Med. Biol. Nov.; 2002 47(22):4063–078. [PubMed: 12476982]
[20] Zhang X, Ramachandra I, Liu Z, Muneer B, Pogwizd SM, He B. Noninvasive three-dimensional electrocardiographic imaging of ventricular activation sequence. Am. J. Physiol.-Heart Circul. Physiol. Dec.; 2005 289(6):H2724–H2732.
[21] Skipa O, Nalbach M, Sachse F, Werner C, Dössel O. Transmembrane potential reconstruction in anisotropic heart model. Int. J. Bioelectromagnetism. 2002; 4(2):17–18.
[22] Liu Z, Liu C, He B. Noninvasive reconstruction of three-dimensional ventricular activation sequence from the inverse solution of distributed equivalent current density. IEEE Trans. Med. Imaging. Oct.; 2006 25(10):1307–1318. [PubMed: 17024834]
[23] Celler, B. G., Lovell, N. H., & Basilakis, J. (2003). Using information technology to improve the management of chronic disease. Medical Journal of Australia, 179(5), 242-246.
[24] Gellis, Z. D., Kenaley, B., McGinty, J., Bardelli, E., Davitt, J., & Ten Have, T. (2012). Outcomes of a telehealth intervention for homebound older adults with heart or chronic respiratory failure: a randomized controlled trial. The Gerontologist, 52(4), 541-552. [25] Kvedar, J., Coye, M. J., & Everett, W. (2014). Connected health: a review of technologies
and strategies to improve patient care with telemedicine and telehealth. Health Affairs, 33(2), 194-199.
[26] R. C. Barr,M. Ramsey, III, and M. S. Spach, “Relating epicardial to body surface potential distributions by means of transfer coefficients based on geometry measurements,” IEEE Trans. Biomed. Eng., vol. BME-24, pp. 1–11, Jan. 1977
[27] R. D. Throne and L. G. Olson, “A generalized eigen system approach to the inverse problem of electrocardiography,” IEEE Trans. Biomed. Eng., vol. 41, pp. 592–600, June 1994
[28] Bishop, M. J., & Plank, G. (2011). Bidomain ECG simulations using an augmented monodomain model for the cardiac source. IEEE transactions on biomedical engineering, 58(8), 2297-2307.
[29] Kwatra, S. C., & Jain, V. K. (1986). A new technique for monitoring heart signals-part I: instrumentation design. IEEE transactions on biomedical engineering, (1), 35-41 and “A new technique for monitoring heart signals; Part II Orthogonal lead extraction,” pp. 1-10, IEEE Trans. on Biomedical Engineering, Vol. BME-33, January 1986.
[30] Frank, E. (1954). General theory of heart-vector projection. Circulation Research, 2(3), 258-270.
[31] Helmholtz, HV (1853). On some laws of the distribution of electric currents in physical conductors with application to the animal-electric experiments. Annals of Physics, 165 (6), 211-233.
[32] Schwan, H. P., & Kay, C. F. (1956). Specific resistance of body tissues. Circulation Research, 4(6), 664-670.
[33] Schwan, Herman P., and Calvin F. Kay. "Capacitive properties of body tissues." Circulation Research 5.4 (1957): 439-443.
[34] Geselowitz, D. B. (1973). Electric and magnetic field of the heart. Annual review of biophysics and bioengineering, 2(1), 37-64.
[35] Plonsey, R., & Barr, R. C. (2007). Bioelectricity: a quantitative approach. Springer Science & Business Media.
[36] Geselowitz, D. B. (1967). On bioelectric potentials in an inhomogeneous volume conductor. Biophysical journal, 7(1), 1.
[37] Geselowitz, D. B. (1960). Multipole representation for an equivalent cardiac generator. Proceedings of the IRE, 48(1), 75-79.
[38] Gabor, D., and C. V. Nelson. "Determination of the resultant dipole of the heart from measurements on the body surface." Journal of applied physics 25.4 (1954): 413-416. [39] Goldberger AL, Amaral LAN, Glass L, Hausdorff JM, Ivanov PCh, Mark RG, Mietus JE,
Moody GB, Peng CK, Stanley HE. PhysioBank, PhysioToolkit, and PhysioNet: Components of a New Research Resource for Complex Physiologic Signals. Circulation 101(23):e215-e220 [Circulation Electronic Pages; http://circ.ahajournals.org/content/101/23/e215.full]; 2000 (June 13). PMID: 10851218; doi: 10.1161/01.CIR.101.23.e215
[40] V. K. Jain, “ECG Feature Extraction and Its Application to Automated Prognosis,” Int. J. of Computer and Information Science, Vol. 2, pp. 231-247, September 1973.
[41] S. C. Kwatra and V. K. Jain, "Electrocardiogram via liquid media," Proc. AAMI llth Ann. Meeting, J. AAMI, Vol. 10, p. 60, Jan.-Feb. 1976.
[42] S. C. Kwatra and V. K. Jain, "Electrocardiogram from a Bathtub," Proc. San Diego Biomedical Symposium, pp. 433-441, February 1974.
[43] K. W. Watkinson, S. C. Kwatra, and V. K. Jain, "Electrocardiographic Studies on an Idealized Torso Model," IEEE Southeastcon, pp. P.5-1 to P.5-5, May 1973.
[44] V. K. Jain, "A Preliminary Basis for Automated Prognosis of Heat Disease," Proc. San Diego Biomedical Symp. -- Innovations in Biomedicine, pp. 63-71, February 1972. [45] V. K. Jain, "Prognosis from Time Loci of ECG Parameters," Proc. Hawaii Intntl. Conf.
Sys. Sc., Jan. 1972.
[46] S. C. Kwatra, "Electrocardiogram via liquid media: Instrumentation and Signal Processing," Ph.D. Dissertation, University of South Florida, 1975.
[47] K. W. Watkinson, "A study of ECG potentials on a laboratory torso model: prediction of heart location and orientation. Florida State University, 1971.
[48] Nelson, C. V., Hodgkin, B. C., & Gastonguay, P. R. (1975). Dipole moment of the hearts of various species. Annals of biomedical engineering, 3(3), 308.
[49] Nomura, M., Nakaya, Y., Miyoshi, Y., Wakatsuki, T., Saito, K., Bando, S., & Nakayasu, K. (1992). Single moving dipole obtained from magnetic field of the heart in patients with left ventricular hypertrophy. Clinical cardiology, 15(10), 752-758.
[50] Terry, F. H., Brody, D. A., Eddlemon, C. O., Cox, J. W., Keller, F. W., & Phillips, H. A. (1971). Dipole, quadripole, and octapole measurements in isolated beating heart preparations. IEEE Transactions on Biomedical Engineering, (2), 139-148.
[51] Fischmann, E. J., Barber, M. R., & Lehner, H. H. (1970). Effect of Torso Resistivity Variation on the Electrocardiograms of Children, Using a Grid Lead System. Circulation, 42(1), 171-179.
[52] Haberkorn, W., Steinhoff, U., Burghoff, M., Kosch, O., Morguet, A., & Koch, H. (2006). Pseudo current density maps of electrophysiological heart, nerve or brain function and their physical basis. Biomagnetic research and technology, 4(1), 5.
[53] Ellison, R. C., Fischmann, E. J., Miettinen, O. S., & Hugenholtz, P. G. (1969). Use of the dipole moment in the assessment of left ventricular hypertrophy. Circulation, 40(5), 719-730.
[54] Burch, G. E., & Winsor, T. (1960). A Primer of Electrocardiography. Academic Medicine, 35(9), 889.
[55] Pilkington, T. C., & Plonsey, R. (Eds.). (1982). Engineering contributions to biophysical electrocardiography. IEEE.
[56] COMSOL, A. (2011). COMSOL Multiphysics ver. 4.2 a. www.comsol.com. COMSOL AB, Stockholm, Sweden
[57] Hyvärinen, A., & Oja, E. (2000). Independent component analysis: algorithms and applications. Neural networks, 13(4), 411-430.
[58] Jain, V. K. (2006, May). Single cycle nonlinear VLSI cell for the ICA algorithm. In Acoustics, Speech and Signal Processing, 2006. ICASSP 2006 Proceedings. 2006 IEEE International Conference on (Vol. 3, pp. III-III). IEEE.
[59] Jain, V. K., Bhanja, S., Chapman, G. H., Doddannagari, L., & Nguyen, N. (2005, March). A parallel architecture for the ICA algorithm: DSP plane of a 3-D heterogeneous sensor. In Acoustics, Speech, and Signal Processing, 2005. Proceedings.(ICASSP'05). IEEE International Conference on (Vol. 5, pp. v-77). IEEE.
[60] Camargo-Olivares, J. L., Martín-Clemente, R., Hornillo-Mellado, S., Elena, M. M., & Román, I. (2011). The maternal abdominal ECG as input to MICA in the fetal ECG extraction problem. IEEE Signal Processing Letters, 18(3), 161-164.