i
Time Management in Projects:
Tools, Techniques and Methods
Department of Production and Quality Engineering
TPK4520 Specialization Project
Submitted By: Bikram Nepal
Student No. 746460
Candidate No. 10014
Supervisor: Nils Olsson
i Acknowledgement
This report is an outcome of sincere contribution of many people to my effort, and I would like to recognize them.
First of all I would like to thank "Department of Quality and Production Engineering", "Speed-Up Project Team" for giving us this opportunity to do this report. I am pleased to present this report "Time Management in Project: Tools Techniques and Methods". I want to express my sincere gratitude towards my supervisor Nils Olsson for his kind support, guidance and encouragement for the completion of this project. I want to express my thankfulness to Siva and Agnar Johansen whose suggestions guided me for betterment of the report. I would like to thank my friends, family for their support and encouragement.
At last, i would like to extend my sincere thanks and earnest gratitude once more for all those who helped me in one way or other, in each and every step towards successful accomplishment of this report.
It is possible that some shortcomings and errors might have been left unnoticed while writing this report. So mistake indications and suggestions from the submitted department have been expected and they will be helpful for the further improvements in my skill.
ii
Preface
This report is the outcome of hard work and dedication during my third semester in NTNU. This report gives insight to the various time planning and scheduling tools and techniques being practiced in the field of project management. It also gives a overview of what different tools and methods are being used for project duration reduction. And lastly it attempts to give short description of how these tools can be used for finding possible opportunity for schedule compression. This report is based entirely upon the previous literatures regarding relevant topics and my understanding on those topics gained from these relevant literatures.
Through this entire process Professor Nils Olsson guided me as my Main supervisor along with researcher Siva helped me to make this report better with his suggestion .
iii
Abstract
Time is the most precious asset available to man which cannot be stored, recovered or transferred. Every human activities uses time, but time is limited in supply i.e. we have only 24 hour in a day, 7 days a week etc. So the supply of time is perfectly inelastic, and due to this nature of time , need for optimal utilization of time is imperative. Time being one of critical resource and one of vital determinant of project success has huge importance in modern business world. Being first in market, to gain competitive advantage, to reduce time dependent costs can be motivational factors for companies tries to compress the schedules. Need to reduce project duration is leading firms to continuously search for tools and techniques to do so. There are many scheduling techniques available as well as many tools for reducing project duration which are being practiced since long time before. But still data shows there are significant number of projects that exceeds the planned schedule. So it can be concluded that implementation of these tools and techniques alone , in isolation is not sufficient for gaining the benefits, it should be well supported by good management practices, competent personnel, good organizational culture, supporting management and committed owner.
iv
Table of Contents
Acknowledgement ... i Preface ... ii Abstract ... iii Table of Contents ... iv Table of Figure ... vi Chapter 1 ... 11.1 Background of the study ... 1
1.2 Problem Statements ... 3
1.3 Limitation of the study ... 3
1.4 Methodology ... 4
Chapter 2 ... 5
2.1 Introduction ... 5
2.1.1 Activity Definition: ... 5
2.1.2 Activity Sequencing ... 6
Precedence Diagramming Method (PDM)... 6
Arrow Diagramming Method (ADM) ... 7
2.1.3 Activity Resource Estimating ... 8
2.1.4 Activity Duration Estimating ... 8
2.1.5 Schedule Development ... 9
2.1.6 Schedule Control ... 9
Chapter 3 ... 10
3.1 Different Scheduling Tools and Techniques ... 10
3.1.1 Gantt Chart ... 11
3.1.2 Critical Path Method ... 12
3.1.3 PERT ... 14
3.1.4 Critical Chain Method ... 16
3.1.5 Last Planner ... 18
3.1.6 Simulation Based Scheduling ... 21
3.1.6.1 Monte Carlo Simulation (MCS) ... 21
3.1.6.2 MCS applied to PERT... 22
3.1.6.3 Graphical Evaluation and Review Techniques (GERT) ... 23
v
3.1.7 Project Management Software ... 26
3.1.7.1 MS Project ... 28
3.1.7.2 Primavera ... 29
3.1.7.3 Safran ... 29
Chapter 4 ... 31
4.0 Project Duration Reduction Techniques ... 31
4.1 Overlapping or Fast-tracking ... 31
4.2 Project Crashing ... 33
4.3 Buffer Management ... 33
4.4 Modularity and Prefabrication ... 34
4.5 Just in Time approach ... 35
4.6 Lean Construction ... 35
4.7 Lean Design ... 36
Chapter 5 ... 38
Discussion ... 38
5.1 Search for possibility to reduce durations. ... 38
5.2 User Experience ... 40 Conclusion ... 44 References ... 47 Apendix 1 ... 52 Appendix 2 ... 53 Appendix 3 ... 54
vi
Table of Figure
Figure 1 Example AON representation ...6
Figure 2 Example AOA representation ...7
Figure 3 Example Gantt Chart ...11
Figure 5 Structures of schedules ...17
Figure 4 Multiplying effect of multitasking ...17
Figure 6 Last Planner System ...20
Figure 7 Deterministic and probabilistic branching ...23
Figure 8 Looping in GERT ...24
Figure 9 Concepts of concurrent engineering ...32
1
Chapter 1
1.1 Background of the study
Time is the most precious asset available to man (Kohn, 2000) which cannot be stored, recovered or transferred (Adebisi, 2012). Every human activities uses time, but time is limited in supply i.e. we have only 24 hour in a day, 7 days a week etc. So the supply of time is perfectly inelastic, and due to this nature of time , need for optimal utilization of time is imperative (Odumeru) 2013. Time management is the act or process of planning and exercising conscious control over the amount of time spent on specific activities, especially to increase effectiveness, efficiency or productivity (Buck, Lee et al. 2000).
Time is one of most critical resource in projects. It is also one of vital success criteria for every kind of projects. Time management in projects involves processes required to accomplish timely completion of projects (PMI 2004). PM BOK identifies following 6 steps as key processes for project time management (PMI 2004 ).
1. Activity Definition 2. Activity Sequencing
3. Activity Resource Estimating 4. Activity Duration Estimating 5. Schedule Development 6. Schedule Control
Different tools, techniques and frameworks had been developed to carry out these processes efficiently and effectively. From the range of tools and techniques one have to choose the tools that best fits for the organization and type of projects. In this background this study will discuss some of these important tools and techniques and basic principles behind them.
2 Nowadays the importance of planning and executing project faster is growing more and more. Driving forces for this growth in importance of time factor can be, being first to market, to achieve a competitive edge through faster accomplishments of projects or reducing time dependent costs of projects. Another benefit can be increased income, due to the attractiveness caused by the organization's ability to have shorter execution time. Even from a social perspective and an owner/user perspective, there is a huge interest, naturally, to accomplish the projects faster. So it is desirable to dig out possibilities to reduce duration of project. In this context this study attempts to discuss how these tools and techniques can be used to find possibilities to reduce the project duration.
3
1.2 Problem Statements
To become faster is the essence for survival and growth of firms in modern business world. This study will try to look upon different time planning tools and principles. It also tries to find out if yes, how can these tools and techniques can be used to search for any possibilities in reduction of project duration. This study will also attempt to discuss various tools and frameworks developed to reduce project duration . Basically this study will try to find answers for following three research questions:
1. What are the different principles, tools and techniques for time planning and scheduling in projects?
2. How different tools and techniques of time planning can be used to search for possibilities to reduce project duration?
3. What are the existing tools and frameworks for reduction of project duration?
1.3 Limitation of the study
As this study was carried out in short time period, this study is limited to some of widely used tools and techniques of time planning only, which were plentifully described in the accessed literatures. None of the literature selected, exclusively discussed the user experience regarding use of different tools ,techniques and different PM software. So the user experience section of the discussion is limited to few tools and techniques only. Another barrier was that there were not so much literature regarding the principles behind the PM software. So the writer have to rely on the information provided in the software's webpage.
4
1.4 Methodology
The objective of this report was to identify different scheduling tools and techniques and to find how they can be used for project duration reduction along with the different practices which are being used in order to reduce the project duration. To achieve these objectives first an extensive literature review was carried out. Descriptive keywords like CPM, Gantt Chart, PERT, GERT, Simvision, Last Planner, Time Management, Scheduling, Critical Chain, Project duration reduction, overlapping, simulation, PM Software, and various others key words were used to search for resources. These key words were used in various databases to search for relevant journal articles, research papers and other resources. Databases like, Science Direct, Elsevier, Research Gate, IEEE, Jstor, JCEM and PMJ were used to search for relevant resources. Apart from these some relevant book , few websites and web documents were also used in the process. There was wealth of information available regarding the topics discussed in this report as they are well established practices. Abstract of each paper was read and only relevant resources were sorted. And these literature formed the base for the development of body of knowledge on the intended scope of the study.
After reviewing these selected resources, different tools and techniques being practiced for time planning and project duration reduction were identified and were presented in the theory part and some of them were described briefly. Different aspect of those identified time planning tools were analyzed in order to find out if they can be used to search for possibility for project duration reduction and were discussed in discussion part of the report and those results were summarized in the conclusion of the study.
Six key processes for time management in projects as identified by PMI (2004) was taken as point of departure with prime focus on Activity scheduling.
5
Chapter 2
2.1 Introduction
Time being one of critical resource and one of vital determinant of project success has huge importance in modern business world. "A project is a temporary endeavor undertaken to create a unique product, service, or result" (Sun 2004). Projects by definition are time bound activities i.e. it have a definite beginning and definite end point. For undertaking any tasks, there are certain activities to be performed or certain steps to be followed, and these activities should be performed on certain sequence. To get task done, it is necessary to determine in advance what activities are to be performed and when they should be done.
Oxford Dictionary defines the term Scheduling as "A plan for carrying out process or procedure, giving lists of intended events and times". According to pinto, project scheduling represents the conversion of project goals into an achievable methodology for their completion. He further elaborates , It creates a timetable and reveals the network logic that relates project activities to each other in a coherent fashion (Pinto 2007). Scheduling determines, when every single activities should be performed in order to finish the project on time (Rolstadaas 2008).
Project Scheduling is also a vital element of project planning and subsequent monitoring and control (Pinto 2007). Rolstadaas distinguishes planning and scheduling as, planning is about deciding what activities to do while scheduling is all about deciding when they should be done (Rolstadaas 2008).
Schedule development process needs information regarding, what activities are to be performed, how long it takes to perform these activities, what resources in what quantity will be required , and how these activities interact with each other i.e. dependencies among activities (Sun 2004).
2.1.1 Activity Definition:
It involves identifying the specific schedule activities that need to be performed to produce the various project deliverables (Sun 2004). It will identify the deliverables at lowest levels of work breakdown structures called work packages. A work package is the set of work items requiring resources to be executed (Rolstadaas 2008). These work packages are further decomposed into smaller components called schedule activities. This decomposition provides basis for estimating,
6 scheduling , executing and monitoring and controlling the project work(Sun 2004). As output of this process and activity list is produced.
2.1.2 Activity Sequencing
It involves identifying and documenting dependencies among schedule activities. it brings in surface what logical relationship do these activities share with each other (Sun 2004). It identifies in what sequence these activities should be executed based upon dependencies among different schedule activities , to achieve the planned project deliverables.
There are two methods for schedule activities sequencing they are Precedence Diagramming Method (PDM)
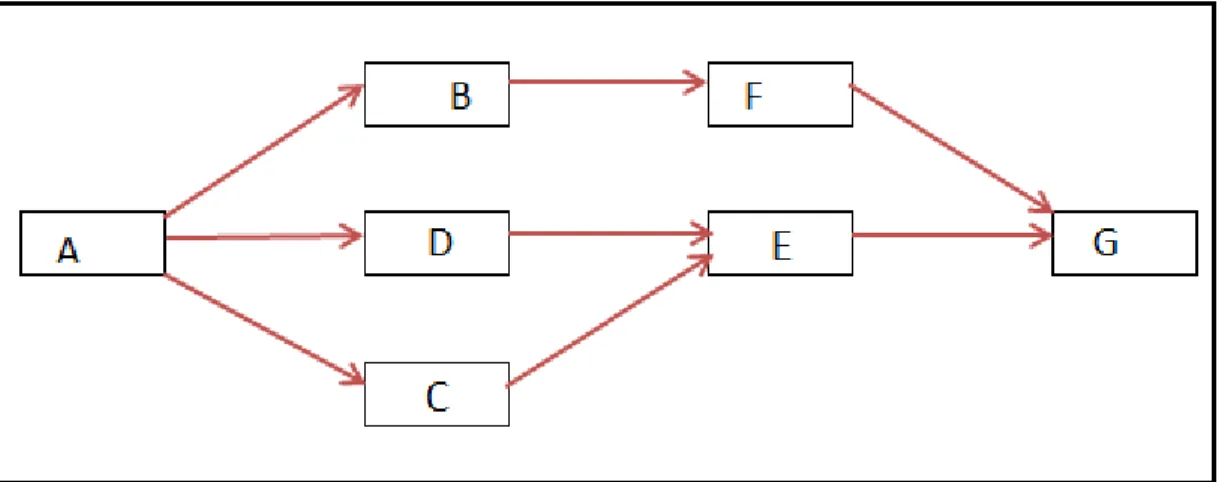
Precedence Diagramming Method (PDM) also called as Activity on Node (AON) is a method of constructing a project schedule network diagram that uses boxes or rectangles, referred to as nodes, to represent activities and connects them with arrows that show the logical relationship that exist between them (Sun 2004) . Arrows only represent precedence relationships and events are not shown in this representation of network. This method is used by most of the project management software packages. Figure 1 shows a simple representation of AON network.
Figure 1 Example AON representation
Finish to start, start to start, start to finish and finish to finish are four basic precedence relationship that may exist in a network.
7
Arrow Diagramming Method (ADM)
Another method of schedule activities sequencing is Arrow Diagramming Method (ADM) also called as Activities on Arrows method (AOA). In this method activities are mapped on arcs and nodes represents events. Arrows are used to represent activities and connects them at nodes to show their relationship. As compared to PDM it is less prevalent.
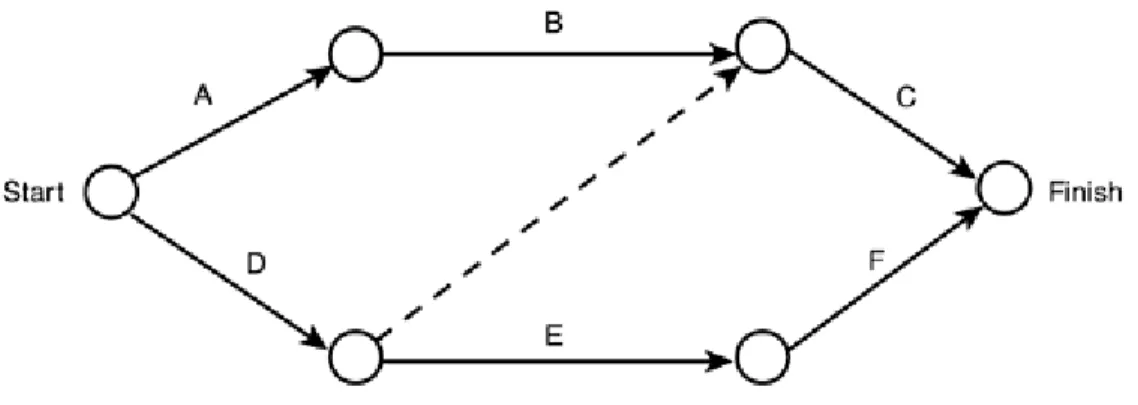
Figure 2 Example AOA representation
It only uses finish to start dependencies and may require the use of dummy relationships called dummy activities for showing all relationship more correctly. Dummy activities are not actual activities and they do not consume any time, they just show relationship between different activities and they are represented by dotted lines. Figure 2 shows an example of simple AOA representation.
Both ADM and PDM diagramming are intended to do the same thing, create a sequential logic for all activities with a project. They both can be used to determine project's duration, slack activities and critical path. AON format is used in most of project management software packages such as MS project, Primavera, and ProTrack and with increasing use of computer based project scheduling, they are increasingly using AON format. As activities are placed in nodes and arrows are used just to show relationships it simplifies the network labeling and makes the AON network easy to read and comprehend (Pinto 2007). But in large projects with large number of activities, paths and node connections, when multiple project activities bursts and merges, AON network often becomes complex and difficult to read. On the other hand, AOA
8 format is used widely in certain business fields such as construction and also in large and complex projects, it is easier to employ the path process used in AOA method (Pinto 2007). It is also well accepted in the projects having significant milestones. One of disadvantage of AOA network representation is use of dummy activities it makes the network complex and relatively hard to understand. As both arrows and nodes are filled with important project information making the network more information intensive.
2.1.3 Activity Resource Estimating
Each schedule activities consume resources and the need for resources should be quantified prior the execution of those activities. The amount and the types of resources required for activities is estimated in this step. As the resources allocated for the activity determines the duration for that activity, one should have clear understanding of resource allocation, in order to accurately manage the project time.
2.1.4 Activity Duration Estimating
Estimate Activity Durations is the process of approximating the number of work periods needed to complete individual activities with estimated resources (Sun 2004). This is one of the key steps in the project time management processes. As it directly affects the total project activity durations this process should be carried out with high accuracy. This activity requires information regarding scope of activity, required resource types, estimated resource quantities, and resource calendars (Sun 2004). Activity duration estimation process approximate the number of work periods (activity duration) required to complete the activity from information regarding amount of work effort required to complete the activity and quantity of resources to be applied on that activity. Once the activity duration estimates are done one can calculate total project duration and by analyzing the network can identify critical path. This is one of key inputs for the project time management.
The basic inputs (i.e. time, cost and resources for each activity) are not deterministic and are affected by various sources of uncertainty. Uniqueness(no similar experience) , variability (trade- off between performance measures like time, cost and quality) and ambiguity (lack of clarity, lack of data, lack of structure and bias in estimates) are main source of uncertainty in project planning (Khodakarami, Fenton et al. 2007).
9 Tools and techniques used to estimate activity duration such as expert judgment, analogous estimating and parametric estimating assumes the activity duration to be deterministic and hence do not address uncertainty. Three point estimates, on the other hand incorporates uncertainty in a restricted sense, by using probability distribution for each activity (Khodakarami, Fenton et al. 2007). This concept originated with the PERT technique. Instead of giving one deterministic value, it approximates three different values i.e. optimistic (best case), most likely (based on realistic expectation of availability of resources, dependencies) and pessimistic(worst case) and calculates Start and finish dates and critical paths by applying probability rules. Duration estimates based on these three estimates gives more accurate duration and it also clarifies the range of uncertainty in duration estimates.
2.1.5 Schedule Development
Schedule Development is the process of analyzing activity sequences, durations, resource requirements, and schedule constraints to create the project schedule (Sun 2004). After completing this process, it determines the planned start and finish dates of project activities and milestones. Schedule development process may require review and revision of activities duration estimates and resource estimates to optimize tradeoff between time, cost and resources. It gives baseline to track progress. In order to maintain realistic schedule it is revised and reviewed continuously as the project progresses.
It takes information regarding activity sequence, activity duration and resource allocation for each activity in order to create an accurate schedule. For the purpose of developing schedule there are many software packages, such as Ms Project, Primavera, Protrack etc.. These tools helps to develop reliable and accurate project schedules. As part of the schedule, Gantt chart is also developed in order to visually monitor the activities and the milestones.
2.1.6 Schedule Control
Schedule Control is the process of monitoring the status of the project to update project progress and manage changes to the schedule baseline (Sun 2004). This process deals with, determining the status of project schedule, determining different factors that cause changes, and managing changes.
10
Chapter 3
3.1 Different Scheduling Tools and Techniques
There are large numbers of Tools and Methodologies available in project management practice for project scheduling. Some of them identified from literature are:
1 Gantt Chart
2 Arrow Diagramming Method (ADM)
3 Precedence Diagramming Method (PDM)
4 Critical Path Method (CPM)
5 Graphical Path Method (GPM)
6 Project Review and Evaluation Techniques (PERT) 7 Graphical Evaluation and Review Techniques (GERT) 8 Q-Graphical Evaluation and Review Techniques (Q-GERT) 9 Critical Chain Project Management (CCPM)
10 Successive Scheduling Process (SSP) 11 Line of Balance Method
12 Linear Scheduling Method 13 Repetitive Scheduling Method 14 Project Management Software 15 Simulation Techniques 16 Last Planner System
There can be more tools, techniques and methodologies for project scheduling than as mentioned above but due to various limitations all of them cannot be mentioned here. Some of the tools techniques and methodologies are described below.
11
3.1.1 Gantt Chart
A Gantt chart is one of common and popular way of showing activities/ tasks/ events against time. It is named after an American engineer Henry Gantt, who modified the chart which was first devised by a Polish engineer Karol Adamiecki during mid 1890s (What is Gantt Chart?, (2012)). Gantt charts were primarily used as production planning tool used to plan and manage batch production in manufacturing industries (Wilson 2003) and became popular in project management much later.
Gantt charts establish a time-phased network, which links project activities to a project schedule baseline(Pinto 2007).
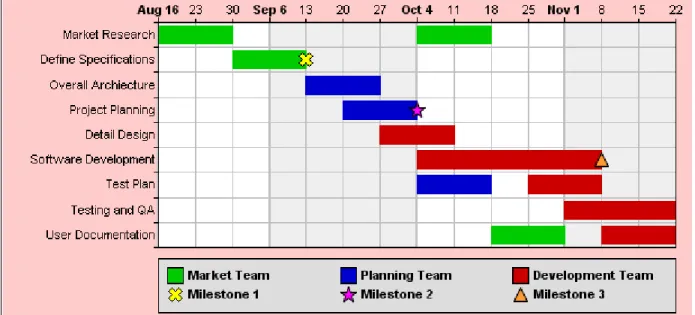
Figure 3 Example Gantt Chart
Activities list are placed along the vertical axis while the horizontal axis shows the time and duration. Each activity is represented by a horizontal bar and the position and length of the bar indicates the start date, duration and end date of the activity. This allows to see different information at a glance, like , various activities, starting date and end date of each activities, duration of activities, where activities overlap with other activities and by how much and the start and end date of whole project. It can be used for progress control as well. By setting up a vertical line on today's date one can observe what activities are on, behind or ahead of schedule.
12 Sometimes different color are used to signify important time issues such as activity criticality, slack, in progress, completed etc.(Wilson 2003).
One of advantage of Gantt chart is its simplicity i.e. it is easy to create, read and understand and it communicates well even with persons not familiar with schedules. But it is unable to show precedence relationship between activities this inability is somehow solved with introduction of linked Gantt chart which uses vertical lines to show precedence relationships between activities (Rolstadaas 2008). They identify the project network coupled with its schedule baseline i.e. Gantt chart is linked to real time information so that all schedule activities have more than just early start, early finish, late start late finish and float attached to them(Pinto 2007). Another advantage of using Gantt chart is that it is useful for identifying resource needs and assigning resources to tasks (Pinto 2007).
Before world leaped in its technological advancement, Gantt charts were prepared laboriously by hand, and whenever there are changes on project it was necessary to amend or redraw the chart. This limited its usefulness, as continual change being feature of projects (What is Gantt Chart? 2012). But with the advent of computers and project management software's , Gantt charts can be created updated and printed easily.
With technological advancement, and advent of network methods, Gantt charts has evolved as complimentary method for project planning and management (Wilson 2003). Nowadays Gantt chart are used for tracking schedules of projects as well as it shows some important information, for example how far the tasks has progressed, what resources are being used for each task etc.
3.1.2 Critical Path Method
The Critical Path Method (CPM) is a schedule network analysis technique developed by the DuPont Corporation in 1957. CPM is a deterministic technique that, by use of a network of dependencies between tasks and given deterministic values for task durations, calculates the longest path in the network called the ‘critical path’ (Khodakarami, Fenton et al. 2007). The length of the ‘Critical Path’ is the earliest time for project completion. CPM calculates for each activity, how quickly the task can be accomplished i.e. early start and finish dates of each activity by performing forward pass analysis. Once all these dates have been calculated, the
13 finish date of project can also be determined. With this known finish date, CPM then calculates how slowly each task can be accomplished i.e. late start and late finish dates for each activity. CPM does not takes into consideration any resource limitation for this calculation (Sun 2004). The resulting early and late start and finish dates are not necessarily the project schedule , rather they indicate time periods within which the schedule activity should be scheduled, given activity durations, logical relationships, leads, lags and other known constraints. (PMI, 2004).
CPM calculation requires information about , list of activities, all precedence relationships and estimated duration of each activity. Critical path analysis determines project finish date and which activities can influence the total project duration i.e. activities on critical paths.
CPM models the activities and events of a project as a network. Forward pass and backward pass calculations determines the early and late starts and early and late finish dates for each activity. Time between early start and late start or early finish and late finish of an activity gives the slack for that activity. Slack is amount of time that activity can be delayed from its earliest start or earliest finish dates without affecting the total project durations. The path from start to finish of the project on which none of activity have slack is the critical path for the project, any delay in any of these critical activities delays the project. There may be more than one critical path in a network. In order to accelerate the project total time required for activities in the critical paths should be reduced.
CPM provides a graphical view of the project, it predicts total project duration and also identifies which activities are critical in maintaining the schedule. Identification of critical activities and paths helps management to optimize resource allocation and also identifies which tasks can be delayed for a while if resource needs to be reallocated to catch up on missed tasks (MindTools 2004). Often root cause of project overruns is failure to identify factors that have potential to affect the activity (Stelth, Le Roy et al. 2009). As CPM encourages all members in the project team to evaluate and identify the requirements of the every project activities and its successor and predecessors in a critical and logical fashion, it helps to draw true and more accurate picture of processes involved and their time and cost. Identification of slack and float enables project manager to maneuver different resources to best satisfy the project time and cost
14 goals. CPM also offers a form of documentation to organizations which can be used for upcoming similar projects in future (Stelth, Le Roy et al. 2009).
One of main disadvantage of CPM is that despite its ease to understand and use, it does not incorporate time variations that can have a great impact on the completion time of project. As back in 1950's CPM was designed for complex but fairly routine projects with minimum uncertainty in the project duration (Stelth, Le Roy et al. 2009), there is more uncertainty in project duration for less routine projects and this limits its usefulness. Another disadvantage is with the increase in scope and extent of projects, CPA process becomes more complicated. As every estimates are based upon some assumptions but in real life those assumption may or may not become true . So as the project progresses and as actual time may vary from estimated time for activities, new critical path may emerge at regular interval of time (Stelth, Le Roy et al. 2009). As critical path changes scheduling of personnel also changes and reallocation of personnel becomes quite tricky. CPA also does not take into account the learning curve for new members on the project or for activities that are new and unique to the project(Badiru 1995, Stelth, Le Roy et al. 2009).
According to De la Garza (2006), typical CPM models consider limited number of constraints: activities sequencing based on precedence requirements and resource availability as anticipated when planning and fails in providing the means to effectively deal with the real availability of resources and information. As a result, CPM methods become useful only for project preplanning or planning before execution but not during actual execution (de la Garza 2006)
3.1.3 PERT
Program Evaluation and Review Techniques, PERT was originated by the U.S. Navy in 1958 as a tool for scheduling the development of weapons systems (Malcolm, Roseboom et al. 1959, Cottrell 1999). This technique of scheduling assumes project to be an acyclic network of events and activities. (Cottrell 1999)
In CPM time estimates are assumed to be deterministic and hence does not incorporate uncertainties while PERT incorporates uncertainty in a restricted sense (Malcolm, Roseboom et al. 1959, Khodakarami, Fenton et al. 2007), by using a probability distribution for each task.
15 Instead of having a single deterministic value, three different estimates (pessimistic, optimistic and most likely) are approximated. Further calculations are performed using expected values and variations and other probabilities rules. Result from PERT calculations are more realistic than CPM (Moder 1988) . But the PERT computation utilize expected values of the hypothetical distributions of actual activity performance times and it utilizes the standard deviations of the distributions in computing a measure of the chances of meeting scheduled dates of project milestones (Moder, Phillips et al. 1983). As these optimistic, most likely and pessimistic values are based on judgments of person responsible rather than statistical sampling (Moder 1988) there exist a probability of biasness. Optimistic and pessimistic time estimates are 5 and 95 percentiles of the distribution of the time duration (Moder, Phillips et al. 1983)
The calculation of network is done in same way as in deterministic network. Expected values are used as durations for calculations. Expected duration of total project is now calculated simply by adding all expected durations of activities on critical paths. The total project duration follows a statistical distribution, according to centre limit theorem if the no. of activity on critical path is not very less, total project duration's distribution may be approximated by normal distribution independent of distributions of individual activities (Rolstadaas 2008). So total project duration will have an expected value and variation and it follows normal distribution, this allows to calculate probability of finishing the project in given duration.
Main benefit of PERT is that it up to some extent tries to address uncertainty in activity duration estimates. But the activity time estimates are somewhat subjective and depend on judgment. In cases where there is little experience in performing an activity, the numbers may be only a guess. In other cases, if the person or group performing the activity estimates the time there may be bias in the estimate. Another limitation can be that it might be possible that alternate paths became critical which leads to underestimation of the project completion time. PERT considers only the critical path in computing project completion time probabilities and ignores near critical paths that posses significant probabilities of becoming critical(Cottrell 1999). It is also, important to note, that PERT deals only with the time constraints and does not include the quantity, quality and cost information desired in many projects; PERT should, therefore, be integrated with other methods of planning and control (Stelth, Le Roy et al. 2009) to get better result.
16
3.1.4 Critical Chain Method
Network scheduling techniques here are based on the assumption that there is unlimited resource available, but in reality it is not true. Every project are resource constraint. So the problem with network scheduling techniques is that we prepare schedule with an assumption of unlimited resources availability and try to adapt them in resource constraints (Rolstadaas 2008).
According to PMBOK Critical chain method is a schedule network analysis technique that modifies the project schedule to account for limited resources (Sun 2004). Critical Chain scheduling is based upon Theory of Constraints (TOC) introduced by Eliyahu Goldratt in his 1984 book titled The Goal. Goldratt adopted TOC to project management in his 1997 book Critical Chain. TOC is a common sense management philosophy that believes that in order to improve the performance of any system, one must first find the constraint of the system and then concentrate effort on elevating the capacity of the constraint (Cook 1998).
Goldratt claims that every duration estimates have safety time (a sufficient buffer) built into it (Cook 1998). This is mainly due to, existing incentives system(which trains worker to be on safe side) and common management practice of cutting all estimates across the board to squeeze a schedule into a given amount of time (Cook 1998). The problem with leaving small amounts of buffer time in each task estimate instead of aggregating it is that safety is often wasted at the beginning of the task period, not at the end where it is much needed (Cook 1998).
Goldratt identified three ways in which safety is often wasted i.e.
Student Syndrome
Student syndrome refers to the phenomenon that many people will start to fully devote themselves to a task just at the last possible moment before a deadline. Goldratt contends that when a resource is negotiated with certain time, it reevaluates it and start putting full effort when most likely time is remained. It leads to the waste of buffer built in the task estimates. and if something goes wrong here the schedule have very high chances to get delayed.
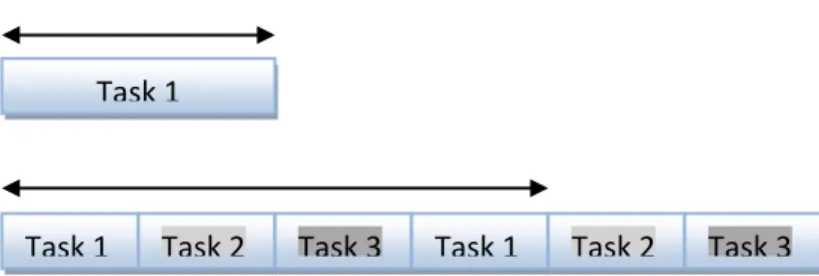
Multiplying effect of multi tasking
When a resource is assigned multiple tasks, it is experienced that in order to keep track of each task resource tends to perform all tasks partially according to their importance and does
17 remaining part later as shown in figure below. It shows that it took more time than if first task 1 was completed before starting task 2 and task 3.
Structures of Schedules
When multiple tasks merges to one point, delays are passed but gains are not (Cook 1998). For example consider a simple network with merging tasks as shown in figure below, if any of the task get delayed by few days whole project gets delayed but if let's say task 1 was finished within 3 days still the project will take same time. Even all three task are finished earlier than planned, due to use of schedules dates operator of task 4 may not be ready to start his task earlier than planned.
Figure 5 Structures of schedules
Instead of allowing each task to have some safety, critical chain method pull out all the safety in each individual task and assign them most likely time and aggregates all the safety at last of the project which act as overall project buffer (Cook 1998). Likewise it also provides required buffers at each point that a chain of dependent tasks not on the critical chain feeds into the critical chain called as feeder buffer. These duration buffers are not-work schedule activities to
Task 1 (7Days)
Task 2 (7Days)
Task 3 (7Days)
Task 4 (3Days)
Task 1 Task 2 Task 3 Task 1 Task 2 Task 3 Task 1
18 manage uncertainty. Project buffer protect project finish date from slippage along the critical chain while Feeder buffer protects the critical chain from slippage along the feeding chains (Sun 2004). The size of the buffer is determined so that it can account for the uncertainty involved in the duration of the chain of dependent tasks leading up to that buffer. Once the buffer schedule activities are determined, the planned activities are scheduled to their latest possible planned start and finish dates unlike CPM (Sun 2004).
In critical chain scheduling , overall variance of the critical chain will be much less than the addition of all the individuals because of random number aggregation theory (Cook 1998). In other words, the amount of protection necessary when you aggregate all of the tasks is much less than if you added the protection originally built into each estimate. Another benefit of CC scheduling is that as management controls the project by monitoring status of buffer, it allows proactive control of schedule. Through buffer management one get to know which feeder buffer is more consumed which helps to put more focus on that particular path. Critical chain scheduling helps to overcome, student syndrome and bad multi tasking. Some other advantages of CC over traditional CPM are that it allows faster completion of projects, elimination of multi-tasking and offers simple way of tracking and monitoring project progress(Sarkar 2012).
Some of limitations of CC scheduling as mentioned by Pinto (2007) are that, due to lack of milestones, it is problematic to coordinate schedule specially with external suppliers. Another limitation of CC method is that it demands corporate-wide cultural change to successfully implement CC scheduling which is not an easy task.
3.1.5 Last Planner
Lean construction institute defines last planner system as the collaborative, commitment-based planning system that integrates should-can-will-did planning (pull planning, make-ready look-ahead planning with constraint analysis, weekly work planning based upon reliable promises, and learning based upon analysis of PPC and Reasons for Variance (LCI 2014).
According to Ballard, Last Planner System is the philosophy, rules, procedures, and a set of tools that facilitates the implementation of shifting the focus of control from the workers to the flow of work that links them together and thus proactively managing the production process
19 (Ballard 2000). The system has two components: production unit control and work flow control. Production unit control makes progressively better assignments to direct workers through continuous learning and corrective action while function of work flow control is to proactively cause work to flow across production units in the best achievable sequence and rate (Ballard 2000).
Planning in construction projects are done in different level, places and time during the projects. The higher level of plans focus on overall objectives and constraints of entire projects, which helps in planning in lower level for means for achieving these objectives. And at the lowest level there are some persons or groups responsible for deciding what specific work is to be done tomorrow which drive direct work rather than production of other plans . Ballard called these plans at lowest levels, 'Assignments' and the person or groups that manages and controls assignments are called ' Last Planner' (Ballard 2000). The last planner system tries to fill the gap between planning between different levels through the collaboration of all responsible personnel while planning.
In LPS, master schedules are limited to phase milestones, special milestones, and long lead time items. Phase schedules are planned by the team who will do the work by using pull techniques - working backward from a target completion date, which causes the tasks to be defined and sequenced so that their completion releases work (Ballard and Howell 2003).
LPS begins with collaborative scheduling involving the main project suppliers from the beginning. It tries to optimize the use of Float by assigning float where it will best protect program integrity and predictability. As master schedules is prepared at the beginning of the projects, when there might not be enough information available for these schedules to be accurately detailed far into the future, short term plans called as Look Ahead Plans are prepared. Look ahead planning focuses team's attention on the short -term period. Before work starts, team leaders are responsible for making tasks ready and removing constraints so that it can be done when it should be. If it is missing some prerequisite the team are assigned with another tasks to avoid the production loss. This 'Make Ready' process continues throughout the project. Look ahead planning and make-ready process enables proactive problem solving which avoids production loss, rework and time overrun in the projects.
20
Figure 6 Last Planner System
There is a weekly work planning (WWP) meeting where all the last planners, design team leaders and or trade supervisors meet to explore inter-dependencies between tasks, to assume responsibility and give promises for the week to come by the performers. The agreed programs defines when tasks should be done and the last planners commit only when they are sure that the task can be done. After completing the task the last planner responsible for that particular task declares completion.
The key measure of the success of the Last Planner system is Percentage of Plan Completed (PPC) on time. PPC is a simple measure of the proportion of promises that are delivered on time, calculated as the number of activities that are completed as planned divided by the total number of planned activities. Reasons for the non completed tasks are identified and are registered weekly in WWP form so that improvement can be made in future performance . Percent Plan Complete (PPC) measures the extent to which the front line supervisor's commitment (WILL) was realized (Ballard 2000).
21
3.1.6 Simulation Based Scheduling
Despite the critical importance of project completion timeliness, scheduling practices discussed above remain inadequate for addressing the persistent problem of project completion delays due to inherent uncertainties. The uncertainty resides in activity duration estimates and unplanned upsetting events. In order to incorporate uncertainty in project activity estimates various simulation techniques have been developed.
A simulation is the imitation of the operation of a real-world process or system over time (Banks 1998). Simulation involves generation of an artificial history of a system through repetitive experimentation. And through observation of that artificial history, one draws inferences concerning the different characteristics of the real system. With the rapid development in computer technology the use of simulation techniques in project management has gained substantial popularity.
Van Slyke introduced simulation as a method for the analysis of project networks in 1963 and introduced a term Activity criticality indices which he defines as " the probability that an activity will lie on a critical path"(Van Slyke 1963). According to Hebert ,simulation is very useful in estimating the value of certain time-related variables such as activity completion times, event realization times, and project duration, as well as criticality indices (Hebert 1979) ..
3.1.6.1 Monte Carlo Simulation (MCS)
Monte Carlo Simulations is a problem solving technique which is used to approximate the probability of certain outcomes by running multiple statistical sampling experiments or trial runs, called simulations, using random variable (Investopedia 2014). Monte Carlo analysis is a statistical modeling technique for evaluating the effects of various risk and other assumptions on the expected schedule or cost of a project (Cook 2001). It was first proposed for project scheduling in 1963 by Van Slyke (Van Slyke 1963) and with the improvement in computer technology, MCS rapidly became the dominant technique for handling uncertainty in project scheduling (Cook 2001). A survey by the Project Management Institute (PMI 1999) showed that nearly 20% of project management software packages support MCS.
22
3.1.6.2 MCS applied to PERT
Van Slyke proposed use of MCS in PERT system in order to improve the system so as to allow less restrictive mathematical assumptions to be made and extending the kinds of computational results that can be obtained (Van Slyke 1963). Moreover Van Slyke suggests this method can be used to check the validity of commonly used approximations as well.
In traditional PERT method the output does not depend on the structure of the activity duration distribution but only on their means and variances but with use of MCS it offers greater flexibility in using any distributions for activity like beta, triangular, normal, uniform or discrete in any sort of mix (Van Slyke 1963).
The idea of MCS is that we establish a set of stochastic variables and events. Then we establish deterministic relations between these variables and the events, e.g. the order of which activities are executed. The next idea in the Monte Carlo simulation is to generate the uniform distributed stochastic variables on the interval 0 to1 and the events (indicator variables). By using these stochastic variables in the deterministic model we now get one realization of the system, or more specific the project duration. Now, we might repeat the process by generating another set of random quantities and insert these into the deterministic model to yield another project duration. By repeating this process we could think of the large numbers of generated values as realizations of the project, and use the values to obtain statistical properties such as the mean, the standard deviation, the cumulative distribution function etc. Van Slyke also introduced a new measure called Criticality Index which he defined as probability of an activity to be in critical path. Criticality index is calculated by dividing the number of times an activity is on critical path by total no. of simulation run. This measures helps in identifying near critical activities so that management can pour their focus on such activities as well (Cook 2001).
Deterministic network insures that no precedence constraints will be violated during the analysis i.e. project models is not actually simulated when "simulation" is used to generate estimates for the project variables of interest (Hebert 1979). Another limitation of this type of simulation analysis is that it is typically conducted exclusively during the planning stage, while useful for planning purposes, the resulting information quickly becomes obsolete once the project itself gets underway and proceeds toward completion (Hebert
23 1979). So it is recommended that as the project progresses and one any of the activity is realized, it should be performed again with real data available and schedules should be updated continuously.
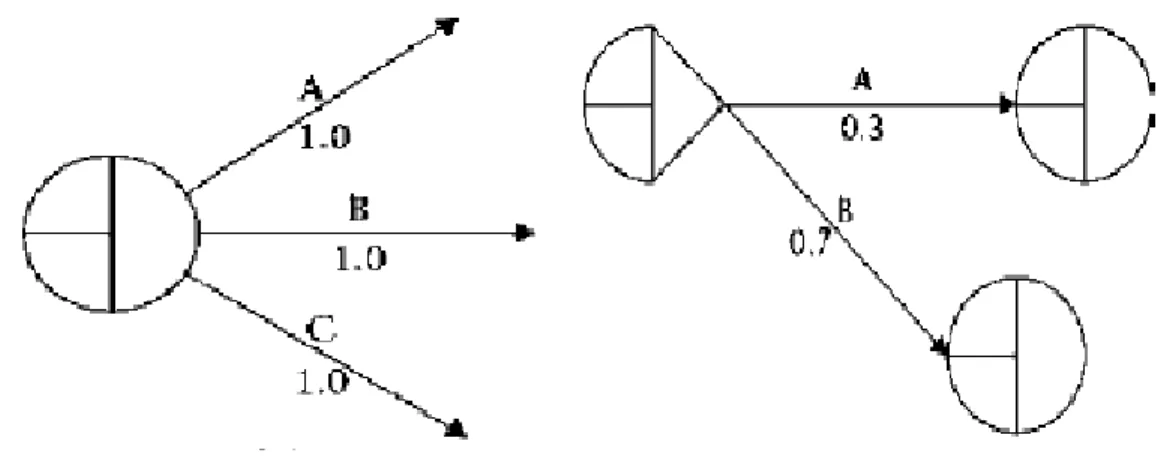
3.1.6.3 Graphical Evaluation and Review Techniques (GERT)
GERT, an acronym for Graphical Evaluation and Review Technique, is a procedure for the study of stochastic networks composed of EXCLUSIVE- OR, INCLUSIVE-OR and AND nodes (vertices) and multi parameter branches (transmittances or edges) (Pritsker 1966). GERT was developed to handle stochastic network structure (network with activities that have probability of occurrence associated with them and time to perform activity is a random variable). According to Pritsker (1966) , in GERT branches of the network are described with two (or more) parameters i.e. one, probability that the branch is traversed and time duration. Therefore it allows for conditional and probabilistic treatment of logical relationships.
As shown in figure 5, deterministic branching all activities leaving the nodes are considered. But in probabilistic branching as shown in figure 6, only one branch is considered at a time but the sum of probabilities all possible branches is always 100%.
Figure 7 Deterministic and probabilistic branching
Another benefits of GERT scheduling is it is capable of handling iterative activities which CPM and PERT both do not allow.
24
Figure 8 Looping in GERT
For example, as shown in figure 5(c) above there are three possible outcomes following activity A: activity B (with 30% probability), activity C (with 50% probability), or activity D (repeat of activity A, with 20% probability).
As described by Pritsker (1966) after collecting data and describing branches of network, one-branch equivalent function between nodes is obtained and this equivalent function is converted into two performance measures of the network, i.e. (1) the probability that a specific node is realized and (2) The moment generating function (MGF) of the time associated with an equivalent network, afterwards inferences concerning the system under study are made from the information obtained.
The GERT approach addresses the majority of the limitations associated with PERT/ CPM technique. GERT also allows loops between tasks which makes it able to include iterative activities in network. The main drawback associated with the GERT technique is that it requires complex simulation tools to model GERT system, which is one of main reason that it is only popular in academic field not in industries and projects.
3.1.6.4 Simvision
SimVision is an advanced simulation methodology and software, based on Stanford’s 20-year “Virtual Design Team” research program. It is an agent-based model that simulates the information processing demand vs. information processing capacity of project organizations engaged in complex and fast-paced, semi-routine, project-based work (Levitt 2012).
25 SimVision applies and extends the information processing framework (Galbraith 1974) and the computational approach of Cyert and March's pioneering "Behavioral Theory of the Firm." (Palazzolo, Ghate et al. 2002). The basic premise of Simvision methodology is that organization behavior emerges from the decisions and actions of individual actors as they process information associated with activities, and as they create and respond to requests for information (Palazzolo, Ghate et al. 2002). In this view, an organization is an information-processing and communication system, structured to achieve a specific set of tasks, and composed of limited teams (called “actors”) that process information (Galbraith 1974).
Unlike CPM activity model, this model takes into consideration various aspect of organization that can affect the project outputs. The CPM method assumes that the only work that will occur is the direct work involved in each task while in reality there exist some hidden works in form of communication , waiting, rework etc. While fast tracking the project, more tasks are overlapped, which causes, more exceptions to occur, and thus the more coordination and rework is required and these hidden works prolongs tasks, delays others, and can have a knock-on, or even an exponentially slowing effect in a project (ePM 2006). Coordination and rework arising from overlapping tasks, and the resulting indirect work can be modeled in Simvision and is factored in to the overall schedule (ePM 2006). The model explicitly shows predicted coordination and rework with green and red links between interdependent tasks.
After adding all the data (staff positions, their skills, activities to be performed, milestones, cost, etc.) it is ready to simulate baseline case of the project. Most frequently, the simulated end date will be unacceptably late (ePM 2006) so one can focus on reducing these times without compromising on quality of output. Afterwards the durations of individual tasks on the project’s Gantt chart can be compared to their CPM-planned durations. It also distinctly shows which task are more risky for being delayed than planned, due to extra time taken up by coordination, rework, wait time, and meetings. This makes easy to identify task which needs more attention easily (ePM 2006).
SimVision makes specific quantitative predictions not only about schedule, cost, and quality outcomes but schedule, cost and quality outcomes of alternative organizational configurations, including task assignments, reporting relationships, managers spans of control, workers and
26 managers skill levels, levels of centralization, formalization, and matrix strength, and team experience as well (Levitt, Thomsen et al. 1999, Levitt 2012).
Levitt (2012) asserts that it has been validated over more than a decade on hundreds of projects in construction, aerospace, consumer products, software development, semiconductors, and pharmaceuticals and is now in routine commercial use to design organizations for complex, fast-track engineering projects worldwide (Levitt 2012).
There are few limitations in simvision as identified by (Palazzolo, Ghate et al. 2002). One of the key limitation of SimVision is that it adopts the traditional view of Galbraith and others that “the hierarchy is the knowledge network" (Palazzolo, Ghate et al. 2002) and this “boss knows better” view of exception handling is clearly outdated for many kinds of latest work and needs to be extended. Another limitation is that formal and informal interactions are differentiated, as are interactions via different communication media. SimVision uses an abstract (skill type) x (skill level) characterization of knowledge (Palazzolo, Ghate et al. 2002). It does not differentiate cognition into different types of internal knowledge.
3.1.7 Project Management Software
With the rapid development in computer technology, the adoption and use of Project Management software have grown rapidly and it can be expected that it will continues to grow at a rapid pace. The main motivation behind this is the strong interest, professionals in this field have, in improving their performance by using available technology for better project planning and control (Ali, Anbari et al. 2008). There are significant numbers of PM software available with wide range of features, functionalities and prices. These software are aimed to facilitate the project management process as well as to assist project managers to solve problem related with project scheduling, monitoring, controlling and sharing information. As identified by Ali, Anbari et al. (2008) the choice of suitable PM software can depend upon various aspects like, ease of use, functionality, information quality, size of organization, project size, project complexity, and other user characteristics such as, level of education, training and experience.
The history of PM software dates back to 1960's since then the number of PM software have leaped to more than 500 in year 2000 (Meredith and Mantel Jr 2000) with varying capabilities
27 and prices. Second global survey on current state of project management maturity report shows that 77% of companies who participated in the survey use project management software (PWC 2007).
PM software tools are based on network techniques and reflect project chronology (PMI 1999) More explicitly, AON format is used in most of project management software packages such as MS project, Primavera, and ProTrack (Pinto 2007). These tools uses critical path analysis to determine the project completion time and the start and end dates for each activity (Ali, Anbari et al. 2008) . PM software tools automatically creates the project network, Gantt chart and finds the critical path upon entering all required inputs. If any of input is altered it automatically updates the whole network and subsequent calculations. Many project management tools provide “resources leveling” that detect conflicts in assigning workers to activities and allow rescheduling them to eliminate over allocation and inefficient usage of resources activity (Ali, Anbari et al. 2008). Lately developed software tools utilize internet to allow organization to manage concurrent projects in different physical locations.
Most of project management software packages delivers project information in form of a wide variety of graphics and tabular representation which provides immediate and easy access to critical data that can be used (Meredith and Mantel 2000). So development of different software tools have now made project scheduling job much easy and convenient. Software tools makes information sharing easy and convenient and creates possibility for enhanced collaboration. This also assists in tracking the status of the whole work , so that any modification needed can be taken care of readily. The project management software also allows managers to communicate with vendors and clients more efficiently and securely. Second global survey on current state of project management maturity report (PWC 2007) shows direct correlation between project management software usage and project performance. It also shows that among the highest performing projects, 87% use project management software, while only 13% do not. It also shows that more mature organizations are more likely to use PM software packages.
There is no doubt that use of different PM software packages one can save time spent in tedious paper and pen work to create schedules and plans. But one can make best out of implementation of PM software packages by selecting right software packages that addresses specificity of
28 projects. Ralph L. Kliem (2000) recommends following issues to consider before selecting software (Kliem 2000)
Customization—The ability to modify standard views and reports to meet specific requirements
Import/Export—The ability to use data generated by other packages, or to provide data to other packages in a compatible format.
Interface—How easy it is to navigate through the package.
Integration with third-party products—The compatibility of the package to work with other packages. Compatibility to allow add in tools.
Network capability—The capability to support a local area network environment.
Performance—The speed and reliability of the package.
Platform—The operating system supported.
Scalability—The ability to run on different types of machines.
Support—The services provided by the vendor.
Among myriad of available PM software tools few popular software packages to mention are Microsoft Project, Primavera, and Safran.
3.1.7.1 MS Project
Microsoft Project is a project management software program developed by Microsoft. It is designed to assist the project manager in developing a plan assigning resources to tasks, tracking progress, managing the budget, and analyzing workloads. The first commercial version of Project was released for DOS in 1984 and first Windows version was released in 1990. According to the second global survey on current state of project management maturity report, Microsoft Project is used more than any other brand of software. Almost 45% of the participating companies uses Microsoft Project which is more than twice than second most commonly used software (PWC 2007).
29 MS Project creates the schedules based on critical path analysis but with third party add on critical chain and event chain methodology can also be adopted (Wikipedia 2014). Output schedules can be visualized as Gantt charts and it allows for resource leveling as well. Another benefit is that it can recognize different positions of user i.e. different levels of user can have different access levels to projects and other data while custom objects such as calendars, tables, filters are shared globally by all user.
With the introduction of Microsoft Office Project Server and Microsoft Office Web Access it has extended its capabilities. Project Server stores project data in a central SQL based database and allows multiple independent projects to access a shared resource pool while Web Access allows users to access Project Server database across the world through internet. With release of newer version more and more tools for collaboration and reporting are being added (Essex 2010).
3.1.7.2 Primavera
Primavera is another well known PM software package available. Primavera was launched in 1983 by Primavera Systems Inc. and was acquired by Oracle Corporation in 2008. Since then different versions are launched with latest one Primavera P6. Primavera PM software packages are based on critical path analysis. It also provides a centralized database that allows to work simultaneously and with multiple users within the project. It allows access to extensive Gantt chart layouts, PERT layouts, Trace Logic, histogram, S-curves and Resource Loading Reports (Aramsoftwareconsultancy 2014) . It also offers other software for project-portfolio management, contract management etc.
Basically these software allows planning scheduling of complex and large projects as it claims to support 100000 activities and unlimited number of resources. It also have its own integrated Progress Reporting function so it does not requires any other add-inns for progress reporting.
3.1.7.3 Safran
It offers two tools for different sized projects. Safran Project is developed and designed to handle the demands of large and complex projects. Safran Planner is designed for companies and organizations with small – medium-sized projects. These software are also based on Critical Path Analysis method and uses Earned Value method for project monitoring and control. It also have capability to update and access data in real time. It also have filtering capability for progress
30 report development so applying such filters one can generate report of particular type (Projectcontrolonline 2014).
While all three software mentioned above use critical path analysis approach there are some software packages like Pro Chain Project Scheduling by Pro chain solution Inc. and PSNext by Sciforma Corporation that uses critical chain approach for scheduling.
31 Chapter 4
4.0 Project Duration Reduction Techniques
Another aim of this study is to discuss various existing tools and techniques for reduction of project duration, which will be discussed in the following section. This section will give an overview of literature for various project duration reduction techniques.
To become faster is the essence for survival and growth of firms in modern business world. From automotive industry to process industries and from information technology to e-commerce, businesses today rely on first-to-market product strategies to gain competitive advantages and increase profit margins (Hastak, Gokhale et al. 2008). Need to reduce project duration is leading firms to continuously search for tools and techniques to do so. In this context, actions responsible for speeding up the project can be aimed at reducing the time it takes to complete an individual activity (compression) or they can be aimed at reducing the overall project schedule through overlapping of sequential activities (Bogus, Molenaar et al. 2005).
Survey performed by Hastak, Gokhale et al. (2008) identified forty-six schedule reduction techniques and also identified CII's eight best practices used in industry. De la Garza and Hidrobo (2006) in their report have identified 32 management practice which possess capability to reduce overall length of the project, these practices are presented in appendix 3. This report will focus on schedule reduction techniques only. Following sections gives brief description of some of strategies and techniques identified to address schedule reduction needs of firms.
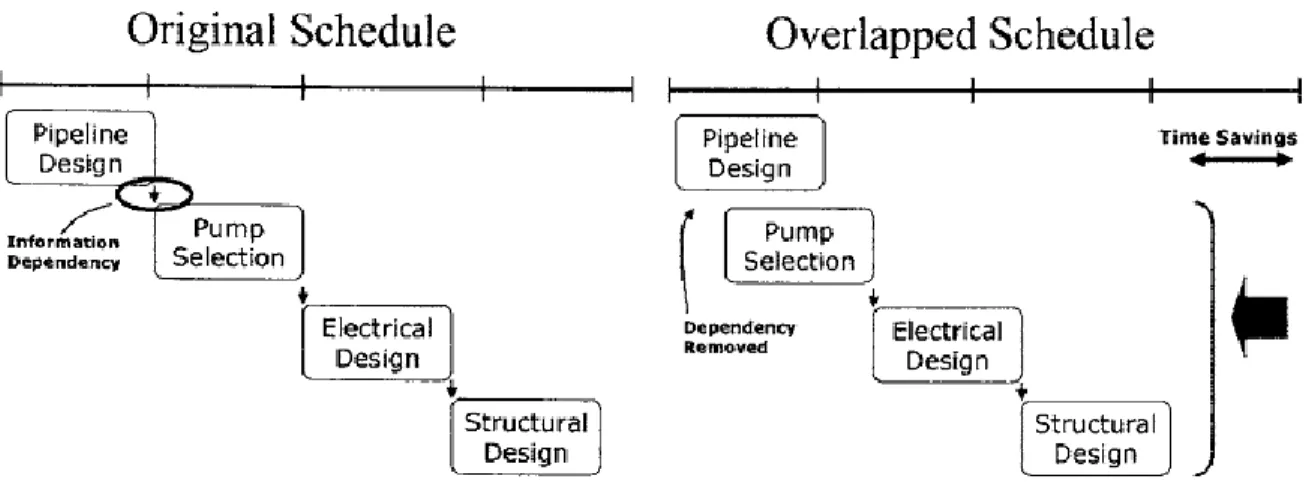
4.1 Overlapping or Fast-tracking
One common way of reducing project duration as suggested by Concurrent Engineering(CE) is to overlap project activities. Overlapping involves changing the precedence relationship between activities from start-to-finish to start-to-start or finish-to-finish with or without any lag, so that time can be saved for overall project. It involves overlapping of activities which are normally performed in sequential manner. A key to overlapping activities is management of the information transfer between activities (Bogus, Molenaar et al. 2005). Another important consideration for effective overlapping of activities is relationship between those activities (Prasad 1997). As mentioned by Bogus (2005) there are four types of possible relationship between activities i.e. dependent, semi-independent, independent and interdependent. Among
32 these four relationship , only independent activities can be overlapped without any risk of delay or rework (Bogus, Molenaar et al. 2005). Figure 2 shows removing the information dependency allows different activities to overlap reducing the overall project time.
Figure 9 Concepts of concurrent engineering
(Source: Bogus et al. 2005)
According to Bogus (2005), the extent to which activities can be effectively overlapped depends upon two factor i.e. natural rate of evolution of information of upstream activities and sensitivity of the downstream task to changes in upstream information.
The evolution and sensitivity characteristics of a task suggest appropriate strategies for achieving overlap (Bogus, Molenaar et al. 2005). So the ideal situation for overlap will be faster rate of information evolution with low sensitivity to changes in upstream activity information. In this situation both exchange of preliminary design information and early finalization of the upstream design information is recommended (referred to as distributive overlapping).
Evolution of information Sensitivity
Slow Fast
High Divisive Overlapping Preemptive Overlapping
Low Iterative Overlapping Distributive Overlapping
Figure 10 Different Overlapping Strategies
Bogus et al. (2005) recommends following strategies for different rate of information evolution and sensitivity as shown in figure 7 above.