to understand urban
fl
ows over the last mile
Yuanxuan Yang
⁎, Alison Heppenstall, Andy Turner, Alexis Comber
School of Geography, University of Leeds, Leeds LS2 9JT, UK
A R T I C L E I N F O Keywords: Dockless bikes Urban dynamics Spatial analysis Graph structure Transportation A B S T R A C T
The recent emergence of dockless bike sharing systems has resulted in new patterns of urban transport. Users can begin and end trips from their origin and destination locations rather than docking stations. Analysis of changes in the spatiotemporal availability of such bikes has the ability to provide insights into urban dynamics at afiner granularity than is possible through analysis of travel card or dock-based bike scheme data. This study analyses dockless bike sharing in Nanchang, China over a period when a new metro line came into operation. It uses spatial statistics and graph-based approaches to quantify changes in travel behaviours and generates previously unobtainable insights about urbanflow structures. Geostatistical analyses support understanding of large-scale changes in spatiotemporal travel behaviours and graph-based approaches allow changes in local travelflows between individual locations to be quantified and characterized. The results show how the new metro service boosted nearby bike demand, but with considerable spatial variation, and changed the spatiotemporal patterns of bike travel behaviour. The analysis also quantifies the evolution of travelflow structures, indicating the resilience of dockless bike schemes and their ability to adapt to changes in travel behaviours. More widely, this study demonstrates how an enhanced understanding of urban dynamics over the“last-mile”is supported by the analyses of dockless bike data. These allow changes in local spatiotemporal interdependencies between different transport systems to be evaluated, and support spatially detailed urban and transport planning. A number of areas of further work are identified to better to understand interdependencies between different transit system components.
1. Introduction
Cities are complex systems, composed of people, places,flows, and activities (Batty, 2013). Quantifying their dynamics, system inter-dependencies and spatial structures can characterise urban morphology and metabolism. People as physical carriers, drive theflows of mate-rials, money and information within urban spaces, and influence eco-nomic growth, social equity (Batty, 2013). Understanding the nature of theseflows provides perspectives and insights into how socioeconomic and environmental problems such as urban development, transporta-tion efficiency and air quality are being addressed (Borrego et al., 2006; Desouza & Flanery, 2013; Fishman, Washington, & Haworth, 2014; Gong, Lin, and Duan, 2017).
Travel data can be used as proxies for urban flows because they describe people's movement. Traditionally, such data were obtained from household travel surveys, with high cost and time overheads. Recent research has used automated mass transit fare-collection data (e.g. travel cards of bus and metro travel), which is cheap and has high
spatiotemporal granularity, to analyse urbanflows travel behaviours and mobility patterns. However, very little research has considered urban morphology and metabolism.Zhong, Arisona, Huang, Batty, and Schmitt (2014)used smart card data (bus and metro) and graph-based approaches to quantify the dynamics of urban structures through the analysis of spatial networks. This characterizes by medium-long tance travel but fails to reveal dynamics in local areas over short dis-tances. Some research has used cell phone data to detect urban travel flows and some aspects of urban structure (e.g. home-to-work com-muting structures) (Calabrese, Di Lorenzo, Liu, & Ratti, 2011; Louail et al., 2014), but this lacks spatial detail due to cellular positioning, with median errors of 599 m (Zandbergen, 2009). This results in large uncertainties when inferring people's movement over shorter distances. Thus, much previous work has examined broad scale urbanflows, but with little consideration of finer scale “capillary” flows. These are characterized by non-motorised trips (walking, cycling), and they have the capacity to reveal the nature of urbanflows over the“last-mile”.
This study examined dockless bike sharing data from Nanchang,
https://doi.org/10.1016/j.compenvurbsys.2019.101361
Received 11 March 2019; Received in revised form 30 May 2019; Accepted 2 July 2019 ⁎Corresponding author.
E-mail address:[email protected](Y. Yang).
0198-9715/ © 2019 The Authors. Published by Elsevier Ltd. This is an open access article under the CC BY license (http://creativecommons.org/licenses/BY/4.0/).
China over the period when a new metro line came into operation and compared“before”and“after”to reveal changes in travel behaviours, mobility patterns andflows over the last mile through spatiotemporal and graph-based analyses of dockless bike usage.
2. Background
Bike sharing schemes have become increasingly popular in recent years, reflecting their environment friendly, low cost and convenient nature. They are understudied, with research focused on cycling be-haviours associated with dock-based bike sharing schemes. Vogel, Greiser, and Mattfeld (2011)examined geographical clusters of docking stations using spatiotemporal usage. Others have identified bikefleet rebalancing strategies for different types of stations and quantified links between bike demand and land use (Daddio & Mcdonald, 2012; Jiménez, Nogal, Caulfield, & Pilla, 2016; Kaltenbrunner, Meza, Grivolla, Codina, & Banchs, 2010;O'Brien, Cheshire, & Batty, 2014).
However, bike sharing schemes can play important role in ex-amining the “first/last mile” problem. This is the distance between home/workplace and public transport that is too far to walk (Fishman, 2016; Saberi, Ghamami, Gu, Shojaei, & Fishman, 2018; Shaheen, Guzman, & Zhang, 2010), and bike schemes provide access to other forms of public transport and mass transit (train, metro, bus etc): they act as the“capillaries”for the mass transit aorta. The advent of dockless bike schemes opens up the opportunity to examine the last mile in detail.
To understand the last mile using bike data, the provision of other transport systems needs to be considered as well. Many studies have examined how cycling and metro trips are combined (Lin, Wang, & Feng, 2017; Martens, 2007), how this varies for different socio-eco-nomic groups (Zhao & Li, 2017), are affected by pricing (Lin et al., 2017) and has sought to quantify the interdependencies between bike sharing schemes and metro systems (Ding, Zhang, & Xie, 2019;El-Assi, Mahmoud, & Habib, 2017;Ma, Liu, & Erdoğan, 2015). Most of these studies have found a positive correlation between metro stations and bike sharing trips, but some have questioned this (e.g.Tran, Ovtracht, & D'arcier, 2015). Overall, these studies have focused on bike sharing preference, bike trip spatial clustering around other transportation hubs (metro, tramway and railway stations), and have ignored flows and structures in the last-mile. Examining the relationships between bike and transportation flows and structures can lead to deeper under-standing of urban dynamics. Saberi et al. (2018) analysed spatio-temporal statistics and network (graph structure) properties of bike sharing trips to examine the impact of metro strikes, identifying in-crease in bike use (numbers and trip distances). Chen et al. (2016) constructed a framework to predict the short-term over-demand periods for sharing bike station clusters considering of metro delay. Both studies used data from dock-based bike sharing schemes. These have a number of important shortcomings including service coverage (e.g. bikes may not available in the suburbs), docks may largely distanct from the ac-tual origin/destination (OD) and there can be dock capacity/avail-ability issues. Thus the inference derived from analyses of these data are limited.
The development of the IoT (Internet of Things) has the potential to revolutionise many aspects of our lives which are increasingly con-nected and sensed, generating large volumes of data with location and temporal attributes. In bike sharing schemes, dockless bikes emerged around 2015 and rapidly became a success in number of countries in-cluding China (iiMedia_Research, 2017;Xu et al., 2019). Unlike tradi-tional bike sharing schemes where bikes can only be borrowed and returned at docking stations, dockless schemes enable users to locate and borrow bicycles via a smartphone app, returning them to any sui-table public location. Dockless schemes allow convenience and fl ex-ibility for users. The smart lock system and GPS unit on the bikes not only facilitate scheme operation and bike management, but also create a large quantity of spatiotemporal individual level data. An advantage
over data from traditional dock-based bike sharing schemes, is that the flows captured by the data are more detailed (i.e. with higher spatial granularity) and better capture people's actual activities, travel de-mands and behaviours.
Dockless bike sharing studies are few and have focused on bikefleet management (Pal & Zhang, 2017), planning of related infrastructures (Bao, He, Ruan, Li, & Zheng, 2017), and bike distribution patterns (Liu, Shen, & Zhu, 2018).Liu et al. (2018) proposed combining a factor analysis and convolutional neural networks for inferring dockless sharing bike distribution in new cities. This work found these spatial distributions are correlated with nearby urban context, and change over time. Other studies (Ai et al., 2018;Xu et al., 2019;Yang, Heppenstall, Turner, & Comber, 2018) have shown that bike distribution is sig-nificantly time dependent, especially around metro stations, suggesting that dockless bikeflows and activities are highly dynamic.Zhang, Lin, and Mi (2019) developed a framework for planning geo-fences to constrain dockless bike parking. Clustering analysis and location-allo-cation models were applied to assess the implilocation-allo-cations of spatial plan-ning of geo-fences in different scenarios. While this framework in-corporated spatial detail, it lacked explanatory social and economic information, for example related to the cost of geo-fences and punish-ment/reward of parking bikes outside/inside geo-fences.Zhou, Ni, and Zhang (2018)used questionnaires to examine attitudes over the effects of dockless bikes on metro commuting. Their results showed a sig-nificant positive influence, especially for non-motorised vehicle owners and metro stations outside city centres and highlighted the positive role of such schemes in mass transit systems.
Analyses of data from dockless bike schemes have the capacity to provide high resolution insights into people's non-motorised mobility patterns and behaviours and to reveal their relationship with other urban structures and processes, for example flow networks in other mass transit system (e.g. metro), urban infrastructure development (e.g. new train stations, new bridge) and related urban updates. Critically such data allow such relationships to be examined dynamically over the last mile.
3. Study area and data 3.1. Study area
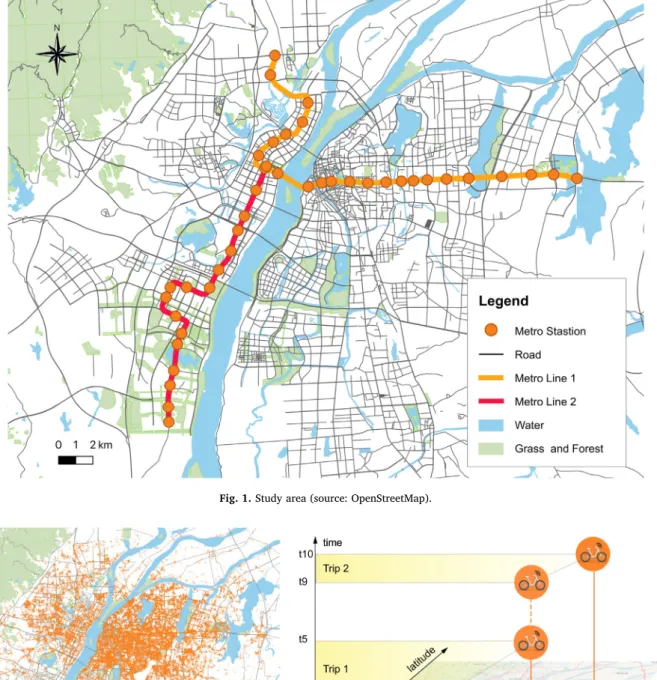
Nanchang in southeast China is the capital city of Jiangxi province with a population of 2.15 million. The city has a typical humid sub-tropical climate, characterized by hot and humid summers and mild winters. It has two metro lines as of September 2017. A new line of 17 stations, Metro Line 2, opened and started running on August 18, 2017. Fig. 1shows the transit map of Nanchang with the Gan river running through the city and the two metro lines. Other public transit systems include bus and dockless bike sharing. This study analysed data of around 80,000 dockless bikes from the Nanchang urban area around the time of the opening of Metro Line 2, specifically to compare bike usage“before”and“after”the opening of the new metro line. 3.2. Data description
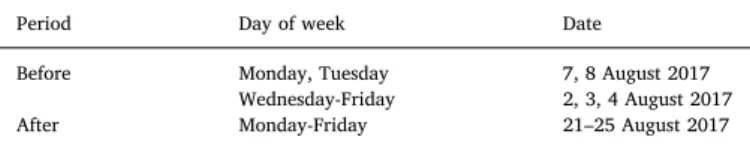
A program was set up to collect dockless bike availability data via the bike scheme API (application programming interface) for the month of August 2017. Queries to the API can return bike availability for any specified location (point) returning information on bike identifiers and their coordinates, with an in-built limit of the nearest 30 available bikes. The program iterated through the whole urban area collecting data on bike availability on a raster grid of 0.0015 degrees (length of sides equals to approximately 150 m). Most available bikes locations across Nanchang were captured approximately every four minutes due to the large urban area and the API query limits. There were some gaps in coverage due to bike GPS and communication unit signal receiving problems (e.g. GPS does not function well in tunnels). The data include
bike ID (identifier), coordinates and the timestamp information.Fig. 2 (a) shows a snapshot of dockless bike in Nanchang, with each point representing an available dockless bicycle.
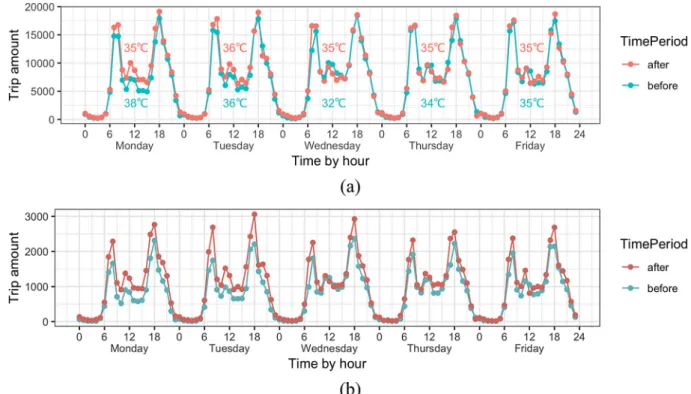
Extreme weather conditions have been found to have significant negative effects on cycling activity (El-Assi et al., 2017; Zhou et al., 2017). To ensure consistency across both time periods, only data from rain-free days were analysed, with weather data fromwunderground. com(one meteorological station, every 3 h), and although other con-ditions (e.g. air condition, temperature) may have minor impacts on bike usage, these were relatively consistent over the study periods. Data for 5 weekdays before and 5 weekdays after the opening of new metro line were selected for analysis, with all data collected in the same month and under the same general weather conditions in rain-free days. Table 1shows an example of the data collected andTable 2shows Fig. 1.Study area (source: OpenStreetMap).
Fig. 2.(a) Snapshot of dockless bike distribution; (b) detecting bike trips.
Table 1
Example of data records.
Time Bike ID Longitude Latitude 2017-08-07 13:35:29 7910***002 115.9190 28.61415 2017-08-07 13:35:29 7910***748 115.8367 28.78435 2017-08-07 13:35:29 7910***911 115.8369 28.78446
the dates of the data used in the analysis. Open Street Map data were also used to provide basic background mapping and road network data.
4. Methods
4.1. Detecting bike trips
The data provide snapshots of available dockless bike locations, bike identifier and timestamps. From the stacks of snapshots, it is possible to identify the changes in location of an individual bike and thus to derive dockless bike trip information. For this study, the threshold trip value was 100 m: if the change in location of an available bike between two timestamps exceeded this threshold, then the two records were linked as a trip, with the earlier one providing the origin coordinates, and the latter one the destination. It should be noted that this method is unable to identify round trips where the origin is close to destination.Fig. 2(b) shows an example trip. The bike changes its location from t1 to t5, which are combined to form a bike trip. It stays in the same place from t5 to t9 and is considered as available in this period. Similarly, a second trip can be identified from t9 to t10. The dockless bike sharing scheme also allows bikes to be scheduled (booked) in advance of 15 min, but this still allows trip origin and destination to be identified, although with a small impact on trip duration.
4.2. Constructing dockless bike mobility graph (network) structure Converting the bike data into a graph structure to representflows allows the changes arising from the introduction of a new metro line to be examined. Typically, any system composed of interconnected in-dividuals can be viewed as a graph (i.e. network) with individual components are represented by nodes (i.e. vertices) and their inter-connections by arcs or links (i.e. edges). Examples include online friendship networks, scientific collaboration networks and global air-line routes. In urban and transportation studies, bike sharing docking stations (Austwick, O'Brien, Strano, & Viana, 2013), bus stops and metro stations are typically viewed as nodes. If there is at least one trip between a pair of nodes (stations), then a link is generated between them. By representing the relationship between transportation nodes (e.g. bike/bus/metro stations) as travel flow links, mobility graph structures can be constructed. For example,Saberi et al. (2018)studied the dynamics of bike sharing networks in London, casting docking stations as graph nodes, andflows between stations as links. However, dockless bike sharing schemes provide greater spatial detail about the patterns of bike movements and therefore their riders than docking station data. Because bikes and bike trips are not aggregated over docking stations, constructing graphs of dockless trips requires different considerations.Fig. 3(a) shows an example of bike trip origins in an urban area. Instead of being located atfixed docking stations, they are more loosely distributed along roads, and sometimes clustered at cer-tain road segments.Fig. 2(a) also confirms that majority of the bikes are located close to roads, with few of them distant to the road network in the north and southeast. These are locations outside the Nanchang urban area, and distant from metro system.
This study uses road segments to aggregate bike locations and to cast them as vertices in a graph structure. The graph links represent trips originating from one road segment to another. Choosing the right spatial scale of aggregation is important because this can impose a
source of bias in spatial analysis (Openshow, 1979). Some research (Calabrese et al., 2011;Louail et al., 2014) using cell phone data to detect commuting flows in cities choose grid cells to aggregateflow origin and destinations with size varying from 500 m to 2 km. These scales may be useful for capturing work-home commutingflows and inferring coarse scale urban structure, but here the focus was on iden-tifying more spatially detailed structures in small areas requiring afiner spatial scale.Fig. 3(b) reveals that trip distances are commonly around 400 m and that 28% of trip O-D distance are < 500 m, with 1 km and 2 km distances corresponding to 60% and 85% or trips respectively. This indicates that aggregation scales between 500 m to 2 km may re-sult in important information loss. Here, road segments of 200 m were used to aggregate dockless bikeflows, since this distance captures >
96% of trips.
Fig. 4illustrates the process of casting bike trips to a graph using road networks segments as nodes. First, the Nanchang road network was split into segments based on road joins. Second, if a split segment was longer than 200 m, then was divided into smaller segments of equal distance, all < 200 m. Then, bike trip origin and destination were as-signed to the nearest road segment using ArcGIS 10.4. The result is that each trip has information about its origin and destination road segment, with a trip regarded as aflow from one node to another.
Dockless bike travelflows and the graph structures in the“before”
period (5 days) are shown in Fig. 5, using a spatial layout and a Fruchterman Reingold layout. Each node represents a short road seg-ment with the edge between any two nodes indicating travelflow be-tween them, and the network was trimmed using a threshold of at least 10 trips between two nodes, to improve the visualisation.Fig. 5 char-acterizes nodes degree (number of connections) using both shading and node size. Node degree in an urban mobility network represents the connectivity or accessibility to destinations or activities across the network. In this case study, bike travel is split by the river, with few links crossing it (Fig. 5a). Most of the trips are local, with the majority of the links connecting nearby areas (Fig. 5a), and the graph structure has a clear multi-core (multi cluster) spatial pattern. This is different to graph structures derived from other transportation modes such as metro and bus travel (e.g.Zhong et al., 2014) which tend to link different parts of city over longer distances. The Fruchterman Reingold layout (Fig. 5b) seeks to reduce the overlaps between nodes and maintain spatial topology. For example, two clusters of nodes presented inFig. 5 (c) and (d) are shown inFig. 5(e) and (f) respectively. The group of nodes in Fig. 5 (c) and (e) are dominated by 2 nodes connected to surrounded nodes with low degree, while Fig. 5 (d) and (f) suggest a group of more evenly connected nodes. The structures imply many different patterns of how people move around and use urban space. 5. Result and discussion
5.1. Spatiotemporal analysis 5.1.1. Temporal pattern
Temporal analysis of bike usage can reveal the dynamics in and characteristics of dockless bike sharing schemes.Fig. 6(a) shows the temporal travel patterns of dockless bike trips in Nanchang (whole study area) with the highest daily temperature. Trip amount is the count of trips starting at different times in hourly intervals. Over the two periods, bike usage shows a similar overall temporal pattern with some difference in trip numbers. There are two significant rush hours in each day, one from 07:00 lasting for two hours and another around 18:00, with hourly trip number reaching approximately 19,000. There is also a lunch time peak at 12:00. The trip amounts overlap with the exception of Monday at 12:00, when it is slightly lower, which is po-tentially due to the hotter weather (38 °C) than any other days (Fig. 6 (a)). The total trip amounts for the two periods is 838,464 and 892,764 respectively, an increase of 6.5%.
For the purposes of illustration Fig. 6 (b) defines service area Table 2
Date of collected data.
Period Day of week Date
Before Monday, Tuesday 7, 8 August 2017 Wednesday-Friday 2, 3, 4 August 2017 After Monday-Friday 21–25 August 2017
Fig. 3.(a) Examples of bike trip origin spatial distribution; (b) Dockless bike trip distance probability distribution.
Fig. 4.Diagram of creating graph nodes from road network.
Fig. 5.Dockless bike travelflows and graph structure of“before period”in (a) spatial layout; (b) Fruchterman Reingold layout, with detail in (c) to (f) as described in the text.
catchments of 2 km around new metro stations. Trip amounts in these catchmentss increased by 28.0% from 96,239 to 123,182. The highest rise was found in early morning with increases of 38.5%, 38.0% and 31.3% in the hour intervals from 06:00–09:00, respectively and another increase around 20:00 by 34.7%. The observations indicate that the largest bike trip amount increase occurs in the morning rush hour period, suggesting the popularity of trips using the new metro with dockless bike as a preferred travel mode during morning commuting.
5.1.2. Spatial pattern
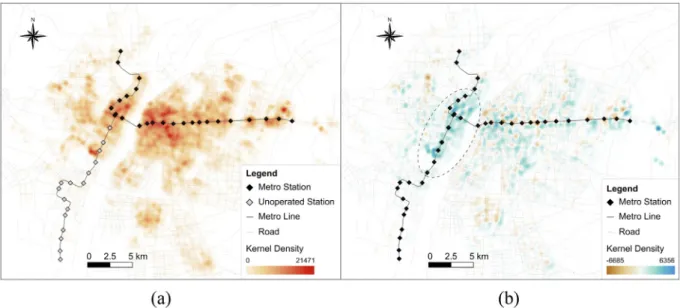
Dockless bike sharing scheme offersflexibility, efficiency, and low cost making it an attractive way tofill the gaps in the public transit system (such as bus and metro). Bike sharing travel has different spatial properties from other public transit modes, due to its non-motorised nature. For example, dockless bikes are not suitable for long distance travel, but they can be left immediately adjacent to the destination. Understanding the unique spatial pattern of dockless bike usage is important for scheme management (bike re-balancing) and the inter-dependence between metro and dockless bike system provides crucial information about local mobility. A spatial analysis (Pebesma, 2018) was conducted to examine the characteristics and dynamics of dockless bike sharing scheme in the study area.Fig. 7(a) shows the dockless bike trip kernel density across the city in the five weekdays of the before period based on trip origins. A KDE bandwidth of 118.2 m was de-termined as follows:: ⎜ ⎟ = ∗ ⎛ ⎝ ∗ ⎞ ⎠ ∗ −
band width 0.9 min SD, 1 D n
ln(2) m 0.2
(1) whereSDis the standard distance of the points spatial distribution,Dm
is the median distance, and n is the number of points. The KDE has a 100 m resolution.
The city centre from where most to trips originate, straddles both sides of the river,. It has the highest kernel density value (21,471 trips per km2). Several hubs can be also observed in the south away from city centre and the metro service.
Fig. 7 (b) shows the changes of kernel density estimation (KDE) between the two periods. The highlighted area inFig. 7(b) shows the
new metro service catchments west of the river. It shows a clustering pattern of increased density. By contrast, in other part of the city, areas of increase bike use are adjacent to or nearby to areas of decrease, suggesting an overall balanced and dynamic pattern. The observed spatial proximity between increase and decrease is due to the nature of dockless bike sharing scheme: people are able to pick up and park bikes at places of their choice when necessary subject to availability. The flexibility of travel in this way is demonstrated by heterogenous use patterns, especially atfine spatial scales.
To better understand the impact of new metro service on dockless bike sharing trips, a further statistical analysis was conducted to ex-amine the probability density of dockless bike origin/destination spatial distribution. Fig. 8 (a, b) illustrates the probability and cumulative probability of start and end distances from the newly opened metro stations.
By comparingFig. 8(a) and (b), a new peak at around 120 m in the
“after”period is observed, which suggests that more bike trips originate from or end at areas very close (around 120 m) to metro stations. This distance can also be understood as how far metro travellers are typi-cally prepared to go (walk) to get or leave bikes around their metro usage. Thefirst peak (Fig. 8a) decreases and reaches afloor around 220 m, indicating weakened spatial clustering of bike trips origins and destinations. This distance can be interpreted as the affordable (walking distance) limit between the metro station and the bike, and provides information to support the planning of related bike parking facilities, suggesting in this case an upper limit for the provision of bike parking areas around metro stations. The highest peak in the“before”period is located at around 800 m, but moves to 600 m in the“after” period (Fig. 8 a), suggesting the impact of the new metro stations on bike usage. The cumulative probability (Fig. 8b) indicates however that this impact is heterogeneous, with higher cumulative probability in areas at shorter distances to new metro stations in the“after”period.Figs. 7 and 8indicate the extent to which the areas closer to new metro stations experienced greater changes in daily dockless bike trips, in terms of distances people walked to get a bike and volume of trips.
Metro services not only change where people pick or park their bikes, but also influence local trip distance patterns. Building on the Fig. 6.Temporal pattern of dockless bike trips in (a) Nanchang city; (b) around new metro service catchments.
results inFig. 8(a), buffers of 250 m and 2,000 m around new metro stations were used to select bike trips with origin or destination within them. Trips that start or end in the 250 m buffer can be understood as
“last mile”trips, and trips in the 2,000 m buffer captureflows within the metro service catchment area, indicating changes over larger areas. The travel distance patterns were examined their distributions com-pared (Fig. 9).Fig. 9(a, c) indicates that bike trip counts increased significantly in both buffer zones and that the new metro service sti-mulated more trips regardless of travel distance.Fig. 9(b, d) describes the changes in probability distributions and indicates that trips with a travel distance of < 1,000 m are more likely to be made with the in-troduction of the new metro service and long distance trips (> 1,000 m) less likely.t-tests were used to confirm the difference in dockless bike trip distances in the two periods (Table 3) for the 2 trip types. The p-values in each case are < 0.0001, indicating the statistical significance of the observed reduction in trip distances with the introduction of the new metro line. Mean travel distance dropped from 1,178 m to 1,034 m
for“last mile” trips, and trips in the larger service areas around new metros (radius of 2,000 m) significantly decreased from 1,317 m to 1,150 m. Overall, the results suggest that new metro stations en-couraged increases in cycling activity but with reduced trip distances, indicating improvements in local mobility and access to transportation services.
5.2. Graph-based analysis
Interpreting the changes inflow networks is important for under-standing changes in mobility patterns and urban dynamics. Graph-based approaches were applied to quantify and compare the differences in the network structures. Firstly, two graph structures were con-structed based on bike travelflow data for the two periods according to the method described above. Only trips with their origin and destina-tion road segments in the 2,000 m buffers around metro stations were selected, as this was considered the maximum distance people would Fig. 7.(a) Kernel Density of dockless bike trips in“before period”; (b) Kernel Density difference of dockless bike trips in the two periods.
Fig. 8.(a) Probability density; and (b) accumulative probability of distance between dockless bike trip origin/destination and nearest new metro station in the two periods.
travel using the combination of dockless bike and metro.
5.2.1. Network statistical properties
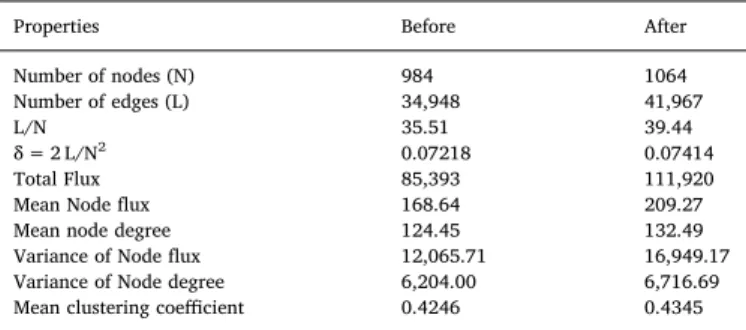
Table 4 shows the network properties in the new metro service catchments. From the table some changes between the 2 periods can be identified: the number of nodes increased from 984 to 1,064, and the number of edges increased from 34,948 to 41,967. Network con-nectivity,δ, representing graph structure resilience, also increased in-dicating the increased strength of the cycling network and its robust-ness to potential nodes failures, for example due to external disturbances such as a road closures. Node degree helps to evaluate the connectivity to and accessibility of destinations in a mobility graph (Zhong et al., 2014).Tables 5 and 6confirm the significance of the changes in node degree mean and variance, with the mean value in-creasing from 124.4 to 132.5.Fig. 10(a) shows the node degree dis-tributions between the two periods and, despite higher means and third quantiles, the first quantile and median are relatively unchanged,
Fig. 9.Distributions of dockless bike trip travel distance around new metro stations over the two periods: (a) Density distribution (buffer within 250 m); (b) Probability density (buffer within 250 m); (c) Density distribution (buffer within 2,000 m); (d) Probability density (buffer within 2,000 m).
Table 3
t-test for travel distance (m).
Buffer radius p-Value Mean value 95% confidence interval Before After Before After 250 < 0.000 1,178 1,034 1,059–1,297 865–1,203 2,000 < 0.000 1,317 1,150 1,160–1,473 973–1,327
Table 4
Graph properties in the two periods.
Properties Before After Number of nodes (N) 984 1064 Number of edges (L) 34,948 41,967 L/N 35.51 39.44 δ= 2 L/N2 0.07218 0.07414 Total Flux 85,393 111,920 Mean Nodeflux 168.64 209.27 Mean node degree 124.45 132.49 Variance of Nodeflux 12,065.71 16,949.17 Variance of Node degree 6,204.00 6,716.69 Mean clustering coefficient 0.4246 0.4345
Table 5
t-test for degree andflux.
Graph property p-value mean value 95% confidence interval before after before After Degree 0.024 124 132 120–129 128–137 Flux < 0.0001 167 209 162–175 201–217
Alternative hypothesis is true: both true difference in means of degree andflux are not equal to 0.
“ ” “ ” fl graph, the total amount of trips that start from or end at a node, can be used to understand trip volumes. The rises in both total and meanflux (Tables 4 and 5) indicate that the demand for dockless bikes in local areas increased. The nodeflux CDF (Cumulative Density Function) in Fig. 10(b) suggests there is higher probability of nodes with a larger flux. These changes describe the increased attractiveness of road ments, as well as their interaction strength in connection to other seg-ments in the network. The nodeflux variability (Table 4) increases in value indicating a more heterogeneous distribution of interaction strength across the network.Tables 5 and 6show thet-test and variance test results and confirm that observed changes are statistically sig-nificant. The clustering coefficient (Table 4) represents the extent to which nodes in a network tend to cluster (i.e. have links between them) (Saberi et al., 2018). Its average value shows an increase after the new metro opening, suggesting that the dockless bike trip network became
betweenness nodes increased, and therefore that the nodes with higher levels of connectedness have a more intensive role in the“after”graph. This describes the emergence of well-connected hubs.
PageRank is another indicator graph node importance. Generally, if the number of highly centred nodes (with very high PageRank) de-ceases while the number of secondary PageRank nodes increases, then this implies a polycentric changes. These suggest that the influence of strong centred nodes has gradually relaxed with their centrality in-creasingly shared with emerging subcentres (Zhong et al., 2014). Fig. 10(d) shows the CDF of PageRank, the“after”period exceeds the
“before”period at around 0.75 of the cumulative probability and in-dicates that nodes are more likely to have secondary high PageRank, suggesting underlying polycentric transformation. The next section re-inforces thisfinding by detecting community structures in graphs.
5.2.2. Community detection and graph structure
Communities in a dockless bicycle sharing network can be under-stood as a set of road segment clusters (graph subsets, or sub-graphs) that are more connected by trips internal to the cluster than external. This different in internal and external connects in clusters is measured by modularity (Newman & Girvan, 2004). A modularity maximization algorithm, the Louvain method (Blondel, Guillaume, Lambiotte, & Lefebvre, 2008), was applied to detect the communities in the dockless bike network. Modularity characterizes the density of edges inside potential communities relative to edges outside of the community. Networks with high modularity have dense connections between com-munity members but sparse connections with nodes in different com-munities. Optimizing this value theoretically results in the best possible segmentation of the nodes in a given graph structure. The Louvain methodfirstfinds small communities by optimizing modularity locally on all nodes, then each small community is grouped into one node and thefirst step is repeated, in an iterative way.
Fig. 11shows the different communities detected in the two periods using colour shades. Although the analysis does not include node (road segment) location, the communities are spatially coherent, suggesting considerable spatial structure in this network. The introduction of new metro station resulted in the emergence of new communities in the network (Fig. 11). One is located around the transfer station in the north, and another can be found near the centre of new network and demonstrates the impact of a new metro line on the structure of dockless cycling activities. Combined with the changes in other graph properties, it is possible to conclude that the new metro catchment area results in more bike trips and forms stronger local travel connections which are more polycentric.
Another important indicator graph structure is assortativity. This describes the tendency of high degree nodes (nodes with many edges), to connect to other high degree nodes. For example, the structures in Fig. 5(d) and (f) have higher assortativity than the structures ofFig. 5 (c) and (e). Structures with high assortativity are more robust to node removal or failure. Assortativity increased from 0.1832 to 0.2895 after the introduction of the new metro service along with a slight increase in
modularity, from 0.3236 to 0.3733. From a transportation perspective, the rise in the two indicators suggests that the new network alleviates congestion and enhances the efficiency of travel by non-motorised traffic (discussed inSun, Zhang, & Wu, 2012). Here, the evolution in graph structure shows a quick self-adaptive process that meets the in-creasing and changing patterns of travel demand and trafficflows, and strongly implies underlying urban resilience. Whether the performance of the network will deteriorate with future increases in network size or a dramatic rise in trip numbers, remains to be seen. From the per-spective of “urban metabolism”, the assortative structure suggests a robust spread and interaction of various urbanflows of information, capital and materials through non-motorised traffic, but may also pose future challenges, for example in the context of protecting against the spread of epidemics.
5.2.3. Flowmap
Afinal exploration of the changes in bikeflow throughflow maps is shown inFig. 12. This illustrates bike travel origin or destinations road segment in the 2,000 m buffers and the colour shades are used to in-dicate trip density between different road segments, connected by the directed links. Several important differences can be observed, especially areas close to the new metro stations. For example, Cuiyuanlu, Xuefu-dadaodong, Wolongshan and Guotizhongxin stations all show large changes inflows and structures. These stations resulted in many new outwardflows and regions of high trip destination density. Theflows
“i”and“ii”inFig. 12(a) suggest that bike users travel long distances from their origins to destinations in the“before”period, but theseflows disappeared in the“after”period (Fig. 12b). This is because travellers used the metro service instead of taking long-distance cycling trips, implying local mobility improvements. In the before period, there are many travelflows on the east of Yingtanjie Station (a large residential area). After the opening of the new metro service, more bike travel flows extended from and linked to Yingtanjie station, indicating that residents quickly changed their travel habits and started to combine dockless bikes trips with metro travel.
6. Conclusion
In order to capture the impact of metro service on the dockless bike sharing system, this study applied a combination of geo-statistical and graph theory approaches. The analyses led to an in-depth under-standing of the interaction and evolution of urban behaviours around non-motorised activity, by considering the changes in in the spatial patterns of dockless bike sharing as result of a new metro line. The new metro service increased nearby dockless bike sharing demand by 28%, and resulted in changes in other spatiotemporal patterns of travel be-haviours, including bike travel distance and bike origin-destination spatial distributions. The observed changes in travel were not homo-genous across the study area with greater impacts closer to new metro stations. The dynamics and evolution in the graph structure capture the urban resilience of dockless bike schemes who are able to adapt to in-frastructural changes such as new metro systems. Dockless bike trip structure has a tendency towards being polycentric (i.e. with more community structures), stronger local connectivity, higher assortativity reflecting increased travel demand and scheme robustness. This insight is not only useful for dockless bike schemes, but also provides a new perspective for the analysis on urban resilience and the inter-dependence between different urban complex systems. Observations fromflow maps can be used to indicate improvements in local mobility, and the speed of adaption by people to combine dockless bike for metro travels.
A number of policy and planning implications emerge from this study. First, it is important for bike sharing operators to prepare more bike fleets in the new metro service areas as demand will increase. Second, bike parking facilities need to be planned around metro sta-tions over distances up to approximately 220 m. Third, analysis of the changes in the origin-destination and network structure can help to reveal which locations (roads) are more frequently used by bike users, thus supporting related planning. Last, bikefleet rebalance strategies need be redesigned to adapt to changes offlows.
There are several limitations to this work. First, it used short road segments (< 200 m) to aggregate bike travel flows, which although selected through analysis, may be specific to this study. Second, the study analysed data from a limited number of days. Climate (rainy days in summer) and the timing of the school year (the new term starts in September) were the major reasons for excluding data in order to minimise the variance of environmental factors. The changes in bike travel behaviours and associatedflow structures could be confirmed if data for a longer period was available and through analysis of a similar case study area, with newly opened metro lines. Third, the data ac-quisition (section 3.2) procedure is only able to obtain information about the nearest 30 available bikes for each location, at each query. This potential data loss, if more bikes are available in that small area, introduces uncertainty into the analysis and results. Such shortcoming are commonly found in dockless bike sharing research (e.g.Ai et al., 2018;Liu et al., 2018;Shen, Zhang, & Zhao, 2018). However, since the Fig. 12.Flow maps of dockless sharing bike trips in new metro service catchment, (a)“Before”period; (b)“After”period.
data are consistent over the two periods, with similar sampling char-acteristics and uncertainties, thefindings from“before”and“after”the new metro line are comparable. Finally, although dockless bike data provide a better representation of non-motorised travel behaviour than cell phone data, there is an inherent sampling bias because not all city inhabitants will be cyclists or will use a bike sharing scheme. Future work will examine these issues further and will extend the analysis to integrate urban context, in order to develop a deeper understanding the implications of changes in spatiotemporal patterns and graph structure evolutions. It will also examine the long-term spatiotemporal effects of new metro stations on dockless bike sharing whose future patterns may change over time, as a result of deeper intergration of the two travel systems.
Acknowledgements
This study is supported and funded by University of Leeds and Chinese Scholarship Council (201606420071), the Natural Environment Research Council (NE/S009124/1) and the Economic and Social Research Council Alan Turing research fellowship (ES/R007918/ 1). We thank the anonymous reviewers whose comments and sugges-tions helped improve and clarify this manuscript. Part of the data and codes used in this analysis are openly available from University of Leeds open access data repository (https://doi.org/10.5518/619).
Declaration of interest
The authors declare that they have no competing interests.
References
Ai, Y., Li, Z., Gan, M., Zhang, Y., Yu, D., Chen, W., & Ju, Y. (2018). A deep learning approach on short-term spatiotemporal distribution forecasting of dockless bike-sharing system.Neural Computing and Applications,1–13.
Austwick, M. Z., O'Brien, O., Strano, E., & Viana, M. (2013). The structure of spatial networks and communities in bicycle sharing systems.PLoS One, 8(9), e74685.
Bao, J., He, T., Ruan, S., Li, Y., & Zheng, Y. (2017). Planning bike lanes based on sharing-bikes' trajectories.Proceedings proceedings of the 23rd ACM SIGKDD international conference on knowledge discovery and data mining(pp. 1377–1386). ACM.
Batty, M. (2013).The new science of cities.Cambridge, MA: MIT press.
Blondel, V. D., Guillaume, J.-L., Lambiotte, R., & Lefebvre, E. (2008). Fast unfolding of communities in large networks.Journal of Statistical Mechanics: Theory and Experiment, 2008(10), P10008.
Borrego, C., Martins, H., Tchepel, O., Salmim, L., Monteiro, A., & Miranda, A. I. (2006). How urban structure can affect city sustainability from an air quality perspective. Environmental Modelling & Software, 21(4), 461–467.
Calabrese, F., Di Lorenzo, G., Liu, L., & Ratti, C. (2011).Estimating Origin-Destinationflows using opportunistically collected mobile phone location data from one million users in Boston Metropolitan Area.
Chen, L., Zhang, D., Wang, L., Yang, D., Ma, X., Li, S., ... Jakubowicz, J. (2016). Dynamic cluster-based over-demand prediction in bike sharing systems.Proceedings proceedings of the 2016 ACM international joint conference on pervasive and ubiquitous computing (pp. 841–852). ACM.
Daddio, D. W., & Mcdonald, N. (2012).Maximizing bicycle sharing: An empirical analysis of capital bikeshare usage.University of North Carolina at Chapel Hill.
Desouza, K. C., & Flanery, T. H. (2013). Designing, planning, and managing resilient cities: A conceptual framework.Cities, 35, 89–99.
Ding, L., Zhang, K., & Xie, B. (2019). Exploring the effects of building environments on the use of bike sharing: Case study of Shenzhen, China.Proceedings of 2019 interna-tional conference on energy, power, environment and computer application(pp. 158–162). ICEPECA.
El-Assi, W., Mahmoud, M. S., & Habib, K. N. (2017). Effects of built environment and weather on bike sharing demand: A station level analysis of commercial bike sharing in Toronto.Transportation, 44(3), 589–613.
Fishman, E. (2016). Bikeshare: A review of recent literature.Transport Reviews, 36(1), 92–113.
Fishman, E., Washington, S., & Haworth, N. (2014). Bike share's impact on car use: Evidence from the United States, Great Britain, and Australia.Transportation Research
Part D: Transport and Environment, 31, 13–20.
Girvan, M., & Newman, M. E. (2002). Community structure in social and biological networks.Proceedings of the National Academy of Sciences, 99(12), 7821–7826.
Gong, Y., Lin, Y., & Duan, Z. (2017). Exploring the spatiotemporal structure of dynamic urban space using metro smart card records.Computers, Environment and Urban Systems, 64, 169–183.
iiMedia_Research (2017).2017 Q1 China renting bicycle market research report.
Jiménez, P., Nogal, M., Caulfield, B., & Pilla, F. (2016). Perceptually important points of mobility patterns to characterise bike sharing systems: The Dublin case.Journal of Transport Geography, 54, 228–239.
Kaltenbrunner, A., Meza, R., Grivolla, J., Codina, J., & Banchs, R. (2010). Urban cycles and mobility patterns: Exploring and predicting trends in a bicycle-based public transport system.Pervasive and Mobile Computing, 6(4), 455–466.
Lin, J. J., Wang, N. L., & Feng, C. M. (2017). Public bike system pricing and usage in Taipei.International Journal of Sustainable Transportation, 11(9), 633–641.
Liu, Z., Shen, Y., & Zhu, Y. (2018). Inferring dockless shared bike distribution in new cities.Proceedings of the eleventh ACM international conference on web search and data mining(pp. 378–386). ACM.
Louail, T., Lenormand, M., Ros, O. G. C., Picornell, M., Herranz, R., Frias-Martinez, E., Ramasco, J. J., & Barthelemy, M. (2014).From mobile phone data to the spatial structure of cities: Scientific reports. Vol. 4, 5276.
Ma, T., Liu, C., & Erdoğan, S. (2015). Bicycle sharing and public transit: Does capital Bikeshare affect Metrorail ridership in Washington, DC?Transportation Research Record, 2534, 1–9.
Martens, K. (2007). Promoting bike-and-ride: The Dutch experience.Transportation Research Part A: Policy and Practice, 41(4), 326–338.
Newman, M. E. (2005). A measure of betweenness centrality based on random walks. Social Networks, 27(1), 39–54.
Newman, M. E. J., & Girvan, M. (2004). Finding and evaluating community structure in networks.Physical Review E, 69(2), 026113.
O'Brien, O., Cheshire, J., & Batty, M. (2014). Mining bicycle sharing data for generating insights into sustainable transport systems.Journal of Transport Geography, 34, 262–273.
Openshow, S. (1979).A million or so correlation coefficients, three experiments on the modifiable areal unit problem: Statistical applications in the spatial science.127–144.
Pal, A., & Zhang, Y. (2017). Free-floating bike sharing: Solving real-life large-scale static rebalancing problems.Transportation Research Part C: Emerging Technologies, 80, 92–116.
Pebesma, E. (2018). Simple features for R: standardized support for spatial vector data. The R Journal, 10(1), 439–446.
Saberi, M., Ghamami, M., Gu, Y., Shojaei, M. H. S., & Fishman, E. (2018). Understanding the impacts of a public transit disruption on bicycle sharing mobility patterns: A case of tube strike in London.Journal of Transport Geography, 66, 154–166.
Shaheen, S. A., Guzman, S., & Zhang, H. (2010). Bikesharing in Europe, the Americas, and Asia: Past, present, and future.Transportation Research Record, 2143(1), 159–167.
Shen, Y., Zhang, X., & Zhao, J. (2018). Understanding the usage of dockless bike sharing in Singapore.International Journal of Sustainable Transportation, 12(9), 686–700.
Sun, H.-j., Zhang, H., & Wu, J.-j. (2012). Correlated scale-free network with community: Modeling and transportation dynamics.Nonlinear Dynamics, 69(4), 2097–2104.
Tran, T. D., Ovtracht, N., & D'arcier, B. F. (2015). Modeling bike sharing system using built environment factors.Procedia Cirp, 30, 293–298.
Vogel, P., Greiser, T., & Mattfeld, D. C. (2011). Understanding bike-sharing systems using data mining: Exploring activity patterns.Procedia-Social and Behavioral Sciences, 20, 514–523.
Xu, Y., Chen, D., Zhang, X., Tu, W., Chen, Y., Shen, Y., & Ratti, C. (2019). Unravel the landscape and pulses of cycling activities from a dockless bike-sharing system. Computers, Environment and Urban Systems, 75, 184–203.
Yang, Y., Heppenstall, A., Turner, A., & Comber, A. (2018). Examining the impact of new metro services on dockless bike sharing mobility patterns.AGILE 2018: Lund, Sweden.
Zandbergen, P. A. (2009). Accuracy of iPhone locations: A comparison of assisted GPS. WiFi and cellular positioning: Transactions in GIS.Vol. 13.WiFi and cellular positioning: Transactions in GIS(pp. 5–25).
Zhang, Y., Lin, D., & Mi, Z. (2019). Electric fence planning for dockless bike-sharing services.Journal of Cleaner Production, 206, 383–393.
Zhao, P., & Li, S. (2017). Bicycle-metro integration in a growing city: The determinants of cycling as a transfer mode in metro station areas in Beijing.Transportation Research Part A: Policy and Practice, 99, 46–60.
Zhong, C., Arisona, S. M., Huang, X., Batty, M., & Schmitt, G. (2014). Detecting the dy-namics of urban structure through spatial network analysis.International Journal of Geographical Information Science, 28(11), 2178–2199.
Zhou, M., Wang, D., Li, Q., Yue, Y., Tu, W., & Cao, R. (2017). Impacts of weather on public transport ridership: Results from mining data from different sources.Transportation Research Part C: Emerging Technologies, 75, 17–29.
Zhou, S., Ni, Y., & Zhang, X. (2018). Effects of dockless bike on modal shift in metro commuting: A pilot study in Shanghai.Proceedings proceedings of the 2018 transpor-tation research board 97th annual meeting(no. 18-04973).