*Department of Otolaryngology, University of California, San Francisco
Robert Sweetow, 400 Parnassus Ave., A705, San Francisco, CA 94143-0340; Phone: 415-353-2012; Fax: 415-353-2377; E-mail: [email protected]
Portions of this paper were presented at the 17th Annual American Academy of Audiology Convention, Washington, DC, April 2005.
Disclosure: In the interest of full disclosure, it should be noted that the authors have a financial interest in Neurotone, Inc., the company licensed by UCSF to produce LACE™.
The Need for and Development of an
Adaptive Listening and Communication
Enhancement (LACE
TM
) Program
Abstract
Auditory training has long been advocated to enhance communication but has never been time or cost-effective. This article describes the concepts underlying the development of a home-based, interactive adaptive computer program designed to engage the adult hearing-impaired listener in the hearing-aid-fitting process, provide listening strategies, build confidence, and address cognitive changes characteristic of the aging process. An investigation using a between-group, within-subject design with pre- and post-test objective and subjective measures was conducted at five clinical sites. Sixty-five subjects were randomly placed into two groups, one receiving LACE™ (Listening and Communication Enhancement) immediately following baseline testing and one serving as a control for one month and then receiving training as a crossover group. Results showed statistically significant improvements for the trained subjects on all but one of the outcome measures. Barriers facing the widespread implementation of home-based aural rehabilitation are discussed. Key Words: Analytic training, auditory learning, aural rehabilitation, cognitive changes, computer assisted therapy, interactive communication strategies, listener confidence, neural plasticity, perceptual learning, rehabilitation of hearing impaired, speed of processing, synthetic training, working memory Abbreviations: CR = compression ratio; CS = Competing Speaker; CSOA = Communication Scale for Older Adults (CSOA-a = attitudes subset, CSOA-s = strategies subset); HHIE/A = Hearing Handicap Inventory for the Elderly/Adults; HINT = Hearing in Noise Test; IC = Interactive Communication; LACE™ = Listening and Communication Enhancement; MW = Missing Word; PC = personal computer; QuickSIN = Quick Speech In Noise test; SB = Speech in Babble; SNR = signal-to-noise ratio; TC = Time Compressed; TW = Target Word; UCSF = University of California, San Francisco; WSOLA = Waveform Similarity Overlap-Add algorithm
Sumario
Se ha preconizado por largo tiempo que el entrenamiento auditivo mejora la comunicación, pero que nunca ha sido efectivo desde el punto de vista de tiempo o costo. Ese artículo describe los conceptos relacionados con el desarrollo de un programa hogareño de computadora, interactivo y adaptable diseñado para involucrar el adulto hipoacúsico en el proceso de adaptación de un auxiliar auditivo, aportarle estrategias para escuchar mejor, crear confianza, y manejar
Robert W. Sweetow* Jennifer Henderson Sabes*
T
he profession of audiology grew out of the need for rehabilitative services for veterans returning from battle in World War II (Newby and Popelka, 1985). At that time, Carhart and other pioneers of the field intended to create a science that would (1) identify and quantify the degree and nature of hearing impairment and (2) propose and implement therapeutic interventions (aural rehabilitation) to help alleviate any residual handicap resulting from hearing loss. Today, it is clear that the former objective has been achieved. Most clinical audiologists are competent diagnosticians. However, it is difficult to determine whether the latter objective has been achieved. This is because “aural rehabilitation” is a somewhat ill-defined term. If one presumes that therapeutic intervention consists of getting the hearing-impaired patient to wear hearing aids, it would appear that it is not very successful, based on the fact that, in the United States, for example, only a small percentage (approximately 20%) ofhearing-impaired individuals actually own hearing aids (Kochkin, 2000). In addition, a significant percentage of those individuals are not satisfied with their hearing aids. Of course, hearing aids are not the only intervention available to audiologists. Training of communication strategies, speechreading, auditory training, auditory scene analysis, and beneficial use of cognitive resources also are important aspects of aural rehabilitation beyond amplification. If one defines aural rehabilitation as intervention extending beyond simple education regarding care and maintenance of hearing aids, the numbers of patients receiving rehabilitation (auditory and/or communication training) may be alarmingly low. In the 1980s, over 30% of audiologists provided auditory training. However, in the 1990s only 16% provided this service (Schow et al, 1993) This may be due to a greater focus on hearing aids, which would be acceptable if the result was superior benefits, higher satisfaction, increased acceptance, and a larger market penetration.
cambios cognitivos característicos del proceso de envejecimiento. Se condujo una investigación en cinco centros clínicos utilizando un diseño entre-grupos e intra-sujeto, y con medidas objetivas y subjetivas pre y post evaluación Se colocó a sesenta y cinco sujetos en dos grupos, uno recibiendo LACE™ (Mejoramiento Auditivo y Comunicativo) inmediatamente después de la evaluación basal y otro que sirvió como control durante un mes, para después recibir entrenamiento como grupo de cruzamiento. Los resultados mostraron mejorías estadísticamente significativas en los sujetos entrenados, en todas menos una de las medidas de resultado. Se discuten las barreras enfrentadas por la implementación cada vez más frecuente de rehabilitaciones aurales hogareñas.
Palabras Clave:Entrenamiento analítico, aprendizaje auditivo, rehabilitación aural, cambios cognitivos, terapia asistida por computadora, estrategias interactivas de comunicación, confianza del oyente, plasticidad neural, aprendizaje perceptual, rehabilitación del hipoacúsico, velocidad de procesamiento, entrenamiento sintético, memoria de trabajo
Abreviaturas: CR = tasa de compresión; CS = hablante en competencia; CSOA = Escala de Comunicación para Adultos Mayores; (CSOA-a = sub-set de actitudes, CSOA-s = sub-set de estrategias); HHIE/A = Inventario de Impedimento Auditivo en Ancianos/Adultos; HINT = Prueba de Audición en Ruido; IC = comunicación interactiva; LACE™ = Mejoramiento Auditivo y Comunicativo; MW = palabra perdida; PC = computador personal; QuickSIN = Prueba de Lenguaje Rápido en Ruido; SB = lenguaje en balbuceo; SNR = tasa señal/ruido; TC = tiempo comprimido; TW = palabra blanco; UCSF = Universidad de California, San Francisco; WSOLA = Algoritmo de Traslape/Adición en la Similitud de la Forma de la Onda
The data, however, reflect the lack of a clear correlation between these outcome measures and increasingly advanced technology in hearing aids. This is not to say that a significant percentage of individuals fitted with hearing aids are not benefiting, satisfied, and accepting of amplification. The decrease may also be due to a lack of third-party payment. Payment is minimal for aural rehabilitation, and audiology is not recognized as a rehabilitative field. As of January 1, 2006, there were new CPT codes that reimburse for aural rehabilitation.
Of course, both benefit and satisfaction are multifactored concepts (Cox and Alexander, 1995; Cox and Alexander, 1999). Benefit may be defined as the difference between unaided and aided conditions. It is related to a reduction in activity limitation and/or a restriction in participation. Satisfaction is an outcome variable that encompasses the full constellation of factors needed for a positive fitting result. It is intimately related to reasonable expectations. Satisfaction is influenced by personal variables such as communication demands and lifestyle. It means different things to different people. Patients can be satisfied but receive limited or no benefit. Or, they can perceive benefit but be dissatisfied. Ultimately, the gold standard for achieving both benefit and satisfaction should include enhanced communication skills.
One can reasonably argue that a fundamental element for both satisfaction and benefit is ease of listening. There is a fundamental difference between hearing and listening. A person can possess normal hearing yet be a very poor listener. Conversely, a good listener requires the ability to hear, but not necessarily normally. Hearing is a sense. Listening is a skill. Hearing requires audibility. To be a good listener, one must integrate a number of skills of which hearing is but one. At a minimum, listening requires attention and intention to access and utilize acoustic information (Keissling et al, 2003). Patients presenting similar audiometric profiles frequently obtain diverse benefit from amplification. To truly benefit from hearing aids, one must assimilate hearing with listening. Merely being able to hear does not guarantee listening skills. One reason is related to an individual’s ability to blend a minimum of acoustic, linguistic, and external environment cues together with
attention to form a cogent message. Modern hearing aids can provide audibility but certainly cannot eliminate unwanted noise and may not rectify impaired frequency and temporal resolution. As a result, most hearing aid users must operate with a set of incoming signals that is at least to some degree different, and presumably inferior, to that which the individual with normal hearing possesses. In other words, the hearing aid user generally receives a partially degraded signal, either because of extrinsic sources such as noise interference or limited bandwidth, or from underlying intrinsic limitations such as imperfect audibility, cochlear distortion, and impaired frequency and temporal resolution. Threshold elevation can account for nearly all of the changes in speech perception with age in quiet or in less demanding listening environments (Humes, 1996). But in complex perceptual tasks, older listeners are more likely to demonstrate interhemispheric differences, changes in event-related potentials (Jerger and Martin, 2005), and suprathreshold deficits in addition to the effects of reduced audibility. It is unclear exactly which factors account for this (Gordon-Salant and Fitzgibbons, 1997; Pichora-Fuller and Souza, 2003), though several possibilities will be discussed below. In addition, hearing-impaired listeners may develop compensatory tactics that may be maladaptive to their ultimate listening skills. At the microlevel this may be a matter of altered categorical perception. At a macrolevel it may include misguided repair strategies. Adding to the difficulties created by the presence of a peripheral hearing loss is the fact that peripheral attenuation can lead to central auditory changes. There is evidence to suggest that once degeneration of the spiral ganglion cells has begun, there is a corresponding degeneration within the central nervous system including the cochlear nuclei, superior olive, and inferior colliculus (Kim et al, 1997; Morest et al,1998). Fortunately for humans, the central nervous system has a remarkable capacity to compensate for limitations, central or peripheral (Ramachandran, 2005). In most cases of hearing loss, the physical damage commonly is restricted to the peripheral organs. The central auditory areas tonotopically associated with the cochlear neurons are physically undamaged yet may respond with altered firing characteristics
as a result of the lack of stimulation from the peripheral attenuation. This alteration is a form of neural plasticity. This type of plasticity is characterized by “reorganization of sensory maps caused by damage to ... peripheral receptors ... and synaptic or circuit alterations associated with attenuation of peripheral input to the brain” (Willott, 1996, p. 66S). In the case of a stroke or physical damage to a peripheral limb, such as a leg or arm, treatment includes some type of training regimen to strengthen the adjacent unimpaired areas. As stated earlier, however, when hearing aids are employed to try to compensate for a peripheral hearing loss, few patients are provided with systematic training techniques to allow them to optimally utilize the residual cues available to them. Hearing loss, auditory stimulation, and conditioning with sound all induce plasticity (Palmer et al, 1998). The reorganization of the central auditory nervous system may occur before and/or after amplification. Neural plasticity has been discussed with relationship to auditory learning (Palmer et al, 1998) and adaptation following hearing aid use (Silman et al, 1984; Moore, 1993; Neuman, 1996; Turner et al, 1996). In addition, neurophysiologic changes related to auditory learning have been documented (Tremblay et al, 2003). Functional magnetic resonance imaging findings have shown neural plasticity is not completely lost with age or with lack of neural stimulation, which is of interest considering the majority of hearing aid users are older people (Taub et al, 2002).
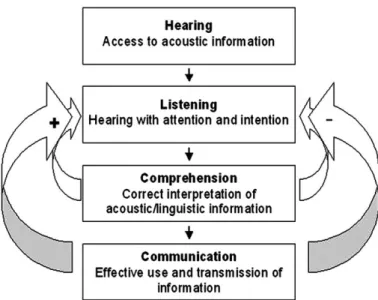
In addition to the variety of potential changes associated with peripheral and central auditory changes are cognitive changes characteristic of aging (Greenwald and Jerger, 2001). In 2001, Oticon assembled a group of international audiology, rehabilitation, and gerontology experts led by Jurgen Kiessling to discuss the audiological services and special needs of older people. In a series of papers, the participants identified cognitive changes, including a reduction in speed of processing, and deficits in auditory working memory that can adversely impact communication in adverse environments (Hickson and Worrall, 2003; Pichora-Fuller, 2003; Pichora-Fuller and Sousa, 2003). They also proposed the following cascade leading to effective communication. The most basic step ishearing, “a passive function providing
access to the auditory world via the perception of sound.” Next comes listening, the “process of hearing with intention and attention.” Listening is an active process requiring effort. Listening is followed by comprehending, “the reception of information, meaning, and intent.” Comprehending is unidirectional. The final step is communicating, “the bi-directional transfer of information, meaning, and intent.” These processes can also be thought of as having positive and negative feedback functions as described by Sweetow and Henderson Sabes (Figure 1). As implied by this graph, not only will enhanced listening skills lead to better comprehension and communication, but better comprehension and communication will further enhance listening skills. In other words, there is a positive feedback loop, which ultimately produces improvements both in the skill being trained and in the other elements of communication. This feedback loop incorporates the segments of both top-down and bottom-up processing that also are relevant to individuals with auditory processing disorders. Central auditory processing disorder (CAPD) specialists have exploited this fact therapeutically for years (Chermak and Musiek, 2002; Musiek et al, 2002). Conversely, when a breakdown occurs anywhere in the process, a negative feedback
Figure 1. Positive and negative feedback function as proposed by Sweetow and Henderson Sabes (with permission from the Hearing Journal).
loop may result, adversely impacting overall auditory communication. One of the key components establishing this feedback loop is listener confidence, which is influenced significantly by immediate recognition of success or failure.
Recent discoveries in the field of neuroscience suggest that auditory skills might be enhanced with training that exploits neural plasticity and reorganization, and facilitates altered categorical perception. However, questions abound regarding how to identify individuals who might benefit from training, how to determine the most efficient parameters of training, and how to measure progress. Moreover, despite the fact that audiologists have long recognized the potential benefit from aural rehabilitation (Montgomery et al, 1984; Rubenstein and Boothroyd, 1987; Kricos et al, 1992; Hawkins, 2005; Sweetow and Palmer, 2005), this service is not currently provided by most practitioners. There are several reasons that aural rehabilitation is not routinely provided. For one thing, it is time-consuming, and many professionals do not consider it worth the time and trouble. A viable alternative is group aural rehabilitation. It has been demonstrated that participants with hearing aids in post-hearing-aid-fitting aural rehabilitation programs improve self-perceived hearing handicap (i.e., participation restriction) compared to hearing aid fitting alone (Alberti et al, 1984; Smaldino and Smaldino, 1988; Abrams et al, 1992; Beynon et al, 1997; Primeau, 1997). In addition, these programs have been shown to increase hearing aid use and satisfaction (Brooks, 1979; Ross, 1987; Riko et al, 1990; Northern and Beyer, 1999). A limitation of the group approach, however, is that it ignores differences among individual patients.
A potential solution has been recognized in computer aided auditory rehabilitation. A number of efforts to produce computerized speechreading and assertive listening training programs have been made (Sims et al, 1979 [DAVID]; Boothroyd, 1987 [CASPER]; Tye-Murray et al, 1988; Gagne et al, 1991 [CAST]; Pichora-Fuller and Bengeural, 1991; Dempsey et al, 1992 [CATS]; Parker et al, 1993 [MacAid]). These programs have shown potential but have not been widely used. A computerized auditory training program that has received widespread attention is FastForWord, a program
developed for children with learning problems (Tallal et al, 1996). Computerized training also has been proven effective in sensory training for other visual deficits (Ciuffreda, 2002), as well as for cognitive disorders such as age-associated memory deficits and early-stage Alzheimer’s (Gunther et al, 2003).
There are numerous advantages to computerized aural rehabilitation. For example, well-established rules of perceptual learning can be easily implemented in a computerized protocol. More than 50 years ago, Wolfle (1951) proposed the following critical aspects of learning theory that are vital for perceptual learning:
• Distribution of practice should be suitable for the task to be learned. • Active participation by the learner
is superior to passive receptivity. • Practice material should be varied so
that the learner can adapt to realistic variation and so that his motivation during drill is improved.
• Accurate performance records need to be maintained in order to evaluate progress and effects of training. • The most useful single contribution
of learning theory is the provision for immediate knowledge given to learners regarding their performance (feedback).
In this paper, we will review the development of an individualized computer-assisted training program. LACE™ (Listening and Communication Enhancement) is a home-based, interactive computer program designed to engage the adult hearing-impaired listener in the hearing-aid-fitting process, provide listening strategies, build confidence, and address cognitive changes characteristic of the aging process. LACE is a furthering of previous AR and APD constructs. While APD therapies like those proposed by others (Musiek, 1999; Chermak and Musiek, 2002; Musiek et al, 2002) thrive and survive, the prevalence of AT in SNHL is declining.
METHODS
LACE Training Rationale
developing the program was that human beings adapt to sensory deprivation in at least two manners. One, they modify their behavior in a way they believe, sometimes incorrectly, to be beneficial. Two, they likely undergo physiologic changes (including plasticity). Furthermore, patients presenting similar audiometric profiles frequently obtain very different benefits from amplification. Various factors may account for this. In addition to those referred to earlier, an important aspect relates to an individual’s assimilation of acoustic, linguistic, and environmental cues. To optimize this integration, a person must call upon many abilities and auditory skills, including cognition, auditory processing, auditory memory, auditory closure, auditory learning, and use of pragmatics, semantics, grammatical shape, metalinguistics, localization, visual cues, repair tactics, and effective interactive communication strategies (Hickson and Worrall, 2003; Kiessling et al, 2003; Pichora-Fuller, 2003). Working against many hearing-impaired individuals is the fact that there are resource limitations. In addition to peripheral deficits, certain central and cognitive skills tend to worsen with age (Wingfield and Tun, 2001). Among these, as underscored by the common patient complaint “if everyone would simply talk slower I would be fine,” is speed of processing. This refers to the capacity to implement rapid higher-order cognitive assessments, as opposed to those required for psychophysical temporal processing. In addition, auditory working memory can be adversely affected with age (McCoy et al, 2005). Integrating both short- and long-term memory may assist the listener in comprehending speech immersed in adverse acoustic environments.
We also considered the following features to be essential in designing a practical and comprehensive training program that could be implemented and accepted for widespread use in adults:
• It must be cost-effective.
• It must be practical and easily accessible, i.e., it should be able to be implemented in the privacy and comfort of a patient’s home. • It must be interactive.
• It must be sufficiently difficult to maintain interest and attention while being sufficiently manageable to minimize fatigue.
• It must provide reinforcement to the patient (Benenger and Miller, 1998; Kilgard and Merzenich, 1998). • Training must take place near the
individual’s skill threshold (Blake et al, 2002).
• It must proceed at the patient’s optimal pace.
• It must integrate listening training (analytic) with repair strategies (synthetic). In other words, it should incorporate elements of both bottom up and top down training.
• It must provide the patient with feedback regarding progress or lack of progress (Holroyd et al, 2004). • It must provide for measurement
and feedback to the professional that is verifiable via remote access. • It should make the patient assume
some degree of “responsibility” for the ultimate outcome objective.
General Description of LACE
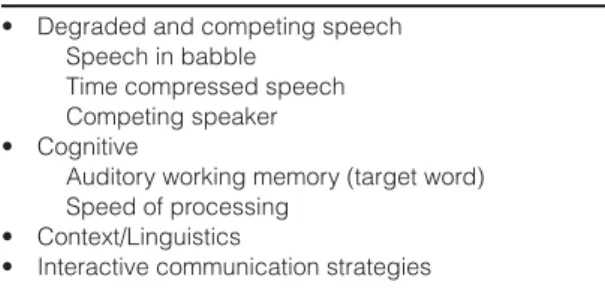
A software program was designed to provide a variety of interactive and adaptive tasks that are divided into three main categories (better comprehension of degraded speech, enhancement of cognitive skills, and improvement of communication strategies). Many options for training tasks were possible. The exercises chosen for LACE were chosen for accessibility, ease of use, and subject feedback from subjects in a pilot study. For degraded speech exercises, speech is either time compressed (to simulate rapid speech), presented with background multitalker babble noise, or presented with a single competing speaker. The patient (trainee) listens to and identifies the signal then views the correct response on the screen. If the sentence was correctly comprehended, the next sentence will be more difficult; conversely, if it was identified incorrectly, the next sentence will be easier. In other words, the difficulty level of the task is adaptive, based on the accuracy of the trainee’s response to the previous trial. LACE also provides stimulating training exercises to enhance cognitive processes such as auditory memory and cognitive speed of processing, two elements of listening that are particularly important in adverse environments. Also, LACE provides interactive communication strategies
designed both to educate and to counteract previously learned maladaptive compensatory tactics.
The main objectives of LACE are shown in Table 1. The listening and communication skills referred to in the final bullet are not inherent and must be enhanced by the motivation and training of the individual.
The LACE training paradigm involves an individualized computerized auditory training program. Training is conducted for 30 minutes, five days per week, for a period of four weeks. Subjects complete training on a personal desktop or laptop computer. Training is conducted at the trainee’s most comfortable level (MCL) using the exercises shown in Table 2 and described below. Demonstrations of exercises described in this paper may be downloaded from http://www.neurotone.com/professionals.html. S
Sppeeeecchh iinn BBaabbbbllee
The Speech in Babble (SB) exercise constitutes approximately 30% of the total adaptive training. Training is organized into topics (health issues, money matters, exercise, etc.) that are selected by the trainee at the beginning of the training session in order to reinforce the importance of utilizing contextual cues by keeping the general topic in mind when listening. This task consists of sentences presented in the presence of multitalker babble. Initially, the signal-to-noise ratio (SNR) is +10 dB. The trainee
repeats as much of the sentence as he or she comprehends, either aloud or silently. The subject then progresses to the next screen where the sentence is presented visually. The subject is then asked to determine whether he or she understood every word in the sentence, and to confirm by selecting “yes” or “no.” The sentence is then presented again to the trainee in both the visual and auditory mode. If the “yes” button was selected, the next sentence is presented at the same intensity level, but the noise level is increased by 4 dB, thus yielding a +6 dB SNR. Alternately, if the subject responded that he or she did not fully comprehend the sentence, the next presentation will be at a +14 dB SNR. The training continues in this manner for five presentations, after which the step size for altering the SNR is reduced to 2 dB. At the start of the next SB training session, the SNR is presented at two steps (4 dB SNR) above the average performance of the previous training session, and all step sizes thereafter are 2 dB.
T
Tiimmee CCoommpprreesssseedd SSppeeeecchh
The Time Compressed (TC) speech exercise constitutes approximately 20% of the training. In this task the training paradigm is identical to that of the SB protocol; however, the variable that is modified is the compression ratio (CR) of the speech signal. The speech signal is based on a typical and average rate of approximately four syllables per second and is initially compressed at a ratio of 0.85 (in other words, the stimuli are compressed to 85% of the normal time). A WSOLA (Waveform Similarity Overlap-Add) algorithm, designed to maintain an unaltered pitch despite the time compression, is utilized. The subject listens to the sentence and repeats it as in the SB module. For the first five iterations, the adjustments to the ratio are in steps of 0.075, Table 2. LACE™ Training Exercises
• Degraded and competing speech Speech in babble
Time compressed speech Competing speaker • Cognitive
Auditory working memory (target word) Speed of processing
• Context/Linguistics
• Interactive communication strategies
Table 1. Main Objectives of LACE™
• Enhance listening and communication skills. • Get the patient involved.
• Improve confidence levels. • Provide communication strategies. • Reduce unnecessary visits.
then in steps of 0.025. The ratio is limited so that it can never get above 1.0 (normal speed) or below 0.1 (10x speed). Like SB (and the following Competing Speaker [CS] exercise), the general topic matter is the one selected at the beginning of the training session, and the initial presentation at the start of each successive training session is two step sizes easier than the average performance of the previous session.
C
Coommppeettiinngg SSppeeaakkeerr
The Competing Speaker exercise constitutes approximately 20% of the training. In this module the subject progresses through the training in the exact manner as the SB protocol, the only difference being that the background noise is a single-talker, rather than multisingle-talker, babble. Again, the intensity level of the signal at the initial presentation is 10 dB greater than that of the competing speaker. If the sentence is correctly identified, SNR is reduced by initial steps of 4 dB, and after the fifth presentation, the step size is reduced to 2 dB. In this task the trainee is prompted to attend to one of three voices, a male, a female, or a child. The competing speaker is always one of the remaining two voices. In order to reduce frustration, the female’s and child’s voices are never presented together in this task. The precise timing relationship is randomized so that in some instances the target voice has a slight lead, and in others the background voice may have a slight lead.
A
Auuddiittoorryy WWoorrkkiinngg MMeemmoorryy ((TTaarrggeett W
Woo rr dd ))
The Target Word (TW) exercise is a cognitive training task developed for this
study that incorporates auditory memory. It constitutes approximately 15% of the training. In this task, the subject is visually presented with a target word. The subject is next prompted to listen to a sentence in quiet. The target word is one of the words in the sentence. Following the auditory presentation of the sentence, the trainee is asked to respond via a multiple-choice option by selecting the word that occurs just prior to the target word in the sentence. The sentence is then visually presented with the correct word underlined on the visual display. When the patient answers three consecutive presentations correctly, the algorithm increases the difficulty of the task. The difficulty of the task varies not only based on the length of the sentence but also by the order in which the task is presented. For example, the second difficulty level does not reveal the target word until afterthe sentence is presented, thus requiring the subject to retain the entire sentence in short-term memory until completing the task. If the trainee successfully responds to two consecutive stimuli, the program becomes more difficult by presenting twotarget words and twosentences. The program allows for six levels of difficulty (Table 3). If the trainee incorrectly answers two consecutive presentations, the task difficulty is decreased in the opposite manner. Each successive training session begins at one level of difficulty easier than the average performance of the previous session.
M
Miissssiinngg WWoo rr dd
The Missing Word (MW) exercise is similarly a cognitive training task, but this process incorporates speed of processing as well as use of linguistic and contextual cues. This procedure constitutes approximately 15% of the training. In this auditory
closure-Table 3. Levels of Auditory Memory (Target Word) Exercise Difficulty
• Level 1: TW presented beforethe patient hears the sentence. • Level 2: TW presented afterthe patient hears the sentence. • Level 3: 2 TWs presented beforethe patient hears 2 sentences. • Level 4: 2 TWs presented afterthe patient hears 2 sentences. • Level 5: 3 TWs presented beforethe patient hears 3 sentences. • Level 6: 3 TWs presented after the patient hears 3 sentences.
Note: When the trainee correctly identifies two consecutive stimuli, the program progresses to the next level; if the trainee incorrectly identifies two consecutive stimuli, the program reverts one level.
type exercise, the subject is presented with a sentence in quiet with one word masked completely by an environmental sound (i.e., car horn honking, telephone ringing, etc.). After the sentence is presented, the subject is prompted to say the missing word aloud or silently and then to advance the screen by pressing the enter button. Four options (three words and the word “none,” indicating none of the words were appropriate) are visually displayed. The trainee then is instructed to select one of the responses as quickly as possible. If the word he or she initially perceived is not displayed but a synonym was, the synonym should be selected. If neither the word nor a synonym was displayed, the subject is instructed to select “none” to indicate none of the above. If the trainee chooses a response that was not correct, a visual prompt is given showing the word that was selected by most people. This task, unlike the previous ones described, is not adaptive. The computer keeps track of the correct answers as well as the response time of the trainee.
IInntteerraaccttiivvee CCoommmmuunniiccaattiioonn SSttrraatteeggiieess Periodically, during and at the conclusion of each exercise, training is briefly interrupted with a differently colored screen. On this screen is a “helpful hint” conveying aural rehabilitation or interactive communication information. Subjects are also provided with a supplemental materials booklet and are instructed that if a “helpful hint” is found to be of particular interest, more information can be reviewed in the supplemental packet at the end of the training session. In subsequent versions of software, LACE will provide this supplemental information on the computer screen at the completion of the 30-minute
training session. Interactive Communication (IC) strategies include, but are not limited to, topics such as managing the acoustical environment, assertive listening skills and communication strategies, care and maintenance of hearing aids, assistive listening devices, and realistic expectations.
VERIFICATION STUDIES
T
wo experiments were conducted in thedevelopment of LACE. Phase One was a small pilot study conducted at the University of California, San Francisco (UCSF) and reported on by Sweetow and Henderson Sabes (2004). The results of this preliminary study suggested that a take-home training program with a realistic paradigm could improve some listening skills in a relatively short time. The main difference between the protocol for the Phase One pilot study versus the larger project described below is that the pilot project did not employ an adaptive procedure, and cognitive training and interactive communication strategies were not provided. Phase Two was a larger investigation incorporating all of the exercises discussed earlier. This project will be now discussed in detail.
Subject Population
Sixty-five subjects completed the Phase Two investigation. A between-group, within-subject, experimental design with pre- and post-test measures study was conducted at five clinical sites across the United States. Institutional review board approval was obtained through the University of California. Two of the sites were university clinics, and
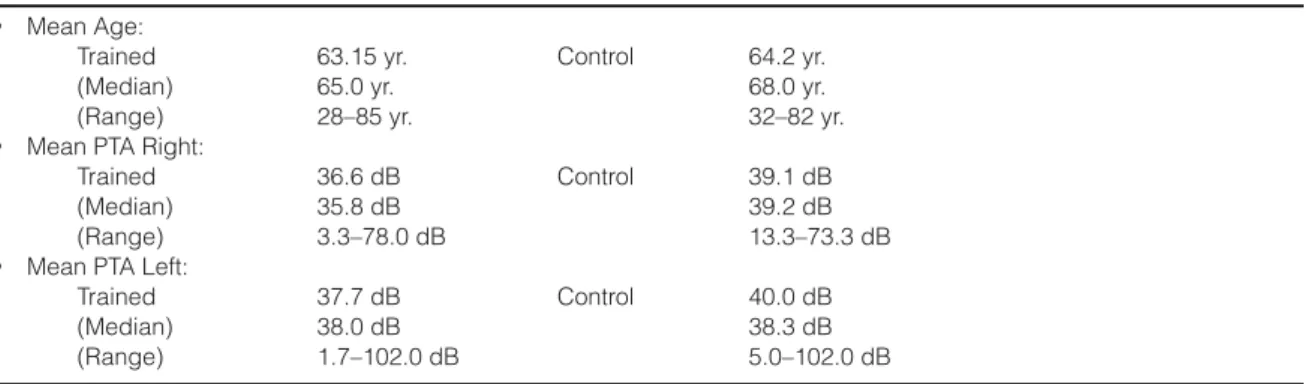
Table 4. Demographic and Hearing Loss Data for the Two Groups
• Mean Age:
Trained 63.15 yr. Control 64.2 yr.
(Median) 65.0 yr. 68.0 yr.
(Range) 28–85 yr. 32–82 yr.
• Mean PTA Right:
Trained 36.6 dB Control 39.1 dB
(Median) 35.8 dB 39.2 dB
(Range) 3.3–78.0 dB 13.3–73.3 dB
• Mean PTA Left:
Trained 37.7 dB Control 40.0 dB
(Median) 38.0 dB 38.3 dB
three were private practice clinics. Subjects at one of the sites were paid. All other subjects volunteered their time. Subjects’ ages ranged from 28–85. Subjects were randomly placed into one of two groups. Group 1 subjects started the training immediately after the initial testing session. There were 16 subjects who began but did not finish training for a variety of reasons ranging from “lack of time,” to “illness,” to “loss of interest.” Group 2 subjects completed the initial test session, returned one month later and completed a second test session (end of control period), and then started training (crossover period). Group 2 began with 33 controls—and 27 completed the crossover, while Group 1 had 38 subjects completing the training. There were initially 56 subjects enrolled in Group 1. There were no significant differences between the trained subjects in Groups 1 and 2, so the data were pooled for these two groups. Table 4 shows the demographic and hearing loss data for the two groups. Fifty-six subjects were experienced hearing aid users (having worn amplification for six months to 44 years, with an average of 5.3 years). Approximately 85% wore binaural amplification, and nine subjects did not use amplification but reported difficulty understanding speech in adverse listening environments. New hearing aid users were not included in this study due to possible effects of acclimatization. Subjects completed training on a personal desktop or laptop computer. Subjects who did not own personal computers (PC) were either loaned a laptop computer or utilized a prototype dedicated hardware device that presented the training in a manner that was identical to that used on a PC.
Training Stimuli
Approximately 2000 sentences were used as stimuli. For SB, TC, and CS training tasks, the subject was asked each day to choose a subject topic (e.g., Money Matters, Exercise, Health, or Potpourri) and was trained using sentences relevant to that topic. TW and MW training tasks used designated sentences. Stimuli were presented in the sound field at the subject’s MCL, as based on a calibration sentence. Subjects were instructed not to change the volume of their computers, speakers, or hearing aids for the rest of the session. In the SB, TC, and CS
training tasks, stimuli were presented at MCL (60%), +5 dB re MCL (20%), and -5 dB re MCL (20%). The TW and MW training tasks presented all stimuli at MCL.
Subjects were instructed to train when not fatigued, to maintain a consistent schedule, and to always answer honestly. All data as well as the time and date of each training session were saved on a floppy disk. Test Measures
Test sessions included objective and subjective test measures. Objective testing was conducted with the subjects wearing their hearing aid(s) at the same user setting at which they completed the training exercises. Although electroacoustic monitoring of the hearing aids was not completed at every test session, hearing aids were determined to be in working order through a listening check by a normal-hearing clinician. At each test session, subjects completed two speech in noise tests: three sets of the QuickSIN (Quick Speech In Noise test, version 1.3, Etymotic Research, Elk Grove Village, IL, 2001) at 45 dB HL and at 70 dB HL, and the Hearing in Noise Test (HINT, version 6.3, Maico Diagnostics, Eden Prairie, MN; Nilsson et al, 1994) at a 65 dBA noise level (noise at 0 degrees). Subjects also completed the standard version of the Hearing Handicap Inventory for the Elderly (HHIE; Ventry and Weinstein, 1982) or the Hearing Handicap Inventory for Adults questionnaire (HHIA; Newman et al, 1990). If the subject was 65 or younger, or engaged in regular employment, the subject completed the HHIA. Subjects also completed the five-point Communication Scale for Older Adults (CSOA; Kaplan et al, 1997). The CSOA is comprised of two subscales, a communication strategies subscale and a communication attitudes subscale. It is a measure designed to show changes in attitudes and use of communication strategies in adults. Both the HHIE and the CSOA were administered in paper and pencil form. In addition to these measures, a subset of subjects completed further objective test procedures at UCSF. These measures include the Stroop Color Word test (a test for speed of processing and interference; Uttl and Graf, 1997) and a listening span test (a test for auditory working memory; Pichora-Fuller, et al, 1995). It should be noted that baseline test scores using these measures were compared, and
there were no significant differences between groups (unpaired t-test with Welch’s correction, p > 0.05).
Testing Schedule
Group 1, the immediately trained group, had testing completed within two days prior to training (baseline), at two weeks into the training (midtraining), at the end of the four-week training program (post-training), and then at eight weeks (four weeks post-training). Group 2, the crossover subjects, received testing at baseline and four weeks later, just prior to training. They then received testing at two weeks into the training (midtraining), at the end of the four-week training program (post-training), and again at eight weeks (four weeks post-training).
RESULTS
R
esults can be divided into on-task training (measured during the training using the training materials and protocol) and off-task training (as measured using the standardized outcome measures listed above). Off-task measures are necessary to establish generalization.On-Task Training Results
The initial ten trials of each task were discarded from data analysis. Each subject’s daily data was organized into four equal quarters, corresponding to roughly one week of training. Analyzing the data in this manner allowed us to assess the rate of changes and whether four weeks of training was appropriate for each of the tasks.
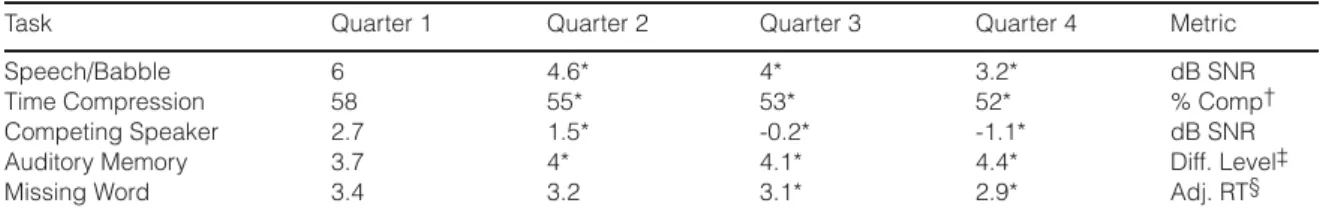
Table 5 lists the average training threshold for each quarter across all subjects. Data with asterisks indicate a significant improvement (p < 0.05, ANOVA) relative to the first quarter of training. For all of the tasks there was some improvement shown during the first quarter. Since procedural learning occurs early in the training process (Hawkey et al, 2004), we will assume that all procedural learning takes place in the first quarter of training. Therefore, improvements in the last three quarters will reflect perceptual learning.
S
Sppeeeecchh iinn BBaabbbbllee TTaasskk
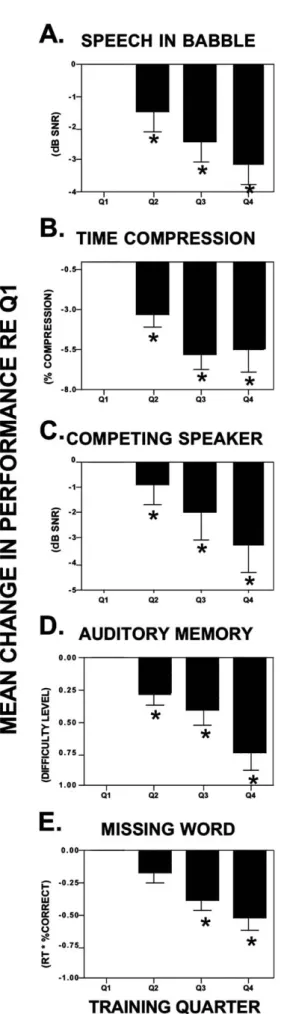
Figure 2A shows the mean change in speech in babble performance (in dB SNR) achieved for the SB exercises for each of the training quarters, relative to the average of the first quarter (which has been normalized to reflect a baseline of 0 for this figure as well as Figures 2B–2E). A decrease in the SNR ratio indicates improvement. Error bars indicate the standard error of the mean. As designated with an asterisk, Quarters (Q) 2 (-1.4 dB), 3 (-2 dB), and 4 (-2.8 dB) were significantly different from the baseline quarter, and Q4 was significantly different than Q2 (p < 0.05, ANOVA). Eighty-seven percent of the subjects had Q4 scores that were better than Q1 scores.
T
Tiimmee CCoommpprreesssseedd SSppeeeecchh TTaasskk
Figure 2B shows the mean change in the time compressed speech performance (in percent compression) for each of the training quarters, relative to the first quarter (baseline). A decrease in score on the plot indicates improvement. Error bars indicate the standard error of the mean. As designated with an asterisk, Q2 (3%), Q3 (5%), and Q4
Table 5. Mean Training Thresholds for Each Training Quarter
Task Quarter 1 Quarter 2 Quarter 3 Quarter 4 Metric
Speech/Babble 6 4.6* 4* 3.2* dB SNR
Time Compression 58 55* 53* 52* % Comp†
Competing Speaker 2.7 1.5* -0.2* -1.1* dB SNR
Auditory Memory 3.7 4* 4.1* 4.4* Diff. Level‡
Missing Word 3.4 3.2 3.1* 2.9* Adj. RT§
*p < 0.05
†Compression Ratio = a compression rate of 60 indicates that normal speech rate was compressed by 40%. ‡Memory Task Difficulty Level (see Table 3).
(6%) were significantly different from the baseline quarter, and Q4 was significantly different than Q2 (p < 0.05, ANOVA). Eighty-eight percent of the subjects had Q4 scores that were better than Q1 scores.
C
Coommppeettiinngg SSppeeaakkeerr TTaasskk
Figure 2C shows the mean change in performance (in dB SNR) for each of the CS training quarters, relative to the first quarter (baseline). A decrease in score on the plot indicates improvement. Error bars indicate the standard error of the mean. As designated with an asterisk, Q2 (-1.2 dB), Q3 (-2.9 dB), and Q4 (-3.8 dB) were significantly different from the baseline quarter, and Q4 and Q3 were significantly different than Q2 (p < 0.05). Eighty-four percent of the subjects had Q4 scores that were better than Q1 scores.
A
Auuddiittoorryy WWoorrkkiinngg MMeemmoorryy ((TTaarrggeett W
Woorrdd)) TTaasskk
Figure 2D shows the mean change in performance (in difficulty level) for each of the training quarters, relative to the first quarter (baseline). An increase in score indicates improvement. Error bars indicate the standard error of the mean. As designated with an asterisk, Q2 (.31 difficulty level), Q3 (.4 difficulty level), and Q4 (.650 difficulty level) were significantly different from the baseline quarter, and Q4 was significantly different than Q2 (p < 0.05). Eighty percent of the subjects had Q4 scores that were better than Q1 scores.
Figure 2. Mean change in on-task training per-formance for each of the training quarters. Quarter 1 has been normalized to reflect a 0 baseline. Aster-isks indicate significant improvements. (A)Mean change in speech in babble performance (in dB SNR). (B)Mean change in the time compressed speech per-formance (in percent compression). (C)Mean change in competing speaker performance (in dB SNR).(D) Mean change in target word (auditory memory) per-formance (in difficulty level). Positive numbers are plotted inversely; downward aiming bars are improve-ments in performance. (E) Mean change in missing word performance (in adjusted response time).
M
Miissssiinngg WWoorrdd TTaasskk
Figure 2E shows the mean change in MW performance calculated in adjusted response time for each of the training quarters, relative to the first quarter (baseline). This measure was calculated as the response time in seconds multiplied by the ratio of missing words correctly identified. A decrease in score indicates improvement. Error bars indicate the standard error of the mean. As designated with an asterisk, Q3 (-.381 sec) and Q4 (.520 sec) were significantly different from the baseline quarter, and Q4 was significantly different than Q2 (p < 0.05, ANOVA). Seventy-five percent of the subjects had Q4 scores that were better than Q1 scores.
Off-Task Outcome Measure Results Off-task outcome measures were assessed at the initial testing session (baseline) and at the end of training (approximately four weeks later) weeks for each group. Twenty-seven of the 33 subjects included in the control group subsequently completed the training as part of the crossover model; six subjects were unable to complete training for various reasons (illness, underestimation of time involved in testing, computer problems, and noncompliance). The trained group’s off-task outcome measure results were assessed prior to training, two weeks into the training, at the end of the four weeks’ training, and four weeks later.
OBJECTIVE MEASURES
QuickSIN
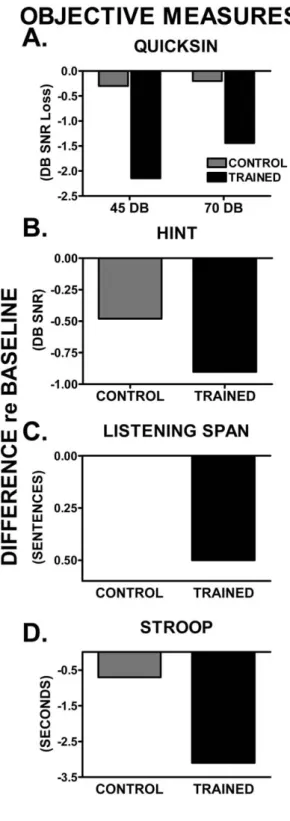
Figure 3A shows the average improvement in QuickSIN SNR loss for the control and trained groups. Scores depicted in Figure 3 indicate the average change between the post-training test session and the pretraining test session. Average scores were significantly improved for the 45 dB presentation of the QuickSIN (p < 0.001, Wilcoxon matched pairs) in the trained group (improvement of 2.2 dB SNR loss), but were not changed in the control group (.3 dB SNR loss). Results are similar in the case of the 70 dB presentation of the QuickSIN. The
Figure 3. Mean pre- versus post-training changes for objective outcome measures for the trained (black bars) and control (shaded bars). (A) Aver-age changes for 45 dB and 75 dB presentation of the QuickSIN.(B)Average change on the HINT. (C) Average change on the Listening Span test. Pos-itive numbers are plotted inversely; downward aiming bars are improvements in performance. (D) Average change on the Stroop Color Word test.
trained group showed average improvements of 1.5 dB SNR loss, a significant improvement (p < 0.001); however, the control group thresholds remained essentially unchanged (.2 dB SNR loss). Mean starting SNR losses were 9.3 and 6.7 for 45 and 70 dB, respectively. Eighty-five percent of the subjects showed improvement, and 46% of the subjects demonstrated clinically significant (at least 1.6 dB SNR) improvements for the 45 dB condition. Seventy-four percent of the subjects showed improvement, and 42% demonstrated clinically significant improvements (at least 1.6 dB SNR) for the 70 dB condition.
Hearing In Noise Test
Figure 3B shows results from the trained and control groups. While the trained group as a whole did show greater improvements (.9 dB) than the control group (.4 dB), the improvements were not significantly different (p < 0.43). Only 55% of the subjects showed improved scores.
Listening Span Test
A subset of subjects also completed the Listening Span test and the Stroop Color Word test (22 trained subjects and 12 control subjects). Figure 3C indicates the average improvement in Listening Span score for the control and the trained group. An increase in score indicates improved recall of words in this test. Average listening spans were significantly improved (p < 0.05) in the trained group (improvement of .5 sentences) but were not changed in the control group (0 sentences). Seventy-nine percent of the subjects showed improvement on the listening span test.
Stroop Color Word Test
In order to quantify whether speed of processing was improved (and cognitive interference diminished), the Stroop Color Word test (Uttl and Graf, 1997) was employed. There is also an auditory Stroop, but since the visual measure has been studied more extensively, we wanted to at least determine whether speed of processing in general was enhanced. Figure 3D indicates the average improvement in Stroop test score for the
control and trained groups. A decrease in score indicates improved speed on this test. Average scores were significantly improved (p < 0.05) in the trained group (improvement of 3.1 seconds) but were not significantly changed in the control group (.7 seconds). Seventy-six percent of the subjects showed improvement on the Stroop test.
SUBJECTIVE MEASURES
Hearing Handicap Inventory for the Elderly/Adults
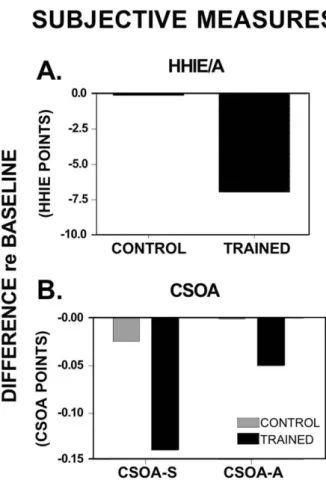
Figure 4A indicates the average change in HHIE/A score for the control and the trained group. A decrease in score indicates
Figure 4. Mean pre- versus post-training changes for subjective outcome measures for the trained (black bars) and control (shaded bars). (A) Average change in HHIE/A score. A decrease in score indicates a decrease in handicap.(B) Average change in CSOA. A decrease in score indicates an improvement in communication for both the strategies and attitudes subset.
a decrease in handicap. Scores reflect the difference between the post-training test session and the pretraining test session.
Average scores were significantly improved (p < 0.005) in the trained group (improvement of 7.5 points) but were not changed in the control group (.1 points). Seventy-six percent of the subjects showed improvement on the HHIE.
In addition, we calculated the average percent changein HHIE/A score for the control and the trained group. A decrease in score indicates a decrease in handicap. Average percent change scores were significantly improved (p < 0.005) in the trained group (improvement of 17%) but were not changed in the control group (.5%).
Communication Scale for Older Adults Figure 4B indicates the average change in CSOA scores for the control and the trained group. For both the strategies (CSOA-s) and attitudes (CSOA-a) subsets, a decrease in score indicates an improvement in communication.
The CSOA-s average scores were significantly improved (p < 0.005) in the trained group (improvement of .14) but were not changed in the control group (.03). Sixty-eight percent of the subjects showed improvement on the CSOA-s. Results were similar but not as robust for the CSOA-a subscale. The trained group showed an average 0.06 point improvement (p < 0.05); however, the control group showed essentially no change in the average score (0.0007). Sixty-three percent of the subjects showed improvement on the CSOA-a.
NON–HEARING AID USERS
I
t is also of interest to determine whethernon–hearing aid users showed similar performance to those wearing hearing aids. The nine subjects that did not use hearing aids generally were younger and had better acuity, word-recognition skills, and baseline test scores than the hearing aid users. As a group, these subjects showed significant improvements on the SB and CS but not as much as the hearing aid users. On the other on- and off-task measures, improvements were not significantly different from baseline (p < 0.05, paired t-test). This finding is likely
due to a ceiling effect, as well as the possibility that these subjects perceived less need for modifying communication strategies (although they did initially report sufficient difficulties to warrant inclusion in the study). Also to be considered is the small (9) sample size.
EFFECT SIZE
E
ffect size was calculated using the Cohen’s dbased on means of the pre- and post-sessions for the trained and control groups. The equation used was d= M1- M2/σpooled, where σpooled = ℘([σ12 + σ22 ) / 2] (Cohen,
1988). Treatment effect size was calculated for the trained group and the control group. Small effects were observed for nearly all outcome measures (with the exception of the HINT [.16] and CSOA-a [.02]) in the trained group, but no effects were observed in the control group. Specifically, effect sizes for the trained group were .4 on the HHIE and CSOA-s, .31 for the QuickSIN at 45 dB HL, and .23 for the QuickSIN at 70 dB HL. For all of the off-task pre- versus post-training measures, the effect sizes exceeded .2.
POST-TRAINING EFFECTS
A
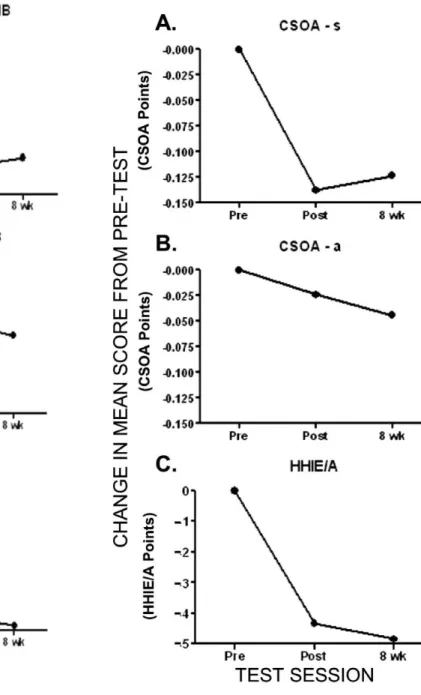
t the time of this writing, 42 of the 65trained subjects have completed QuickSIN and HINT at the eight week (four weeks post-training) follow-up. Thirty-one have completed the HHIE/A follow-up, and 31 have completed the CSOA follow-up. Due to geographic difficulties encountered getting some of the subjects to return for long-term follow-up testing, the decision was made to report the partial data obtained in this paper. Longer-term data will be the subject of a future manuscript. Figure 5 shows the maintenance of improvement for the objective tests. Figure 6 shows the maintenance of improvement for the subjective tests. For all measures, gains made during training were maintained at the eight-week evaluation.
DISCUSSION
A
n abundance of evidence exists showing that hearing aid use and additional aural rehabilitation services are beneficial for those with hearing impairment (Mulrow et al, 1990; Abrams et al, 1992; Mulrow et al, 1992;Beynon et al, 1997; Primeau, 1997). It also has been reported that participants with hearing aids enrolled in post-hearing-aid-fitting aural rehabilitation programs improve self-perceived hearing handicap (i.e., participation restriction) compared to hearing aid fitting alone (Alberti et al, 1984; Smaldino
and Smaldino, 1988; Abrams et al, 1992; Beynon et al, 1997; Primeau, 1997). In addition, these programs have been shown to increase hearing aid use and satisfaction (Brooks, 1979; Ross, 1987; Riko et al, 1990). Yet there is a relative paucity of post-hearing-aid-fitting aural rehabilitative services
Figure 5. Changes from pretest to end of training and eight weeks following the beginning of training (e.g., four weeks post-training). (A)QuickSIN 45 dB HL. (B)QuickSIN 70 dB HL. (C)HINT.
Figure 6. Changes from pretest to end of training and eight weeks following the beginning of training (e.g., four weeks post-training). (A) HHIE/A. (B) CSOA-s.(C) CSOA-a.
(Abrahamson, 1997). Despite these facts, it is not reasonable to expect audiologists to integrate aural rehabilitation procedures into their armamentarium unless evidence exists indicating both benefit and efficiency.
In the current investigation, trained subjects showed significant improvements on all on-task measures, as might be expected. It is likely that some of the initial performance changes were simply due to learning the task at hand. By averaging the first quarter performance and using this score as the baseline, we can ensure that the changes in Q2, Q3, and Q4 are not due to procedural but, rather, perceptual learning. For each of the on-task measures, statistically significant changes were shown by the end of the second week. Additional learning continued to occur through the fourth week of training as evidenced by the statistical improvement shown in Q4.
Of greater interest, because of critical necessity for generalization, are the changes shown on the off-task measures. All of the measures, both objective and subjective, with the exception of the HINT, showed statistically significant improvements for the trained group but no change for the control group.
Regarding the QuickSIN, in the current study, average thresholds were significantly improved in the trained group but were not significantly changed in the control group. Furthermore, approximately 45% of the trained subjects, as opposed to 0% of the untrained subjects, showed clinically significant improved scores on the QuickSIN. It is impossible to separate the hearing component from the listening component on a task like the QuickSIN; however, since LACE is designed to enhance listening, it does imply that ability to understand speech in noise can be enhanced on the basis of improved listening skills.
Given the QuickSIN findings, the lack of benefit from training on the HINT was somewhat surprising. Although the HINT has been deemed a reliable measure in the literature (Nilsson et al, 1994), the higher variability of scores measured in this study may have rendered the HINT a less sensitive measure than the QuickSIN. For example, consider that the HINT was the only measure (objective or subjective) for which the untrained group showed substantial, albeit statistically insignificant, differences between baseline and post-testing. It is also possible
that methodological differences, such as noise type (continuous versus babble), may have been a factor for patients with digital noise reduction hearing aids.
Regarding the subjective tests, both the HHIE and the CSOA pre- versus post-training differences were statistically significant. There is a difference, however, between statistically significant and clinically significant. It is quite difficult to achieve clinically significant changes on the HHIE if one strictly utilizes the criterion established using a paper and pencil administration (the approach used in the current study) by Weinstein et al (1986). They reported a mean HHIE total score for initial testing of 57.4 with standard deviations of 30.9, and at retest their reported mean was 50.8 with standard deviations of 31.2. Given this extremely high variability, they indicate that the change considered clinically significant is 36 points. Using this criterion, only two of our subjects achieved this difference. This may be related to the fact that the subject population in this study was fundamentally different than that of the Weinstein et al study. Subjects in the LACE study were younger (LACE: mean age of 63 years; Weinstein et al: mean age of 80 years), utilized amplification (LACE: 84% wore hearing aids; Weinstein et al: 0% wore hearing aids), and were less handicapped (LACE: mean pre-training HHIE was 36; Weinstein et al: mean initial score was 57.4). A different picture is seen when examining the CSOA, which was another subjective measure used in this investigation. Kaplan et al (1997) indicated that on the “five point” CSOA, improvements of greater than 0.04 indicated “benefit” on the strategies subscale, while on the CSOA, improvements of greater than 0.11 indicated “benefit” on the attitude subscale. The trained subjects in the current study showed a mean improvement of 0.14 on the s and 0.06 on the CSOA-a. Twenty-six of the 58 trained subjects (45%) showed beneficial improvement on the strategies subscale, and 25 of 58 (43%) showed beneficial improvement on the attitude subscale. Although differences were seen in the magnitude of the mean improvements on the CSOA subscales, the percentage of individuals obtaining significant benefit was similar. It is interesting to note that Kaplan et al (1997) reported similar percentages of subjects showing benefits on the CSOA following completion of a one-week-long group
aural rehabilitation program.
Limitations
While these results look extremely encouraging, caution should be taken when generalizing to other subject populations. For example, due to the nature of the enrollment procedure, the majority of subjects were computer users. Additionally, even though the experimental population presented with a moderate-to-severe SNR loss based on QuickSIN results, their perceived handicap, based on the HHIE scores of subjects, was less than might be expected for this degree of loss, implying lesser social impact of the hearing loss on this population. Overall, subjects were willing participants, relatively positive, active, and experienced hearing aid users. Further research on individuals with less positive attitudes toward hearing loss, less active lifestyles, and less experience with amplification may prove beneficial.
It is not possible to determine what improvements in performance reflected changes in central auditory regions of the brain as opposed to behavioral adaptations. Electrophysiological measures should be considered in future investigations to shed light on this matter.
The current results do not provide information regarding long-term effects of LACE training. Follow-up measures obtained at 3, 6, and 12 months will be important to assess maintenance of training effects or benefits. However, the data obtained one month post-training imply that effects do last longer than the initial training period. As with any training program, one can question whether positive outcomes were a result of completing specific training parameters or merely a function of patient practice. These questions are certainly worthy of investigation; however, any process that will achieve the end result of increasing confidence, helping to focus attention, enhancing listening skills, and engaging the patient in the fitting process is critical regardless of the manner in which it is achieved. The objective is to use any means possible to attain better auditory communication skills, with or without amplification. Certainly future versions of LACE as well as other aural rehabilitation
programs will utilize more effective training parameters. The important component at this time, however, is to convince both patients and audiologists of the importance of training and to provide them with a means of achieving this goal.
C
Cuurrrreenntt SSttaattuuss ooff LLAACCEE
LACE is now currently available with certain significant improvements over the format reported in this paper. For example, when completing LACE training, the patient will receive feedback directly related to the performance on each training task. This information is presented in a graphic format so that changes from baseline performance are easily observed. Additionally, the audiologist has easy remote access to monitor patient results via a server to which the patient automatically uploads data at the end of each training session. This monitoring provides the audiologist with the option to contact the patient for counseling purposes. LACE also will be available in a stand-alone hardware interface for patients without access to a computer. Future versions will include alternate subject topics, as well as additional languages. Additionally, the audiologist will have the ability to manipulate the training protocol based on the needs and skills of the individual patient.
B
Baarrrriieerrss ttoo WWiiddeesspprreeaadd IImmpplleemmeennttaattiioonn It is likely that audiologists will face certain barriers to comprehensive acceptance and implementation of LACE or other computer-based training program. A lack of computer skills on the part of patients and/or audiologists initially may render this type of training intimidating. LACE training requires regular periods of focus and active participation that patients may not believe is necessary. Additionally, the cost of hearing aids is such that patients erroneously may believe that the devices alone should provide enough benefit to justify the expense.
Despite the high motivation and willingness of the subjects in this project, over 20% initially enrolled in the project dropped out of the study. It is clear that not all patients will be willing to put forth the time or effort required to complete this, or any, rehabilitation program beyond the purchase
of hearing aids. This cannot be blamed entirely on patients, however. Some audiologists may be reluctant to require patients to add further effort beyond the purchase of hearing devices.
CONCLUSIONS
A
s a profession, audiology must adopt an adamant position that there is more to communication than access to acoustic information (e.g., hearing). This will require a change in the post-fitting procedures and a refinement of counseling skills, as well as an effective and cost-effective remediation plan. It is the authors’ hope that LACE may be the first step toward a change in the attitudes and practices of audiologists.This initial study of a home-based computerized training program shows that significant improvements are observed not only in the training tasks used in the program, but also on subjective and objective outcome measures. The changes seen in this study are due solely to listening and communication training, rather than the introduction of amplification or a change in technology.
Many unresolved questions remain. What are the best training parameters and modes? Will training generalize to “real-life” experiences? Will training reduce the return of hearing aids when used in the trial period? Will training improve the acceptance of hearing aids? Will results be magnified when training is introduced in conjunction with introduction or changes to amplification? Will training last over extended time periods? Will patients consent to do home training? Will audiologists be resolute in recommending training? The answers to these questions will solidify the place for computerized listening training and aural rehabilitation in the audiological practice.
Acknowledgments. The authors would like to acknowledge the immeasurable assistance of Monica Miller in collecting data, creating graphs, and pro-viding suggestions. We want to acknowledge the clinics participating in data collection including Pacific Hearing Service, Rehder Hearing Clinic, University of Louisville, and Audiologic Consultants of Atlanta. The LACE™ program itself was produced by Neurotone, Inc., of Redwood City, CA.
REFERENCES
Abrahamson J. (1997) Patient education and peer interaction facilitate hearing aid adjustment. In: Kochkin S, Strom KE, eds. Counseling. Vol. 1 of High performance hearing solutions. Hear Rev 4(1)(Suppl.):19–22.
Abrams H, Hnath-Chisolm T, Guerreiro S, Ritterman S. (1992) The effects of intervention strategy on self-perception of hearing handicap. Ear Hear13:371–377. Alberti PW, Pichora-Fuller MK, Corbin H, Riko K. (1984) Aural rehabilitation in a teaching hospital: evaluation and results. Ann Otol Rhinol Laryngol 93:589–594.
Beynon G, Thornton F, Poole C. (1997) A randomized, controlled trial of the efficacy of a communication course for first time hearing aid users. Br J Audiol 31(5):345–351.
Blake DT, Strata F, Churchland AK, Merzenich MM. (2002) Neural correlates of instrumental learning in primary auditory cortex. Proc Natl Acad Sci USA 99(15):10114–10119.
Boothroyd A. (1987) CASPER: a computer assisted system for speech perception testing and training. In: Proceedings of the 10th Annual Conference of the Rehabilitation Society of North America. Washington, DC: Association for Advancement of Rehabilitation Technology, 734–736.
Brooks D. (1979) Counseling and its effect on hear-ing aid use. Scand Audiol8:101–107.
Chermak GD, Musiek FE. (2002) Auditory training: principles and approaches for remediating and man-aging auditory processing disorders. Semin Hear 23(4):97–308.
Ciuffreda KJ. (2002) The scientific basis for and effi-cacy of optometric vision therapy in nonstrabismic accommodative and vergence disorders. Optometry 73(12):735–762.
Cohen J. (1988) Statistical Power Analysis for the Behavioral Sciences.2nd ed. Hillsdale, NJ: Erlbaum. Cox R, Alexander G. (1995) The Abbreviated Profile of Hearing Aid Benefit. Ear Hear16(2):176–186. Cox R, Alexander G. (1999) Measuring satisfaction with amplification in daily life: the SADL scale. Ear Hear20(4):306–320.
Dempsey JJ, Levitt H, Josephson J, Porrazzo J. (1992) Computer-assisted tracking simulation (CATS). J Acoust Soc Am92(2):701–710.
Gagne J, Dinon D, Parsons J. (1991) An evaluation of CAST: a computer aided speechreading training program.J Speech Hear Res 34:213–221.
Gordon-Salant S, Fitzgibbons PJ. (1997) Selected cog-nitive factors and speech recognition performance among young and elderly listeners. J Speech Hear Res40:423–431.
Greenwald RR, Jerger J. (2001) Aging affects hemi-spheric asymmetry on a competing speech task. J Am Acad Audiol12(4):167–173.