Internet growth: Is there a “Moore’s Law” for data traffic?
K. G. Coffman and A. M. OdlyzkoAT&T Labs - Research
[email protected], [email protected] Preliminary version, July 11, 2000
Abstract
Internet traffic is approximately doubling each year. This growth rate applies not only to the entire Internet, but to a large range of individual institutions. For a few places we have records going back several years that exhibit this regular rate of growth. Even when there are no obvious bottlenecks, traffic tends not to grow much faster. This reflects complicated interactions of technology, economics, and sociology, similar to those that have produced “Moore’s Law” in semiconductors.
A doubling of traffic each year represents extremely fast growth, much faster than the increases in other communication services. If it continues, data traffic will surpass voice traffic around the year 2002. However, this rate of growth is slower than the frequently heard claims of a doubling of traffic every three or four months. Such spectacular growth rates apparently did prevail over a two-year period 1995-6. Ever since, though, growth appears to have reverted to the Internet’s historical pattern of a single doubling each year.
Progress in transmission technology appears sufficient to double network capacity each year for about the next decade. However, traffic growth faster than a tripling each year could probably not be sustained for more than a few years. Since computing and storage capacities will also be growing, as predicted by the versions of “Moore’s Law” appropriate for those technologies, we can expect demand for data transmission to continue increasing. A doubling in Internet traffic each year appears a likely outcome.
If Internet traffic continues to double each year, we will have yet another form of “Moore’s Law.” Such a growth rate would have several important implications. In the intermediate run, there would be neither a clear “bandwidth glut” nor a “bandwidth scarcity,” but a more balanced situation, with supply and demand growing at comparable rates. Also, computer and network architectures would be strongly affected, since most data would stay local. Programs such as Napster would play an increasingly important role. Transmission would likely continue to be dominated by file transfers, not by real time streaming media.
Internet growth: Is there a “Moore’s Law” for data traffic?
K. G. Coffman and A. M. OdlyzkoAT&T Labs - Research
[email protected], [email protected] Preliminary version, July 11, 2000.
1. Introduction
An earlier paper [CoffmanO] estimated the sizes of telecommunications networks in the U.S. and the traffic they carried. (We concentrated on the U.S. because of lack of data about other countries, and because the disparate development stages of their communications infrastructures make cross-country comparisons difficult.) Our conclusion was that by year-end 1997, the voice network was still the largest in terms of bandwidth, although data networks were almost as large. On the other hand, the traffic carried by the voice network was far larger than that of the data networks. These estimates are summarized in Table 1.1, with the units of measurement being terabytes per month. (A voice call for the purposes of this measurement was counted as two 64 Kb/s streams of data, and fax and modem calls carried on the switched long distance network were counted as voice. For details, see [CoffmanO].)
Table 1.1. Traffic on U.S. long distance networks, year-end 1997.
network traffic (TB/month)
US voice 40,000
Internet 2,500 - 4,000
other public data networks 500
private line 3,000 - 5,000
We also considered the growth rates of various networks. While reliable information had long been available for most networks (with increases on the order of 10% a year for the voice network), very little was known about the Internet. There were many claims of huge growth rates, usually of a dou-bling of traffic every three or four months, which corresponds to annual growth of around 1,000%. We confirmed that such growth rates did hold during 1995 and 1996. (More precisely, the traffic carried by the Internet backbones grew by a cumulative factor of 100 between year-end 1994 and year-end 1996. We did not find precise estimates for traffic during those two years, so do not know how growth was distributed within those two years.) However, we also showed that growth had slowed down to
about 100% during 1997. Remarkably enough, that was almost exactly the growth rate registered by the Internet backbone in the early 1990s (see [CoffmanO] for data), and is close to other measures of growth rates during earlier periods (cf. [CoffmanO, Paxson]). In fact, if we assume that the traffic on the initial ARPANET links that were activated in the summer of 1969 amounted to a few thousand bytes per month, we find that the average growth rate in traffic has been very close to 100% a year for the entire 30-year history of the Internet and its predecessors. However, growth rates varied tremendously over that period as the initially small research networks evolved. The steady annual doubling of traffic only appeared in the early 1990s, when the NSFNet backbone grew to a significant size in both traffic and number of participants.
Table 1.2. Traffic on U.S. long distance networks, year-end 1999.
network traffic (TB/month)
US voice 48,000
Internet 10,000 - 16,000
other public data networks 2,000
private line 5,000 - 8,500
Our estimates for year-end 1999 are shown in Table 1.2. As before, the estimates for the voice, private line, and other public data networks (primarily ATM and Frame Relay) are uncontroversial, consistent with other publicly available sources. On the other hand, the estimates for the public Internet are much less certain. As we explain in Section 3, there is less information today than was available a couple of years ago about different carriers’ IP networks, either about their sizes or the traffic they carry. Therefore our current estimates are based less on solid data than those of [CoffmanO], and more on extrapolating from the circumstantial evidence we have accumulated.
Much of this paper is devoted to a study of historical growth rates in Internet traffic. We find that for a variety of institutions, some with abundant bandwidth, others with congested links, traffic tends to about double each year. Even when the bandwidth of congested links is increased, in most cases traffic does not explode in the much-feared “tragedy of the commons” phenomenon [GuptaSW]. Instead, it continues growing at about 100% per year. Malicious behavior is a smaller problem than is often feared. What dominates is the time it takes for new applications and processes to be widely adopted. That, and technological progress, combine to produce the “Moore’s Law” of data traffic, in a process similar to that operating in other areas.
Since the Internet has been growing at about 100% a year for its entire history, one can then extrapolate this growth rate into the future, and predict that traffic will continue to double each year. We prefer to do more than that, and consider how fast supply and demand are likely to grow. Those considerations lead us to the same conclusion as the simple extrapolation, namely that traffic is likely to about double each year.
Much is written about the near infinite capacity of fiber, and of the upcoming bandwidth glut (or at least the overabundance of available fiber). For example, the introduction to [Gilder2] talks of “the coming world of cheap, unlimited bandwidth.” In the US alone there are now over half a dozen long haul carriers that either have or will have very substantial national fiber networks. The conventional wisdom is that the exploding increase in Internet traffic is the main driver for the expansion of these networks. It also seems to be implied that the “ever increasing” capacities of WDM (wavelength division multiplexing) systems (both in terms of the number of channels and the individual channel rates) coupled with this forecasted “fiber glut” will result in the national networks being easily able to accommodate whatever growth rate the Internet throws at it. We do not think the carrying capacity of the network, at least the long haul national backbone network(s), can or will grow to accommodate arbitrary traffic growth rates. In fact we believe that if traffic grows by factors of more than two or three a year for any sustained period, the transport backbones are likely to become a very serious bottleneck. However, 100% annual growth rates appear to be realizable without unusually large new investments for the foreseeable future (which means at least five years). We explore this issue in detail in Section 5. The demand for data transmission is potentially insatiable. As we show in Section 6, there is already so much data stored on hard disks (and much more on magnetic tapes and optical drives) that only a small fraction of it can traverse the long distance networks without saturating them. Furthermore, data storage capacities are about doubling each year. Hence the evolution of computer and network architectures will come from the subtle interaction of supply and demand, which will be mediated by economics and sociology. It appears that an approximate doubling of Internet traffic each year is a reasonable course of evolution for the Internet, even though there may be brief periods of higher or lower growth rates.
A doubling of Internet traffic each year is not the doubling every 100 days that is often claimed. However, it is extremely rapid by comparison with older communication technologies. Still, since other technologies (storage and processing power) will also be growing, many expectations for radical changes will be disappointed. For example, there have been predictions that the growing bandwidth of long distance networks would lead to dramatic changes.
[The] change in the relationship between the bandwidth of networks and the bandwidth of computers will transform the architecture of information technology. As Robert Lucky of Bellcore [recently renamed Telcordia] puts it, “Perhaps we should transmit signals thou-sands of miles to avoid even the simplest processing functions.”
[Gilder2]
The projections of this paper show that this is very unlikely. Bandwidth will continue to be in short supply compared to storage. Further, the delays forced by speed of light limitations as well as commu-nications overhead will mean that most data will be processed locally. We will have to take processing to the data, not vice versa.
For decades, the most frequent predictions for data networks were that eventually they would be dominated by traffic such as voice and video. That has not happened yet. If the doubling of traffic each year continues, it will not be true in the long run either, simply since there will be far more data traffic than needed to handle real time streaming transmissions.
Section 2 outlines the wide range of commonly expressed opinions about the growth rate of the Internet. Section 3, the bulk of this paper, is then devoted to an examination of the historical data we have been able to find. Section 4 discusses the disruptive innovations of the past, such as browsers, and of the present (primarily Napster and related programs), and the effects they have on traffic statis-tics. Section 5 outlines the history and projections for advances in photonic transmission. Section 6 discusses the potential demand for data bandwidth. Section 7 concludes that growth in data traffic is determined by factors similar to those that produce the standard “Moore’s laws” in other areas. Section 8 has some final concluding remarks.
2. Skeptics and cheerleaders
There continue to be voices skeptical of the growth prospects of the Internet. In particular, A. Michael Noll has been a persistent naysayer. Back in 1991, he estimated what the maximal feasible volume of data transfers could be (pp. 171–175 of [Noll1]). Since that time, the volume of data traffic has surged far beyond his original prediction. The main reason for this development is that he did not foresee the arrival of graphics-rich content, such as Web pages. His estimates assumed only text would be transmitted, and all of it would be processed by people. While that prediction has turned out to be wrong, he continues predicting that data traffic will not exceed voice traffic unless multimedia begins
dominating the Internet [Noll2]. While our estimates do confirm that there is still more voice traffic than data traffic, Noll’s estimates for data traffic are far too conservative. As an example, one can examine the publicly available statistics for data traffic at the University of Southern California, where Noll is a professor. These statistics are available at http://foo.usc.edu/netstats , and in early 1999 showed a considerably higher volume of data flow than Noll estimated in [Noll2]. (By early 2000, the volume of data flow at USC had grown by about 70%, from an average of about 20 Mb/s to the campus and 10 Mb/s out from the campus to about 30 Mb/s in and 20 Mb/s out.)
While there are some skeptics about the prospects for the Internet, there are vastly larger ranks of people who claim astronomical growth rates. However, they invariably talk only of rates of increase, and never cite precise verifiable figures. The most common claim one hears is that “Internet traffic is doubling every three or four months.” As was pointed out in [CoffmanO], many of these claims appear to trace back to statements of John Sidgmore of MCI WorldCom’s UUNet or his colleagues. A March 2000 news report [Howe], for example, cites MCI WorldCom president Bernard J. Ebbers as saying that his company “has recently had to add capacity to its global network at a rate of 800 percent annually to keep up with soaring demand for Net traffic.” Yet the February 10, 2000 press release by MCI WorldCom that accompanied the earnings report for the fourth quarter of 1999 refers to “[g]ains in data services ... measured by an 87 percent increase in Voice Grade Equivalents (VGEs), which capture the volume of local data circuits.” The two statements may refer to different parts of the MCI WorldCom data network. However, eventually capacities of long distance links are unlikely to grow much faster than those of local ones. Hence we are inclined to believe that the “87 percent increase” of the official press release describes overall growth more accurately. Revenue increases from data services for MCI WorldCom (reported in their audited financial statements) are also far more consistent with annual growth rates of 100 percent than 800 percent.
It could be that the phrase “doubling of Internet traffic every three [or four] months” has lost its literal meaning. Perhaps it is being used as a figure of speech, in the way that many people use “ex-ponential growth” (which in mathematics has a precise meaning) to describe any fast growth. There are just too many examples where such statements are either implausible or even demonstrably incor-rect. For example, Keith Mitchell, executive chairman of LINX, the London Internet Exchange, Ltd., is quoted in [Jander] as saying in March, 2000, that “[LINX] traffic doubles every hundred days or so.” This rate of growth would increase traffic over a year by a factor of 12. Yet an examination of the publicly available statistics for LINX (at http://www2.linx.net/info/ ) showed that between the end of March, 1999, and the end of March, 2000, traffic through LINX increased by a factor of about 3 (from
about 360 Mb/s to 1.1 Gb/s). That is certainly fast, but corresponds to a doubling of traffic every 230 days, not every 100 days. (There is further discussion of LINX in the next section.)
Whether Internet traffic doubles every three months or just once a year has huge consequences for network design as well as the telecommunications equipment industry. Much of the excitement about and funding for novel technologies appear to be based on expectations of unrealistically high growth rates (cf. [Bruno]).
3. Historical record
The online data for LINX does show growth of about 200% from early 1999 to early 2000, and one can find other examples of such high growth rates, and sometimes even higher ones. However, there are also numerous examples of much more slowly growing links. In this section we present growth rates from a variety of sources, and attempt to put them into context. Our general conclusion is that Internet traffic appears to be growing at about 100% a year.
Our presentation is in terms of a narrative. It would be much more effective to have a table or chart combining data for a variety of institutions. Unfortunately the statistics we have collected are not sufficiently systematic to do this. They come from a variety of sources in many formats and for different periods. We concentrate on large and stable institutions for which we have more than a year’s worth of data. For some links, one can obtain detailed statistics going back some years from the Web page we indicate. For most, though, the public Web page shows only the graphs produced by the MRTG tool [MRTG]. (At some institutions, MRTG is beginning to be partially displaced by a more modern program, RDDtool [RDD].) This excellent program displays the exact averages of in and out traffic over the previous day, week, month, and year, and also produces graphs with the traffic profiles for those periods. This means that by downloading one of the MRTG pages, one can estimate the average traffic a year earlier. It is in principle possible to decode the .gif files produced by MRTG to obtain more precise values, but we have not done so, and have relied on “eye-balling” the graphs to estimate traffic. As an example, consider Onvoy, the main ISP in Minnesota. Its growth trends are discussed later in this section. We have exact MRTG readings and graphs from October 1999 and June 2000. That means we have exact traffic data for those two months, and can estimate traffic back to October 1998, but no further. In a few cases we have obtained more precise statistics from network administrators.
As a brief note on conversion factors, traffic that averages 100 Mb/s is equivalent to about 30 TB/month. (It is 32.4 TB for a 30-day month, but such precision is excessive given the uncertainties in the data we have.)
When the NSF Internet backbone was phased out in early 1995, it was widely claimed that most of the Internet backbone traffic was going through the Network Access Points or NAPs, which tended to provide decent statistics on their traffic. Currently it is thought that only a small fraction of back-bone traffic goes through the NAPs, while most goes through private peering connections. Further-more, NAP statistics are either no longer available, or not as reliable. Here we just mention a few cases. The data for the Chicago NAP from the summer of 1996 through May of 1999 is available at http://nap.aads.net/ nap-stat/ . From August of 1996 to very early in 1997 (February) the traf-fic profile was moderately flat. However, from February 1997 until May 1999 there was a fairly consistent growth that resulted in about a 12 fold increase in traffic, to a final level of about 1.2 Gb/s. A twelve-fold increase in a little over 2 years implies an annual growth rate of around 3.5. On the other hand, a different picture emerges when we examine the statistics for MAE-East (which a few years ago was often claimed to handle a third of all Internet traffic). They are available at http://www.mae.net/east/stats.html. In March of 2000, the average traffic there was about 1.5 Gb/s. That is the same traffic as this NAP handled in March 1998 (and twice what it handled in March 1997). Thus practically nothing can be concluded about current growth rates of Internet traffic by examining the statistics of the public NAPs in the U.S.
LINX, the London Internet exchange, was mentioned already in Section 2. A July 1999 LINX press release announced that it had achieved a traffic level of 1.0 Gb/s, up from 180 Mb/s a year earlier, for a growth rate of 455%. However, no definition was offered how these “traffic levels” were defined. An examination of the MRTG graphs at http://www2.linx.net/info/ showed that the average traffic (averaged over a whole month) went from about 200 Mb/s in September 1998 to 360 Mb/s in March 1999, to 1.1 Gb/s by the end of 1999, and has been almost constant at 1.1 Gb/s in the first six months of 2000.
AMS-IX, the Amsterdam Internet Exchange, http://www.ams-ix.net/ , has shown growth by a fac-tor of 4.6 from June 1999 to May 2000, to a level of about 800 Mb/s. Several smaller exchanges, espe-cially in countries that used to lag in Internet penetration, show similarly high growth rates. For exam-ple, the Slovak Internet eXchange, http://www.six.sk/mrtg/switch.six.sk.a.html, increased its traffic approximately 4-fold in the year ending June 2000, to an average level of about 40 Mb/s. HKIX, a com-mercial exchange created by The Chinese University of Hong Kong, http://www.hkix.net (with aggre-gate statistics available more directly at http://www.cuhk.edu.hk/hkix/stat/aggt/hkix-aggreaggre-gate.html), doubled its traffic in 1999, and then tripled it in the first six months of 2000 to an average of about 250 Mb/s. Even BNIX, http://www.belnet.be/bnix/, located in Belgium, which already has extensive
Internet deployment, experienced a 5-fold rise from middle of 1999 to the middle of 2000, to a level of 120 Mb/s. On the other hand, INEX, an Irish exchange, http://www.inex.ie , saw its traffic increase only from about 3 Mb/s in June 1999 to about 5 Mb/s in June 2000. SIX, the Seattle Internet Exchange, http://www.altopia.com/six , saw approximately 150% growth in the 12 months to June 2000, to a level of about 50 Mb/s. FICIX, the Finnish exchange, http://www.ficix.fi/ , tripled its traffic in a bit less than two years, from an average of about 70 Mb/s in September 1998 to about 210 Mb/s in June 2000.
Traffic interchange statistics are hard to interpret, unless one has data for most exchanges, which we do not. Much of the growth one sees can come from ISPs moving from one exchange to another, moving their traffic from one exchange to another, or else coming to an exchange in preference to buying transit from another ISP. At LINX, a large part of its growth is almost surely caused by more ISPs exchanging their traffic there. Between March 1999, and March 2000, the ranks of ISPs that are members of LINX have grown by about two thirds, based on the data on the LINX home page. Hence the average per-member traffic through LINX may have increased only around 120% during that year. Unfortunately the largest ISPs do not release reliable statistics. This situation was better even a couple of years ago. For example, MCI used to publish precise data about the traffic volumes on their Internet backbone. Even though they were among the first ISPs to stop providing official network maps, one could obtain good estimates of the MCI Internet backbone capacity from Vint Cerf’s presentations. These sources dried up when MCI was acquired by WorldCom, and the backbone was sold to Cable & Wireless. As was noted in [CoffmanO], the traffic growth rate for that backbone had been in the range of 100% a year before the change.
Today, one can obtain some idea of the sizes (but not traffic) of various ISP networks through the backbone maps available at [Boardwatch]. However, even those are not too reliable.
The only large ISP to provide detailed network statistics is AboveNet, at http://www.above.net/traffic/. We have recorded the MRTG data for AboveNet for March 1999, June 1999, February 2000, and June 2000. The average utilizations of the links in the AboveNet long-haul backbone during those four months were 18%, 16%, 29%, and 12%, respectively. (The large drop between February and June 2000 was caused by deployment of massive new capacity, including four OC48s. One of the reasons we concentrate on traffic and not network sizes in this paper is that extensive new capacity is being deployed at an irregular schedule, and is often lightly utilized. Thus it is hard to obtain an accurate picture of the evolution of network capacity.) If we just add up the volumes for each link separately, we find that traffic quadrupled in 15 months between March 1999 and June 2000. This represents an
annual growth rate of about 200%. However, this figure has to be treated with caution, as actual traffic almost surely increased less than 200%. During these 15 months, AboveNet expanded geographically, with links to Japan and Europe, so that at the end it probably carried packets over more hops than before. Since we are interested in end-to-end traffic as seen by customers, we have to deflate the sum of traffic volumes seen on separate backbone links by the average number of hops that a packet makes over the backbones (perhaps around 3). (In particular, the sum of the volumes over all the links in the AboveNet network in June 2000, which comes to 1,400 TB, has to be deflated by this average number of hops if one desires to compare it to the volumes in Table 1.2.)
Even when we do have data for a single carrier, such as AboveNet, some of the growth we see there may be coming from gains in market share, both from gains within a geographical region, and from greater geographical reach, and not from general growth in the market.
Onvoy, http://www.onvoy.net has evolved from the research and educational MRNET to the
largest commercial ISP in Minnesota. Its traffic statistics are available at http://graphs.onvoy.com/infrastructure and over the last two years show an annual growth rate in traffic of only about 50%, to a level in June
2000 of 155 Mb/s from the Internet and 100 Mb/s towards the Internet.
Another example is provided by Telstra, the dominant Australian carrier, which has operated within the same geographical region, and whose traffic growth rate may be an approximation to that of the en-tire Australian market. Telstra does not provide traffic statistics, but does present network maps at http://www.telstra.net . In March 2000, they showed bandwidth of 592 Mb/s to the U.S. (and far smaller bandwidth to other countries). In comparison, in January 1998, these maps showed total band-width of U.S. connections of 146 Mb/s, corresponding to almost exact doubling of capacity in each of the intervening two years. (By late June 2000, the bandwidth to the U.S. had shrunk to 515 Mb/s, even including the 45 Mb/s link through New Zealand. We do not know what led to this decrease. One can speculate that the substantial upgrade of the domestic Telstra network may have led Australian content providers to bring their Web sites back to Australia. It might also have been caused by deployment of content delivery servers from Akamai, Digital Island, or their competitors, which reduced the need for trans-Pacific transmissions. However, this is just speculation.)
The Telstra data provides a rough check on our estimates for Internet backbone traffic. According to public statements by Telstra officials [Taggart], 60% of Telstra Internet traffic is with the U.S. Let us assume that the links from the U.S. to Australia are run at an average of 60% of capacity. (This is rather heavy loading, but not unprecedented on expensive links, cf. Table 3.3.) Let us assume that the reverse direction is operated at an average of 20% of capacity, which seems reasonable by comparison
with the data in Table 3.2. Then we find that Telstra receives about 200 TB/month from the U.S., and transmits about 70 TB/month. If this represents 60% of Telstra’s Internet traffic, then (without making allowances for other carriers or for the likelihood that some of the traffic on the link to the U.S. is destined for or comes from other countries) we obtain an estimate of about 500 TB/month for all of Australia’s Internet traffic. Since the U.S. has about 15 times as many inhabitants as Australia, is somewhat richer on a per capita basis, and has better developed Internet infrastructure and lower prices, the estimates in Table 1.2 appear in the right range.
For the general market, the growth in usage by residential customers, at least in the U.S., has slowed down. Their ranks are growing at only about 30% per year, and the time spent online is growing at under 20% per year (cf. [Odlyzko3]). Thus the traffic they generate (about 5 Kb/s from the Internet towards their PCs when they are online) is increasing less than 60% a year. In other countries, the pattern is different. For example, in France in 1999, the number of residential Internet users grew by almost 150%, just as it had done the previous year, while the average time online stayed constant [Odlyzko3]. Therefore it is likely that French residential traffic grew by a factor of 2.5.
The traffic from residential U.S. customers may very well increase at a faster rate in the near future. The growth in the number of users is likely to diminish, as we reach saturation. (You cannot double the ranks of subscribers if more than half the people are already signed up!) However, broadband access, in the shape of cable modems and DSL (and to a lesser extent fixed wireless links) will stimulate usage. The evidence so far is that users who switch to cable modem or DSL access increase their time online by 50 to 100%, and the total volume of data they download per month by factors of 5 to 10. A 5 or 10-fold growth in data traffic would correspond to a doubling of traffic every four months if everyone were to switch to such broadband access in a year. However, that is not going to happen. At the end of 1999, there were about 3 million households in the U.S. with broadband access. The most ambitious projections for cable modem and DSL access call for about 13 million households to have such links in 2003, and between 50-60 million in the year 2007. That is approximately a doubling each year. The traffic from a typical residential broadband customer is likely to grow beyond the level we see today, as more content becomes available, and especially as more content that requires high bandwidth is produced. Still, it is hard to see average traffic per customer among those with broadband connections growing at more than 50% a year, say. Together with a doubling in the ranks of such customers, this might produce a tripling of traffic from this source. Since the ranks of customers with regular modems are unlikely to decrease much, if any, and since their traffic dominates, it appears that we most likely will see total residential customer traffic growing no faster than 200% per year, and probably closer to
100% per year. (Access from information appliances, which are forecast to proliferate, is unlikely to have a major impact on total traffic, since the mobile radio link will continue to have small bandwidth compared to wired connections.)
Growth in traffic can be broken down into growth in the number of traffic sources, and growth in traffic per source. For LINX, much of the increase in traffic may be coming from an increase in member ISPs. For individual ISPs, much of the increase in traffic may also be coming from new customers. Yet in the end, that kind of growth is limited, as the market gets saturated. We will concentrate in the rest of this section on rates of growth in traffic from stable sources. Now nothing is completely stable, as the number of devices per person is likely to continue growing, especially with the advent of information appliances and wireless data transmission. Hence we will consider growth in traffic from large institutions that are already well wired, such as corporations and universities. Most corporations do not publicize information about their network traffic, and many do not even collect it. However, there are some exceptions. For example, Lew Platt, the former CEO of Hewlett-Packard, used to regularly cite the HP Intranet in his presentations. The last such report, dated September 7, 1998, and available at http://www.hp.com/financials/textonly/personnel/ceo/rules.html , stated that this network carried 20 TB/month, and a comparison with previous reports shows that this volume of traffic had been doubling each year for at least the previous two years. (As an interesting point of comparison, the entire NSFNet Internet backbone carried 15 TB/month at its peak at the end of 1994.) Several other corporations have provided us with data showing similar rates of growth for their Intranet traffic, although some indicated their growth has slowed down, and a few have had practically no growth at all recently.
Internal corporate traffic appears to be growing much more slowly than the public Internet traffic. Data for retail private lines (i.e., those sold to corporate and government entities for their own internal use, not for connecting to the Internet, and not for use by ISPs) as well as for Frame Relay and ATM services show aggregate growth in bandwidth (and therefore most likely also traffic) in a a range of 30 to 40% per year. (Growth is slow for retail private lines, and fast for Frame Relay and ATM.) This is remarkably close to the growth rate observed in the late 1970s in the U.S., which was around 30% per year [deSolaPITH]. Thus it is the corporate traffic to the public Internet that is growing at 100% per year. (Currently over two thirds of the volume on the public Internet appears to be business to business.) Thus the acceleration in the overall growth rate of data traffic to the range of 100% per year from the old 30% or so a year appears to be a reflection of the advantages of the Internet, with its open standards, and any-to-any connectivity.
In the rest of this section we concentrate on publicly available information, primarily about aca-demic, research, and government networks. These might be thought of as unrepresentative of the corporate or private residential users. Our view is just the opposite, that these are the institutions that are worth studying the most, since they normally already have broadband access to the Internet, tend to be populated by technically sophisticated users, and tend to try out new technologies first. The spread of Napster through universities is a good example of the last point. We suggest (see Section 6 for more detail) that Napster and related tools, such as Gnutella and Wrapster, are just the forerunners of other programs for sharing of general information, and not just for disseminating pirated MP3 files. As we explain in Section 6, there is already much more digital data on hard disks alone than shows up on today’s Internet. Further, this situation is likely to continue.
Table 3.1. Growth in data traffic at Library of Congress. For each year, shows total traffic in gigabytes during February of that year and the rate of increase over the previous year.
year GB/month increase
1995 14.0 1996 31.2 123% 1997 109.4 251% 1998 282.0 158% 1999 535.0 88% 2000 741.1 39%
The growth rates we observe among the institutions that make traffic statistics publicly available vary tremendously. For example, Table 3.1 presents data for the Library of Congress, taken from the online statistics at http://lcweb.loc.gov/stats/ . There is a pronounced slowdown in the growth rate of traffic. On the other hand, other sources show no such effect. The AT&T Labs - Research public Web server has experienced a consistent growth rate in the volume of downloads of about 50% a year over the last three years. This growth continued even though this server contains primarily high quality technical material, that is of interest primarily to people who are already well-connected.
Faster growth rates are seen on links that serve wider constituencies. Table 3.2 shows statistics for the transatlantic link of the JANET network, which provides connectivity to British academic institu-tions. (More complete data is available at http://bill.ja.net/.) There are several interesting features of this data. One is the increasing asymmetry of the traffic, with the preponderance of traffic from the U.S. over that to the U.S. growing. Another is that traffic with the U.S. is increasing faster than with the LINX European exchange. More relevant for this paper is that the growth rate in the more heavily used
U.S. to U.K. direction shows no signs of slowing down. This is true even though, starting in the fall of 1998, the central JANET administration has started charging member universities for all traffic coming from the U.S. (See [Odlyzko3] for a more extensive discussion of this charging policy.) Perhaps even more interesting is that the growth rate of this traffic shows no signs of exploding, even though the link capacity has grown, and so the average utilization has decreased. In March 1999, JANET had two T3s across the Atlantic, for an aggregate capacity of 90 Mb/s. By March 2000, these were replaced by two OC3s, providing 310 Mb/s. Hence the utilization of the U.S. to U.K. link has decreased from 64.8% in March 1999 to 47.0% in March 2000. The increased capacity was not filled up immediately.
Table 3.2. Growth in JANET traffic. Shows terabytes transmitted on the link from the U.S. to the British JANET academic network in March of each year, and the rate of increase from previous year.
year US to UK UK to US increase in TB/month TB/month US to UK traffic
1997 3.73 2.95
1998 8.79 4.44 136%
1999 19.52 9.51 122
2000 48.76 14.90 150
The prevalent opinion appears to be that in data networks, “if you build it, they will fill it.” Our evidence supports this, but with the important qualification that “they” will not fill it immediately. That certainly has been the experience in local area networks, LANs. The prevalence of lightly utilized long distance corporate links was noted in [Odlyzko1]. That paper also discussed the vBNS research network, which was extremely lightly loaded. Here we cite another example of a large network with low utilizations and moderate growth rates. Abilene is the network created by the Internet2 consortium of U.S. universities [Dunn]. Its backbone consists of 13 OC48 (2.4 Gb/s) links. The average utilization in June 2000 was about 1.5%. Traffic appears to have grown about four-fold over the previous year, even though most of the consortium members had OC3 links to the Abilene backbone. Thus in spite of the uncongested access and backbone links, traffic did not explode. (Moreover, the 300% growth rate in traffic may be partially a reflection of some of the growth that would normally have gone over the commercial ISP links being redirected over Abilene instead.) Access to vBNS was restricted to certain research projects. On the other hand, Abilene is open to any traffic between the member universities, and thus it does not have the same limits to growth.
a sign of inefficiency. Many novel applications require high bandwith to be effective. That (together with some additional factors, such as the high growth rate, lumpy capacity, and pricing structure) contributes to the generally much lower utilization of data networks than of the long distance voice network, [Odlyzko1].
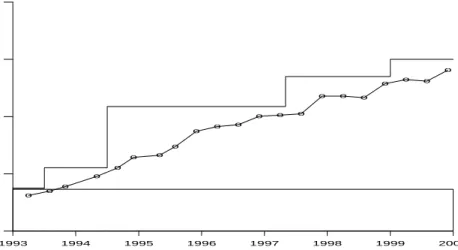
Even on more congested links, it often happens that an increase in capacity does not lead to a dramatic increase in traffic. This is illustrated by several examples. Figure 3.1 shows statistics for the traffic from the public Internet to the University of Waterloo over the last 7 years. (This is the longest such time series that we have been able to obtain.) Detailed statistics for the Waterloo network are available at http://www.ist.uwaterloo.ca/cn/#Stats, but Fig. 3.1 is based on additional historical data provided to us by this institution. Just as for the JANET network discussed above, and the SWITCH network to be discussed later, as well as most access links, there is much more traffic from the public Internet to the institution than in the other direction. Hence we concentrate on this more congested link, since it offers more of a barrier. We see that even substantial jumps in link capacity did not affect the growth rate much. Traffic has been about doubling each year for the entire 7-year period. (Overall, the growth rate at the University of Waterloo has slowed down, to about 55% from early 1999 to early 2000. This was at least partially the result of official limits on individual users that were imposed, limits we will discuss later.)
The same phenomenon of traffic that just about doubles each year, no matter what happens to capac-ity, can be observed in the statistics for the SWITCH network, which provides connectivity for Swiss academic and research institutions. The history and operations of this network are described in [Harms, ReichlLS], and extensive current and historical data is available at http://www.switch.ch/lan/stat/ . The data used to prepare Table 3.3 was provided to us by SWITCH. As is noted in [ReichlLS], the transatlantic link has historically been the most expensive part of the SWITCH infrastructure, and at times was more expensive than the entire network within Switzerland. It is therefore not surprising that this link tends to be the most congested in the SWITCH network. Even so, increasing its capacity did not lead to a dramatic change in the growth rate of traffic. If we compare increases in volume of data received between November of one year and January of the following year, there was an unusually high jump from Nov. 1998 to Jan. 1999, by 42%. This was in response to extreme congestion experienced at the end of 1998, congestion that produced extremely poor service, with packet loss rates during peak periods exceeding 20%. However, over longer periods of time, the growth rate has been rather steady at close to 100% per year and independent of the capacity of the link.
year
decimal log of bits per second
1993 1994 1995 1996 1997 1998 1999 2000 4 5 6 7 8 o o o o o o o o o o o o o o o o o o o o o
Traffic from the Internet to the University of Waterloo
Figure 3.1. Traffic on the link from the public Internet to the University of Waterloo. The line with circles shows average traffic during the month of heaviest traffic in each school term. The step function is the full capacity of the link.
through the “Public access” link. The listings available there as of mid-2000, as well as those from pre-vious years, show that various transmissions tended to grow at 100 to 150% per year. (Some of the growth has come from growth in the number of institutions. For example, for the largest SWITCH customer, traffic between June 1992 and June 2000 grew by a factor of 90, for an annual growth rate of 75%.) Occasionally there have been bigger jumps, such as the explosion in the category of traffic “leaving SWITCHlan” in early 2000, caused by the installation of an Akamai server that provides data to many European educational and research institutions.
The NORDUNet network connects research and educational institutions in the Nordic countries. It has detailed traffic statistics online, at http://www.nordu.net/stats/, that go back to November 1996. Over this period, adding up the traffic over all the interfaces shown in the data, we find that total traffic has been growing at about 130% a year. The link to the U.S. went from 56 Kb/s in 1990 to 777 Mb/s at the end of June 2000, for a compound annual growth rate of bandwidth over 10 years of about 150%. Over the last few years, the bandwidth to the U.S. has been growing at 100% a year; the first OC3 (155 Mb/s) link was installed in February 1998, the second in January 1999, and by February 2000 there were four OC3 links. (The fifth one was put into service in June 2000.) Traffic on the main U.S. links (ignoring the 45 Mb/s connection from Iceland) has grown from 54 and 30 Mb/s in March 1998
Table 3.3. Growth in SWITCH traffic. Average traffic flow from the U.S. to SWITCH, the Swiss academic and research network.
month traffic flow link capacity average Mb/s Mb/s utilization May 1996 1.51 3 50.4% Jul 1996 1.90 3 63.3 Sep 1996 1.99 3 66.3 Nov 1996 2.21 3 73.6 Jan 1997 2.37 3 67.6 Mar 1997 2.62 4 65.4 May 1997 2.86 4 71.4 Jul 1997 3.17 8 39.7 Sep 1997 2.87 8 35.9 Nov 1997 3.24 8 40.5 Jan 1998 3.88 8 48.5 Mar 1998 4.20 8 52.5 May 1998 5.05 8 63.1 Jul 1998 5.14 8 64.3 Sep 1998 5.66 8 70.7 Nov 1998 6.20 8 77.5 Jan 1999 8.78 24 36.6 Mar 1999 9.41 24 39.2 May 1999 10.63 32 33.2 Jul 1999 10.03 32 31.3 Sep 1999 11.62 32 36.3 Nov 1999 13.26 32 41.4 Jan 2000 15.52 56 27.7 Mar 2000 17.81 56 31.8
(54 Mb/s from the U.S. to NORDUNet, and 30 Mb/s in the reverse direction) to 237 and 122 Mb/s in March 2000, almost exactly a 100% growth rate over those two years.
The traffic statistics for the European TEN-155 research network (which consists largely of OC3, 155 Mb/s, links) are available at http://stats.dante.org.uk/mystere/ . Some of the links were heavily congested in the middle of 2000, while overall utilization has been moderate. Some of the historical traffic data for TEN-155 has been lost. However, DANTE (the organization that runs it) has provided us with data for the access link to the German national research network DFN, one of the largest contributors to TEN-155 traffic. This data, covering the period from the end of January 1999 to the beginning of July 2000, shows annual growth rates of about 70 and 90% (for the two directions of traffic).
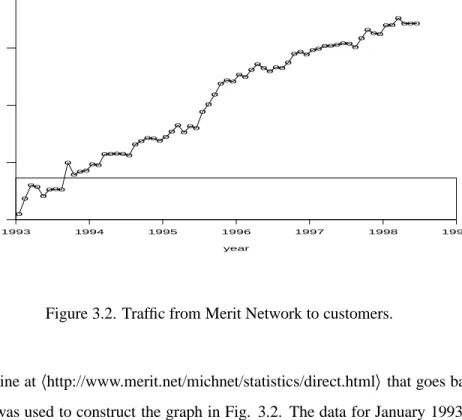
year decimal log of millions of packets 1993 1994 1995 1996 1997 1998 1999 3.0 3.5 4.0 4.5 5.0 o o oo oooo o ooo oo ooooo ooooo oo o ooo o o o ooooo ooooooo ooooooooooo o ooooo o ooo MichNet traffic
Figure 3.2. Traffic from Merit Network to customers.
data available online at http://www.merit.net/michnet/statistics/direct.html that goes back to January 1993. This data was used to construct the graph in Fig. 3.2. The data for January 1993 through June 1998 shows only the number of inbound IP packets. The data for months since July 1998 is more complete, but it is so complete, with details of so many interfaces, that we have not yet figured out how to use it. Hence we have used only the earlier information for January 1993 through June 1998. The resulting time series is a reasonable although imperfect representation of a straight line, modulated by the periodic variations introduced by the academic calendar. The growth rate is almost exactly 100% per year.
We conclude by presenting data traffic growth rates for three universities. The University of Toronto in the spring of 1998 had an 8 Mb/s connection to the Internet. By the spring of 2000, the bandwidth had been increased to 25 Mb/s. At both times, the link was run at about a 50% utilization (average of both directions), so it was very congested. (For current data and that of the previous year, see http://www.noc.utoronto.ca/netstats/index.html.) Thus the compound annual growth rate for both traffic and bandwidth was about 70%.
Princeton University had two standard connections to the Internet in the springs of both 1998 and 2000. Their combined bandwidth was 31 Mb/s all this time. (They were lightly utilized in 1998, and only moderately heavily in 2000.) By 2000, Princeton also had a 155 Mb/s connection to the vBNS
re-search network. (MRTG data for all these links is available at http://wwwnet.princeton.edu/monitoring.html.) The combined traffic increased from 4.2 and 1.9 Mb/s in 1998 to 14.7 and 11.4 Mb/s in 2000. If we combine the data rates for the two directions, we find a growth rate of about 100% per year.
The connection between the University of California at Santa Cruz and the Internet is currently dominated by traffic from the student residences. Thus it shows very strong seasonal effects. If we consider total Internet traffic during the first 7 days in June (before the start of the summer vacation), we find 143% growth from 1998 to 1999, and 205% growth from 1999 to 2000, to a final average level of 22.7 Mb/s. Much of the recent increase was caused by Napster (and will be discussed in the next section).
Many more examples can be cited, such as that of USC that was mentioned in Section 2, or that of Utah State University, with traffic statistics available at
http://thingy.usu.edu/network-stats/uen-ds3.html. There is also data about some of the campuses of the University of California at http://www.calren2.net/router-stats/. (CalREN2 provides external connectivity to most campuses in this system.) The article [McCredie]
mentions that the Berkeley campus has seen its traffic to the outside grow by a factor of 40 in 7 years, for a compound annual growth rate of 70%. Some of the other average growth rates appear higher.
An interested reader can find pointers to other universities, corporations, as well as exchanges that make their traffic statistics available in the listing of MRTG users at [MRTG]. In addition, there is an increasing number of gigapops that are being formed, and they usually show their traffic statistics on the Web. For URLs, see [Dunn]. (It should be mentioned, though, that most of the institutions connecting to the gigapops still have other connections to the Internet. Thus growth rates of their traffic at the gigapops by themselves are misleading.)
The general conclusion we draw from the examples listed above, as well as from numerous others, is that data traffic has a remarkable tendency to double each year. There are slower and faster growth rates. Overall, though, they tend to cluster in the vicinity of 100% a year. We have not seen any large institutions with traffic doubling anywhere close to three or even four months.
The growth rates noted above are often affected strongly by restrictions imposed at various levels. We will discuss this question further in Section 7, and at this stage just remark on some of the explicit limits imposed by network administrators. We noted that at the University of Waterloo, the growth rate has slowed down to 55% from early 1999 to early 2000. This was probably caused largely by the congestion on the Internet link, and the explicit limits on individual student download rates, described at http://www.ist.uwaterloo.ca/cn/#Stats. The arrival of Napster (discussed in the next section) led many institutions to either ban its use or else limit traffic rates to some parts of the campus (typically student
dormitories). Push technologies were stifled at least partially because enterprise network administrators blocked them at their firewalls. Email often has size restrictions that block large attachments (and in some cases all attachments are still banned). Teleconferencing is only slowly being experimented with on corporate intranets, and even packetized voice sees very limited (although growing) use.
Even spammers exercise some control. One of us has been collecting all the spam messages that have made it through the AT&T Labs - Research spam filter to his email account. They total several thousand over the last three years. An interesting observation is that the average sizes of these spam messages have increased only slightly. Spammers want to send many messages from their connections, so have an interest in keeping them short. At the same time, most of their customers are probably not ready to process complicated attachments in any case, and, connected by slow modems, would not have the patience to download large files. This provides an informal but apparently effective limitation on how big spam messages get. There appears to be an increase in large spam messages in html format, but it is starting only now, in 2000, although the Web has been prominent for many years.
Similar constraints apply to most of the content seen on the Web. As long as a large fraction of potential users have limited bandwidth, such as through dial modems, managers of Web servers will have an incentive to keep individual pages moderate in size.
The general conclusion from the above discussion is that Internet traffic is subject to a variety of constraints, at different levels. Some are applied by network managers, others by individual users. The interaction of these constraints with rising demands is what produces the growth rates we see.
To sustain the high growth rate of Internet traffic will require the creation of new applications that will generate huge traffic volumes. We estimate that as of year-end 1999, U.S. Internet backbone traffic was about a quarter to a third of voice traffic. At current growth rates (100% per year for the Internet, 10% for voice), in five years there will be 8 times as much Internet as voice traffic. If voice is packetized at that stage, it will likely be compressed as well, and even at very moderate 4:1 compression, would then amount to just 3% of Internet traffic. Thus voice will not fill the pipes that are likely to exist, and neither will traditional Web surfing. Thus we have the dilemma of service providers, network administrators, and equipment suppliers: to sustain the growth rates that the industry has come to depend on, and to accommodate the progress in technology (to be discussed more extensively later), we need new applications. Such applications are likely to appear disruptive to network operations today, and so often have to be controlled. In the long run, though, they have to be encouraged.
4. Disruptive innovations: browsers, Napster, ...
It is often said that everything changes so rapidly on the Internet that it is impossible to forecast far into the future. The next “killer app” could disrupt any plans that one makes. Yet there have been just two “killer apps” in the history of the Internet: email and the Web (or, more precisely, Web browsers, which made the Web usable by the masses). Many other technologies that had been widely touted as the next “killer app,” such as push technology, have fizzled. Furthermore, only the Web can be said to have been truly disruptive. From the first release of the Mosaic visual browser around the middle of 1993, it apparently took under 18 months before Web traffic became dominant on Internet backbones. It appears overwhelmingly likely that it was the appearance of browsers that then led, in combination with other developments, to that abnormal spurt of a doubling of Internet traffic every three or four months in 1995 and 1996.
What were the causes of the 100-fold explosion in Internet backbone traffic over the two-year period of 1995 and 1996? We do not have precise data, but it appears that there were four main factors, all interrelated. Browsers passed some magic threshold of usability, so many more people were willing to use computers and online information services. Users of the established online services, primarily AOL, CompuServe, and Prodigy, started using the Internet. The text-based transmissions of those services, which probably averaged only a few hundred bits per second per connected user, were replaced by the graphics-rich content of the Web, so transmission rates increased to a few thousand bits per second. Finally, flat rate access plans led to a tripling of the time that individual users spent online [Odlyzko3], as well as faster growth in number of users.
The Internet was able to support this explosion in use because it was utilizing the existing infras-tructure of the telephone network. At that time, the Internet was tiny compared to the voice network. It is likely that the data network that handles control and billing for the AT&T long distance voice services by itself was carrying more traffic than the NSF Internet backbone did at its peak at the end of 1994. Today, by contrast, the public Internet is rapidly moving towards being the main network, so quantum jumps in traffic cannot be tolerated so easily.
In late 1999, a new application appeared that attracted extensive attention and led to many predic-tions that network traffic would see a major impact. It is Napster. Numerous articles in the press have cited Napster’s ability to “overwhelm Internet lines”, and have claimed that it has forced numerous universities to ban or limit its use. The impression one gets from these press reports is that Napster is causing a quantum jump in Internet traffic, and is driving the traffic growth rates well beyond the
normal range. However, upon close examination this does not appear to be completely accurate, and the use of Napster has not increased growth rates much beyond the annual doubling or tripling rates, even within university environments, where Napster is most popular. That is not to say that is has not resulted in huge amounts of traffic, nor that it has not had serious impact on several major networks.
Napster provides software that enables users connected to the Internet to exchange and/or download MP3 music files. The Napster (web) site matches users seeking certain music files with other users who have those files on their computer. The Napster system preferentially uses as sources of files machines that have high bandwidth connections. This means that universities are the primary sources, since other organizations with fast dedicated links, mainly corporations, do not allow such traffic. The result is that although college students are often cited as the greatest users of MP3 files, it is the traffic from universities that gets boosted the most. (Since that direction of traffic is typically much less heavily used than the reverse one, the impact of Napster is much less severe than if the dominant direction of traffic were reversed.) Regular modem users are usually not affected, since their connections are too slow. However, the proliferation of cable modems and DSL connections that have “always-on” high bandwidth connectivity is leading to problems for some residential users, especially since the uplink is the one that invariably has the more limited bandwidth.
Napster has attracted huge attention because of its perceived potential to facilitate violations of copyright. This threat has led to litigation, and several universities have blocked access to the central Napster server as a result. (Whether such bans can be effective is questionable, as there are ways to bypass them. Some universities have adopted an attitude of watchful waiting, cf. [Plonka].) While the legal aspects of Napster and their implications for the music business are important questions, we will not deal with them in this paper.
A key reason that Napster is of great interest to us is that similar types of sharing applications effectively turn consumers of information into providers of information. (The World Wide Web was designed for such information sharing, but for some types of files Napster and its kin are preferable.) These applications will effectively turn the traditional consumer PCs into Internet servers which will output large amounts of traffic to other users. In Napster’s case this has been predominantly MP3 music files, but other programs, such as Gnutella, work with more general data. It is highly probable that such applications could be one of the key applications that fuel the continued annual doubling or tripling of data traffic.
Napster first became noticeable in the summer of 1999. Its share of the total Internet traffic on many of the university networks has grown from essentially nothing to around 25% of the total traffic.
date
decimal log of bytes per month
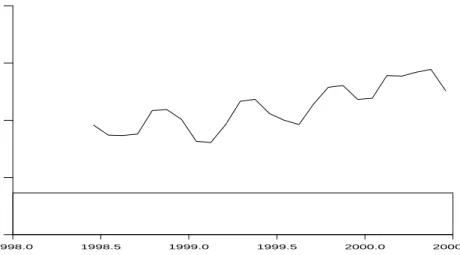
1998.0 1998.5 1999.0 1999.5 2000.0 2000.5 10 11 12 13 14 UCSC traffic
Figure 4.1. Traffic between UCSC and the Internet.
The amount of Napster traffic that is reported by several university networks (such as UC Santa Cruz, University of Michigan, University of Michigan, Indiana, UC Berkeley, Northwestern University, and Oregon State University to name a few) range from around 20% at some as high as 50%. However, the reported numbers are often very preliminary, and in some cases they compare Napster traffic to total traffic, while in others it appears that the high values may represent a comparison only to the out traffic. In any event this is a phenomenal growth rate for any single application. Since it started from zero less than a year ago, it is risky to extrapolate this initial explosion out indefinitely.
With the caveat that the numbers are approximate and preliminary, we did a quick estimate of the impact of Napster on growth rates for some of these university networks. For example, prior to the introduction of Napster, UC Berkeley’s network traffic appeared to be growing at roughly 70% annually (i.e., doubling every 15 to 16 months), [McCredie]. It was reported that by the spring of 2000, Napster traffic had grown to 50% of the total. (It is not clear whether this is a percentage of the total traffic or only the out traffic). If we assume that the non-Napster traffic continued to grow at this rate, and assume that Napster traffic is now 50% of the total, then the overall annual growth rate (since the introduction of Napster) is around 4x per year. If, however, Napster only makes up 30% of the total then it works out to an annual growth rate of about 3.2x per year.
1999 in 1999 out 2000 in 2000 out 0 20 40 60 80 Mb/s Napster all other
University of Wisconsin Internet traffic
Figure 4.2. Change in volume and composition of traffic between the University of Wisconsin in Madison and the Internet. Average transmission rates in spring 1999 and spring 2000.
system is at http://noc.ucsc.edu/mrtg/data/routers/to campus: commcat-comm-g.html . In Fig. 4.1 we show the monthly traffic between UCSC and the Internet during the crucial period when Napster made its appearance. There were no controls on this traffic in 1999, other than email warnings to owners of machines with large data transfers. There are huge variations from month to month, caused by the academic calendar, but one can see that traffic basically doubled from the spring semester of 1999 to the fall one. By early 2000, Napster traffic was about 50% of outgoing transmissions, and 10% of incoming ones. In March 2000, a rate limitation was imposed on the traffic from the dormitories, which has limited the impact of Napster. Napster is the obvious culprit in the increase in outgoing traffic to about 60% of that of incoming traffic in February 2000. The limits did result in the drop in the ratio of outgoing to incoming traffic to about 40% in April 2000, but then this ratio crept up to over 50% in May and June.
The University of Wisconsin-Madison has done the most to carefully monitor Napster and its kin, has high bandwidth on campus and to the Internet, and as of mid-2000 has not as yet taken any steps to limit Napster traffic [Plonka]. (For current analysis of their traffic by protocol, application, and so on, see http://wwwstats.net.wisc.edu/ . Several other universities are using this software, developed by Dave Plonka at the University of Wisconsin, for analyzing their traffic as well.) Fig. 4.2 shows
the effect of Napster. This campus is very unusual in that even before Napster made its appearance, there was about as much outgoing as incoming traffic. Napster has led to a disproportionate increase in outgoing traffic. (At some times it apparently led to this traffic reaching capacity limit for the link.) Fig. 4.2 compares the average rates for data traffic during the week starting May 7, 1999 to those for the week starting May 12, 2000. Both were exam weeks at the end of the regular school year. (Transmissions dropped dramatically in the following weeks.) Outgoing traffic increased 157%, and total traffic 138%. If we exclude Napster, the other traffic increased by 81%. Thus Napster has had a noticeable effect on the growth rate of traffic on this campus, but not an outlandish one.
Several networks, such as that of the University of Wisconsin-Madison that report Napster traffic of as much as 30% are not doing anything to limit Napster since they claim that they still have plenty of bandwidth. Others have imposed limits on the total bandwidth available to the dormitories. Note that if your traffic doubles each year, a one-time 30% increment is noticeable when it occurs, but becomes minor in a couple of years. A much more serious problem arises if a new application continues growing. The big question for many campuses is whether Napster traffic will surge again in the fall of 2000. Even if Napster does not grow much more, video files are likely to become increasingly common, clearly going to grow, and the question is how fast that will drive the growth of total traffic.
Aside from Napster, occasionally even a large institution will experience a local perturbation in its data traffic patterns caused by one particular application. For example, the SETI@home distributed computing project, http://setiathome.ssl.berkeley.edu, uses idle time on about two million PCs (as of mid-2000) to search for signs of extraterrestrial intelligence in signals collected by radio telescopes. This project is run out of the Space Sciences Institute at the University of California at Berkeley, and within a year of inception accounted for about a third of the outgoing campus traffic [McCredie]. (Moreover, this was extremely asymmetrical traffic, with large sets of data to be analyzed going out to the participating PCs, and small final results coming back. That most of the data went away from campus made this application less disruptive than it would have been otherwise.) Its disruptive effect is moderated by limiting its transmission rate to about 20 Mb/s. At the University of California at Santa Cruz, a complete copy of the available genome sequence was made available for public download in early July 2000. This, combined with coverage in the popular press and on Slashdot, led to an immediate surge in traffic, far exceeding the effects of Napster. If the interest in this database continues, it will require reengineering of the campus network.
The SETI@home project is interesting for several reasons. It is cited in [McCredie] as a major new disruptive influence. Yet it contributes only about 20 Mb/s to the outgoing traffic. An increasing
number of PCs and workstations are connected at 100 Mb/s, and even Gigabit Ethernet (1,000 Mb/s) is coming to the desktop. This means that for the foreseeable future, a handful of workstations will in principle be capable of saturating any Internet link. Given the projections for bandwidth (discussed in Section 5), a few thousand machines will continue to be capable of saturating all the links in the entire Internet. Thus control on user traffic will have to be exercised to prevent accidental as well as malicious disruptions of service. However, it seems likely that such control could be limited to the edges of the network. In fact, such control will pretty much have to be exercised at the edges of the network. QoS will not help by itself, since a malicious attacker who takes over control of a machine will be able to subvert any automatic controls.
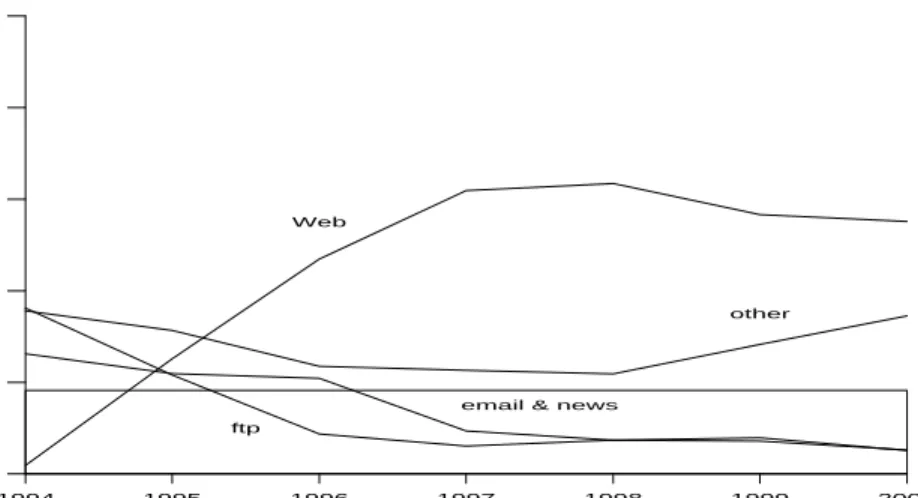
Finally, after considering current disruptions from Napster and SETI@home, we go back and con-sider browsers and the Web again. They were cited as disruptive back in 1994 and 1995. (Mosaic was first released unofficially around the middle of 1993, officially in the fall of 1993, and took off in 1994.) However, when we consider the growth rates for the University of Waterloo (Fig. 3.1), for MichNet (Fig. 3.2), or for SWITCH (for which Table 3.3 only covers the period since early 1996, but which apparently had regular growth throughout the 1990s, according to [Harms]), we do not see anything anomalous, just the steady doubling of traffic each year or so. If we consider the composition of the traffic, there were major changes. For example, Fig. 4.3 shows the evolution of traffic between the University of Waterloo and the Internet. (It is based on analysis of traffic during the third week in each March, and more complete results are available at http://www.ist.uwaterloo.ca/cn/Stats/ext-prot.html .) The Web did take over, but much more slowly than on Internet backbones. There are no good data sets, but it has been claimed that by the end of 1994, Web traffic was more than half of the vol-ume of the commercial backbones. On the other hand, the data for the NSFNet backbone, available at http://www.merit.edu/merit/archive/nsfnet/statistics/.index.html , show that Web traffic was only ap-proaching 20% there by the end of 1994, a level similar to that for the University of Waterloo. Thus at well-wired academic institutions such as the University of Waterloo and others that dominated NSFNet traffic, the impact of the Web was muted.
Perhaps the main lesson to be drawn from the discussion in this section is that the most disruptive factor is simply rapid growth by itself. A doubling of traffic each year is very rapid, much more rapid than in other communication services. Fig. 4.3 shows email and netnews shrinking as fractions of the traffic at the University of Waterloo, from a quarter to about 5%. Yet the byte volume of these two applications grew by a factor of 12 during the 6 years covered by the graph, for a growth rate of over 50% per year, which is very rapid by most standards. If we are to continue the doubling of traffic
year percentage of traffic 1994 1995 1996 1997 1998 1999 2000 0 20 40 60 80 100
Internet traffic at the University of Waterloo
Web
other
ftp
email & news
Figure 4.3. Composition of traffic between the University of Waterloo and the Internet. Based on data collected in March of each year.
each year, new applications will have to keep appearing and assuming dominant roles. An interesting data point is that even at the University of Wisconsin in Madison, which analyzes its data traffic very carefully, about 40% of the transmissions escape classification. That is consistent with information from a few corporate networks, where the managers report that upwards of half of their traffic is of unknown types. (A vast majority of network managers do not even attempt to perform such analyses.) This shows how difficult coping with rapid growth is.
5. Technology trends: Growth in bandwidth
Bandwidth is growing rapidly, primarily through the introduction of WDM systems of increasing capacity, and to a much lesser extent through installation of additional fiber. However, this increase is not as fast as some would have us believe. For example, George Gilder has predicted that “bandwidth will triple each year for the next 25” [Gilder2]. While he was right in predicting rapid growth, the actual rate of increase has so far been somewhat more modest. In Table 5.1 we show the progress that has occurred so far, and is likely to occur in the next few years. This table was generated by using a variety of vendor release dates along with our detailed technical understanding of such high-speed transport systems. We are considering commercial systems and not research hero experiments. Historically,
there was a lag of three years or more between the lab demonstration of a given transmission capacity, and its introduction into the commercial environment. Recently, however, this time lag appears to have diminished, but this is very debatable. There is much hype about commercial transmission capacities, and it is still a bit unclear as to how early a given high capacity transmission system will become widely deployed.
Even the rate of increase for the maximum capacity achieved within lab experiments has slowed down considerably. For example, the first 1 Tb/s experiments were done in late 1995/early 1996, and it appears that at year’s end 1999/beginning 2000 the maximum rate will be around 3 Tb/s. This is a growth of “only” three times in roughly 4 years, a rate much less than what was demonstrated in the previous several years.
Even when a system does become commercially widely available, it takes a while for it to affect the available bandwidth of a network. It has to be installed and tested, which all takes time. Further, not all old systems get replaced right away. This is similar to the PC situation, in which machines tend to be replaced on a three or four year cycle.
Table 5.1. Widespread deployment of WDM systems. system description fiber capacity wide deployment
8 2.5 Gb/s 20 Gb/s 1996 16 2.5 Gb/s 40 Gb/s 1997 32 2.5 Gb/s 80 Gb/s 1999 80 2.5 Gb/s 200 Gb/s 2000 40 10 Gb/s 400 Gb/s mid to late 2000 160 2.5 Gb/s 400 Gb/s mid to late 2000 80 10 Gb/s 800 Gb/s 2002 160 10 Gb/s 1.6 Tb/s 2003 40 40 Gb/s 1.6 Tb/s 2003 80 40 Gb/s 3.2 Tb/s late 2003 to early 2004 100 40 Gb/s 4 Tb/s 2005 160 40 Gb/s 6.4 Tb/s 2007
The projections in Table 5.1 only go out to 2007. Beyond that point there appear to be serious barriers to improvements in the current technologies. For example, the erbium-doped fiber amplifiers that are crucial for the current systems cover only a limited range of wavelengths. It could be that those barriers will be overcome in time, just as similar barriers to Moore’s Law for semiconductors have repeatedly been overcome. However, that does not affect our arguments. Given the time lags between