School Segregation, Educational Attainment and Crime
Evidence from the end of busing in Charlotte-Mecklenburg
Stephen B. Billings David J. Deming*
Jonah Rockoff
January 2014
Abstract
We study the end of race-based busing in Charlotte-Mecklenburg schools (“CMS”). In 2001, school boundaries in CMS were redrawn dramatically, and half of students received a new assignment. Using addresses measured prior to the policy change, we compare students in the same neighborhood that lived on opposite sides of a newly drawn boundary. We find that both white and minority students score lower on high school exams when they are assigned to schools with more minority students. We also find decreases in high school graduation and four-year college attendance for whites, and large increases in crime for minority males. We conclude that the end of race-based busing widened racial inequality, despite efforts by CMS to mitigate the impact of segregation through compensatory resource allocation.
Word Count: 13,933
* Corresponding author Deming: Harvard Graduate School of Education, 8 Appian Way, Gutman 411, Cambridge MA 02139 (email: [email protected]). We wish to thank Kehinde Ajayi, Josh Angrist, Felipe Barrera-Osorio, Elizabeth Cascio, Caroline Hoxby, Richard Murnane, Amanda Pallais, Sarah Reber, Steven Rivkin, Stephen Ross, Marty West, and seminar participants at the NBER Education Meetings, the AEFP, APPAM and UEA research conferences, Elon University, Georgetown University, University of Arkansas, University of Connecticut, University of North Carolina at Greensboro, University of Rochester, University of Tennessee and Vanderbilt University for helpful comments and suggestions. Special thanks to Andy Baxter and Tom Tomberlin at Mecklenburg Schools, Brian Cunningham, Mike Humphrey, Monica Nguyen and Paul Paskoff at the Charlotte-Mecklenburg Police Department and Julia Rush at the Charlotte-Mecklenburg County Sheriff’s Department for their assistance with putting the data together for the project.
2
I. INTRODUCTION
Since the landmark 1954 Supreme Court decision Brown v. Board of Education, schools have been seen by courts and policymakers as a primary social setting in which to address racial inequality. The Brown decision declared “separate but equal” schooling unconstitutional, yet efforts to engineer racial integration through student assignment policy have been highly controversial and not always successful. A 1971 Supreme Court case, Swann v. Charlotte-Mecklenburg Board of Education, held that Charlotte-Mecklenburg County schools were de facto segregated even in the absence of an explicit policy, because neighborhoods were highly segregated, and authorized the use of busing to achieve racial balance in schools.
Race-based busing soon spread to school districts around the country, and court-ordered school desegregation became one of the most ambitious social policies of the 20th century.
Scholars have connected the widespread implementation of school desegregation plans in the late 1960s and 1970s with increased educational attainment for black students (Guryan 2004, Reber 2010), higher income (Ashenfelter, Collins and Yoon 2006, Johnson 2011), improvements in adult health (Johnson 2011) and decreased rates of homicide victimization and arrests (Weiner, Lutz and Ludwig 2009). Many studies have found that segregation widens the racial test score gap, with most (but not all) concluding that schools play at least as important a role as
neighborhoods (e.g., Cook and Evans 2000, Card and Rothstein 2007, Vigdor and Ludwig 2008). After a protracted legal battle beginning in the late 1990s, Charlotte-Mecklenburg school district (henceforth “CMS”) was ordered by the North Carolina State Supreme Court to disband race-based busing. Beginning in the fall of 2002, CMS switched to a neighborhood-based student choice plan. The key features of the new assignment policy were that school boundaries were redrawn as contiguous areas around a school, and that students were assigned to their
neighborhood school by default. Because neighborhoods in Charlotte were still highly segregated, this change led to a large and sudden increase in school segregation in the fall of 2002.
In this paper, we study the impact of the end of court-ordered desegregation in CMS on students’ achievement test scores, educational attainment, and criminal activity. We match college attendance records from the National Student Clearinghouse (henceforth “NSC”) and arrest and incarceration data from the Mecklenburg County Sheriff (henceforth “MCS”) to yearly student records from CMS. These matches are done using full name and date of birth, enabling
3
us to track students who subsequently leave or drop out of CMS. Critically, the CMS data also include students’ exact addresses measured in the fall of each school year, which allows us to assign students to neighborhood school zones under the two policy regimes. Furthermore, we use students’ addresses measured prior to the policy change to fix their location. This allows us to treat exit from CMS, residential relocation during the prior school year, and other related responses as endogenous outcomes of the boundary change.
Our identification strategy compares students who lived in the same neighborhoods, but whose pre-policy addresses placed them on opposite sides of a newly drawn school boundary. We estimate the differential impact, within small geographic areas, of being assigned to a school with more minority students. We then examine variation in the impacts across student
characteristics, grade cohorts and baseline neighborhood racial composition. The main threat to identification is differential neighborhood trends that are correlated with the location of the boundaries. We show that while minority and low income students were more likely to be assigned to segregated schools overall, there is no evidence of sorting within neighborhoods across a newly drawn boundary. We also examine the impact of the boundary change on students in older grade cohorts, who should not have been exposed to the policy change. We find no evidence of pre-policy trends in school racial composition.
Our results show that the re-segregation of CMS schools widened inequality of outcomes between whites and minorities. We estimate that all students, white and black, score lower on high school exams when they attend schools with more minority students. We find that a 10 percentage point increase in the share of minorities in a student’s assigned school decreases high school test scores by about 0.014 standard deviations, which aligns closely with results from other studies of the effect of peer racial composition (e.g. Hoxby 2000, Hanushek, Rivkin, and Kain 2009, Vigdor and Ludwig 2008). Since the net impact of re-zoning was that students attended schools with a greater share of peers of their own race, our estimates imply a widening of the racial achievement gap of about 0.025 standard deviations. We also find that white students are less likely to graduate from high school or attend a four-year college when they are assigned to schools with more minority students.
The re-zoning of CMS schools led to large and statistically significant increases in crime among minority males. Our estimates suggest that a 10 percentage point increase in assigned school share minority led to an increase among minority males in the probability of ever being
4
arrested and ever being incarcerated of about 1.5 percentage points, about an 8 percent increase relative to the mean for minority males in the sample. The increase in crime is similar in
magnitude across grade cohorts and persists through the end of our data in 2011, nine years after the re-zoning. Moreover, we find that the increases in crime are driven entirely by poor minority males who live in highly segregated neighborhoods, and are assigned to schools with higher shares of poor minority students. Overall, the impacts on crime align with several other studies of nonlinear peer effects, which find that grouping high-risk youth together increases the aggregate level of misbehavior and/or crime (Cook and Ludwig 2005, Carrell and Hoekstra 2010, Bifulco, Fletcher and Ross 2011, Deming 2011, Imberman, Kugler and Sacerdote 2012).
Interestingly, we find that the impact of re-zoning on academic outcomes is somewhat greater among older students, who were entering or already enrolled in high school in the fall of 2002. We present suggestive evidence that increases in resource allocation toward high-minority high schools in CMS may have mitigated the impact of re-zoning for younger cohorts. This evidence is consistent with Reber (2010), who finds that the benefits of desegregation were driven by increases in resources rather than exposure to whites, and Lutz (2011), who finds evidence of compensatory resource allocation after the end of court-ordered busing across a broad range of school districts. However, the impacts on crime do not diminish over time.
This paper provides evidence that school segregation has an important influence on racial inequality in longer-run outcomes. Our paper is most closely related to Lutz (2011), who uses differential timing of court orders to compare outcomes in districts before and after changes in student assignment plans, and finds that dismissal of a court order leads to small increases in the black dropout rate in non-Southern districts. Our results complement Lutz (2011) in several ways. First, the re-zoning of CMS schools led to changes in segregation that were considerably larger than the average district in Lutz (2011). The seven-year change in the exposure index (a commonly used measure of segregation) was about 13 percentage points, which is nearly as large as the impact of court-ordered desegregation in the 1960s and 1970s (Rossell and Armor 1996, Guryan 2004). Second, student-level data from a single district coupled with a
quasi-experimental research design allows us to explore how changes in school racial composition might affect students through different mechanisms such as school resources and peer effects (Reber 2010, Cascio, Gordon, Lewis and Reber 2010, Johnson 2011, Bifulco, Fletcher and Ross 2011, Imberman, Kugler and Sacerdote 2012). Third, we add to the literature on the impact of
5
school and neighborhood interventions on long-run outcomes such as college attendance and crime (Katz, Kling and Liebman 2001, Ludwig, Kling and Katz 2005, Kling, Liebman and Katz 2007, Deming 2011, Chetty et al 2011, Deming, Hastings, Kane and Staiger 2013, Dobbie and Fryer 2013, Angrist et al 2013).
Do segregated schools inevitably lead to racial and socioeconomic inequality? Or can the consequences of school segregation be mitigated by compensatory allocation of resources? This is a critical question for education policy. Beginning in the early 1990s, school districts across the U.S. have been gradually released from court ordered desegregation plans, and school segregation has increased as a result (Lutz 2011, Reardon et al. 2012). Today, as a result of Federal programs such as Title I and a variety of state and local initiatives, racial and
socioeconomic gaps in school spending have narrowed considerably and in some cases reversed. Our results provide suggestive evidence that equal or greater resources combined with active policy efforts may be able to reduce the impact of school segregation on academic outcomes, but not for crime. To the extent that crime is driven by social context and peer interactions, it will be difficult for schools to address racial and economic inequality through means other than
deliberately integrative student assignment policies. II. BACKGROUND
The landmark Supreme Court decision Brown vs. Board of Education in 1954 disallowed de jure racial segregation of schools, but the court’s 1971 Swann v. Charlotte-Mecklenburg Schools decision led to the implementation of based busing. Although CMS had no explicit race-based assignment policy, the Court ruled schools were de facto segregated, due to highly segregated neighborhoods and contiguous catchment areas around each school. Following the court order, school zones in CMS were redrawn to capture non-contiguous areas with different racial compositions. CMS was mandated to keep each school’s percent black within 15
percentage points of the district average, and CMS periodically redrew boundaries to ensure that this balance was kept. Racial balance was preserved using “satellite” zones that bused students from inner city neighborhoods with high shares of minority students to schools located in suburban, highly white neighborhoods.
In the early 1990s, the legal status of court-ordered desegregation became tenuous. Since 1990, every contested motion for a school district to be declared unitary has resulted in a dismissal of the desegregation plan (NAACP, 2000). Lutz (2011) finds that about 60 percent of
6
the original impact on integration is reversed within 10 years after a district is declared unitary, and that this change in segregation increases dropout rates and private school attendance among black students outside of the South. In 1997, a CMS parent sued the district because their child was denied entrance to a magnet program based on race (Capacchione v. Charlotte-Mecklenburg Schools). This case escalated into a reopening of Swann in 1999 in a series of court battles which ended in April of 2002, leaving CMS no choice but to end race-based busing permanently.1 The CMS school board discussed alternatives during the 1999 trial and adopted a neighborhood-based school choice plan (the “Family Choice Plan” or FCP) in December 2001.
New school boundaries for the fall of 2002 were drawn as contiguous areas around schools. Families were assigned to their neighborhood school by default, but could apply to attend other schools in the district, including magnet schools. Enrollment was subject to capacity constraints, and schools that were oversubscribed had admission determined by lottery (Hastings, Kane and Staiger 2008, Deming 2011, Deming, Hastings, Kane and Staiger 2011). To limit school
segregation, CMS gave priority in the admissions lotteries to poor students who applied to schools that were majority non-poor. They also paired the FCP with a program called the Equity Plan, which provided high-poverty schools with additional resources such as smaller class sizes, bonuses for teachers and bond funds for renovation (Mickelson, Smith and Southworth 2009).
[FIGURE I ABOUT HERE]
Under FCP, many of the previous school boundaries were redrawn. Figure I provides an illustration of this change for two middle schools; the top panel shows boundaries for the school year 2001-2002 and the bottom panel shows the new boundaries drawn for the fall of 2002. Not only did satellite zones disappear, but the zones surrounding both schools were redrawn to ensure that schools were not overcrowded. Decisions about where to draw the boundaries were governed primarily by enrollment projections, with diversity taking an explicit backseat (Smith 2004, Mickelson, Smith and Southworth 2009).2 Whereas many preexisting boundaries took advantage of natural features such as streams or major roads, the newly drawn boundaries were
1
In September 1999, the district was ordered to discontinue the use of race in student assignment. The Swann plaintiffs appealed (Belk v. Charlotte-Mecklenburg Board of Education) and in November 2000 the ruling was overturned, holding that further review was necessary (Mickelson, 2003). In September 2001, the declaration of unitary status was affirmed, and a last-ditch appeal to the Supreme Court was denied in April of 2002.
2
For example, at the November 9, 1999 meeting of the CMS Board, Superintendent Eric Smith described the idea behind the new process, saying, “It’s a mechanical process, not a human process. It simply draws [maps] based on capacity and numbers of children, it doesn’t make any sense in terms where children play, associations children naturally make as they are growing up, and it doesn’t make any sense in terms of how families relate and interact.”
7
less likely to do so because of the mechanical process that governed re-zoning.3 The bottom panel of Figure I also shows how the new school zone boundaries were often not coterminous with census block group boundaries, creating variation in school assignments for students living in the same neighborhood.4
[FIGURE II ABOUT HERE]
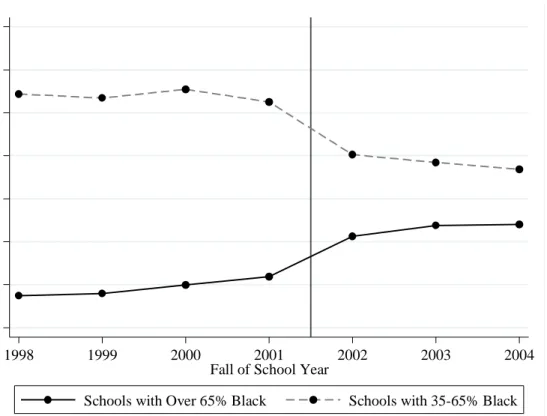
The redrawing of CMS boundaries as contiguous neighborhood zones led to a marked increase in school segregation between school years 2001-02 and 2002-03. In Figure II, we see that the proportion of students attending a middle or high school with a high concentration of black students (over 65 percent) jumped from 12 to 21 percent, while the proportion attending a relatively integrated school—35 to 65 percent black—fell from 53 to 40 percent. We find
similar patterns when we examine changes over time in two widely used measures of segregation – the index of dissimilarity and the exposure index (e.g. Massey and Denton 1989).5
The change in the exposure index from 2001-2002 to 2002-2003 was about 5 percentage points. In contrast, Lutz (2011) finds that the termination of court-ordered busing plans beginning in the early 1990s led to virtually no short-run change in the exposure index, and a ten-year change of about 3.5 percentage points. In CMS, the change in the exposure index from 2001-2002 to 2008-2009 was about 13 percentage points, which is similar in magnitude to the impact of court-ordered
desegregation in the 1960s and 1970s (Rossell and Armor 1996, Guryan 2004). III. DATA
We use administrative records from CMS that span kindergarten through 12th grade and the school years 1995-1996 through 2010-2011. Every student who attended a CMS school for at least one semester is included, and students are tracked longitudinally across years. The data include information on student demographics such as gender, race and eligibility for free or reduced price lunch (our indicator of poverty), yearly end-of-grade (EOG) test scores for grades 3 through 8 in math and reading, and scores on high school end-of-course (EOC) exams in
3
Figure A1 shows a kernel density plot of the share of old and new boundaries that abut a natural or manmade feature, and a Kolmogorov-Smirnov test for equality of distributions yields a p-value of 0.017. This figure and all other supplementary figures and tables are numbered consecutively (A1, A2, etc…) and can be found in the online appendix.
4
We employ multiple definitions of neighborhood in our analysis below, including tax parcel groups, which were also not often coterminous with school boundaries and which are considerably smaller than census block groups.
5
Figure A2 presents a time trend from 1998 to 2007 in the dissimilarity and exposure indices. The index of dissimilarity can be interpreted as the share of students that would have to be moved to different schools to reproduce the overall racial
composition of CMS in each individual school. The exposure index calculates the probability that a minority student’s randomly drawn schoolmate is also a minority – the minimum value for this measure is the percent minority overall in the district. These measures are calculated using CMS data, whereas the proportion of students attending segregated schools is calculated using the Common Core of Data.
8
subjects such as Algebra I, Geometry, and English. The data also include information on
graduation from CMS high schools and transfer records. Our data also include the exact address of residence in every year for every student in CMS, again from 1995 to the present. As we discuss below, this allows us to determine each student’s school assignments under the busing and post-busing regimes. We also incorporate data from CMS’ human resource files from 1999 onward, which contain measures of teacher characteristics, including years of experience, salary and postsecondary credentials.
We match CMS administrative records to a registry of all adult (defined in North Carolina as age 16 and above) arrests and incarcerations in Mecklenburg County from 1998 to 2011. 6 The Mecklenburg County Sheriff (MCS) tracks arrests and incarcerations across individuals using a unique identifier that is established with fingerprinting. The arrest data include information on the number and nature of charges, and the incarceration data include a time and date of entry and exit, with stints in county jail and state prison both included in length of incarceration for
individuals who serve concurrently. While these data allow us to observe future criminal
behavior of CMS students, regardless of whether they transfer or drop out of CMS schools, they are limited to crimes committed within Mecklenburg County.
We use data on college attendance records from the National Student Clearinghouse (NSC), a non-profit organization that provides degree and enrollment verification for more than 3,300 colleges and 93 percent of students nationwide. NSC information is available for every student of college age who had ever attended a CMS school, including students who transfer to other districts or private schools, or who drop out of school altogether.
We limit our analysis sample to the seven cohorts who were rising first-time 6th grade
students in the fall semesters of 1996 through 2002. Students who enter CMS after the change in boundaries are not included in the sample. Those who attended 6th grade in the fall of 1996 and progressed through school at the normal rate of one grade per year would enter 12th grade in the fall of 2002, and thus would have had only one year of exposure to the change in school
boundaries. In contrast, students who attended 6th grade in the fall of 2002 spent all of their middle and high school years in the post-busing regime. While these seven cohorts span the
6
We use name and date of birth to link individuals across the two data sources. While close to 90 percent of the matches are exact, we recover additional matches using an algorithm for partial matches that has been used and validated in previous work (Deming, 2011).
9
range of “treated” students, we also examine the impact of re-zoning on earlier cohorts in a set of specification checks.
If the youngest cohort of “treated” students had progressed one grade per year, they would have graduated from high school in the spring of 2009 and could potentially have attended college for the first time in the fall of 2009. Because our data on college attendance and crime end in 2011, we have limited ability to look at the impact among younger cohorts of students who experienced a change in segregation in elementary school. We also cannot examine longer-run measures of educational attainment such as persistence in college and college degree completion. Thus our main measure of postsecondary attainment will be whether a student attended college within 12 months of the fall after their expected high school graduation date. With this measure, students who repeat a grade but still attend college immediately after
graduation can be counted, as can students who delay postsecondary enrollment for up to a year after on-time high school graduation.
We define residential neighborhoods within Mecklenburg County using the 371 Block Groups from the 2000 Census. We also use data from the County Tax Assessor’s Office to define 981 “micro-neighborhoods,” which are based on similar real estate parcels (Linden and Rockoff 2008). We use address records from the spring of each school year to assign students to 2000 census geographies, micro-neighborhoods (based on tax parcel), and middle and high school zones for both the pre-and post-2002 boundaries.
Because families may sort in response to the policy change, it would be problematic to use their contemporaneous addresses to assign students to neighborhoods and school zones. Instead, we assign every student to pre- and post-2002 school zones based on their earliest listed address, which is observed in spring 1996 in most cases. We omit a small number of students whose first address is recorded in spring 2002, after the boundary change was announced (but before fall 2002, when the new boundaries applied). This approach minimizes the possibility that sorting will bias our estimates, but it also increases measurement error because some families will have moved to other areas by 2002. We also omit all students who enter CMS after fall 2002, because of a lack of data on pre-policy addresses. While this approach minimizes bias, it also means that our results only generalize to the type of family that had some tolerance for race-based busing – otherwise they would not have been enrolled in CMS prior to 2002. We also examine two alternatives for assigning students to neighborhoods and school zones: (a) address in the fall of
10
5th grade or (b) address in the latest year observed up to fall 2001. These options trade off the benefits of comparing all students based on residence just before entering middle school but at different points in time vs. comparing them based on residence just before the reform but at different grade levels. While our preferred estimates use the earliest address, the results are very similar regardless of which alternative we choose.7
[TABLE I ABOUT HERE]
Of our initial sample of 54,093 students, just over five percent have missing or invalid address information, which leaves us with 51,020 students. We further restrict the sample to the 43,949 students who were previously enrolled in CMS in the academic year 2001-2002.8 Table 1 lists descriptive statistics for our sample. Overall, 44 percent of students are black, 5 percent are Hispanic, and just over half of all students come from poor households (i.e., receiving free or reduced price lunch). Fifth grade test scores were slightly higher than the state average in math and reading. Overall, 52 percent of students were assigned to a new school as a result of the 2002 change in school zone boundaries.
Splitting the sample by the percentage of minority residents in the student’s census block group (CBG) gives a sense of how residential segregation would lead to school segregation under a policy of contiguous neighborhood school zones. We split the sample at 20% and 66% minority, which are close to the minimum and maximum share of minority students in any CMS high school under race-based busing. In CBGs with fewer than 20% minority residents, few students are black (8%), Hispanic (2%), or poor (14%), while in CBGs with more than 66% minority residents the vast majority of students are black (87%) or Hispanic (5%), and poor (89%). While it is clear that residential and racial segregation is driven predominantly by the location of black families and students—Hispanics are a small part of the overall population and more evenly distributed across geographic areas—the court-order (and its removal) was based on the distribution of both black and Hispanic students, and we aggregate the two minority groups in our analysis. Finally, Table I shows that the probability of being reassigned was significant
7
Appendix Table A1 presents results for the main outcomes of the paper when we instead group students by their latest known address up to Spring 2001. Appendix Table A2 presents identical results when we group students based on their address in 5th grade (students who do not enter CMS until after 5th grade are excluded from the analysis, regardless of grade cohort). These tables and all other supplementary figures and tables are numbered consecutively (A1, A2, etc…) and can be found in the online appendix.
8
Including students who have valid address data but had left CMS prior to 2001-2002 attenuates the main results slightly but does not change the statistical significance or the general pattern of our findings. Moreover, using 2002 and 2003 addresses to fill in missing address data has no impact on the main results.
11
across all neighborhoods (52%), but that students living in high minority neighborhoods were much more likely to be reassigned (81%) relative to those in low minority neighborhoods (34%).
CMS currently serves over 135,000 students and is the 18th largest school district in the nation. Moreover, the district population was growing rapidly over this period, particularly for black and Hispanic students. Within our sample, cohort size grew by 32 percent over this period, and the share of minority students grew from roughly 40 percent to about 52 percent. These trends were slightly stronger than those the entire state in overall enrollment growth across cohorts (18%) and growth in share of minority students (from 31 to 38 percent). Fifth grade math and reading scores in CMS rose from slightly below to slightly above the state average. Overall, CMS is fairly representative of large, urban school districts in the southern United States.
IV. EMPIRICAL STRATEGY
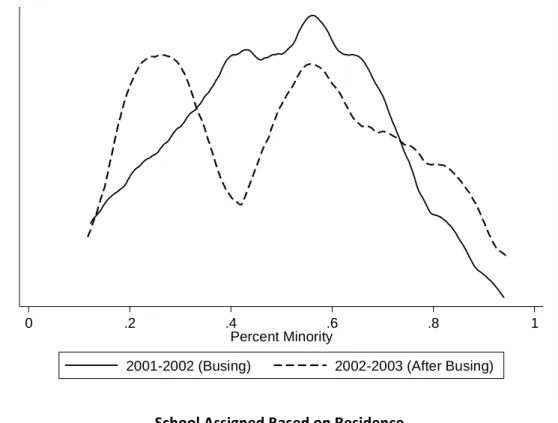
Our strategy uses student addresses measured prior to the policy change to generate quasi-experimental variation in exposure to schools of varying racial composition. Figure III shows kernel density plots (weighted by enrollment) of racial composition before and after the fall of 2002 for actual school enrollment (top panel) and school assignment based on earliest known address (bottom panel). Prior to re-zoning, most students were assigned to and attended a school where the percentage of minority students ranged between 35 and 65 percent. In the fall of 2002, these distributions show a marked shift in mass from within the 35-65 range to the more extreme parts of the distribution, consistent with the time variation shown in Figure II. It is also
interesting to note that, in line with the presence of magnet programs and alternative schools, the actual distribution of school racial composition was noticeably more disperse than the assigned distribution both before and after re-zoning. As Figure III shows, segregation increased markedly in CMS schools in the school year 2002-2003.
[FIGURE III ABOUT HERE]
The re-zoning of CMS schools in 2002 meant that students who lived in the same
neighborhoods but on opposite sides of a newly drawn boundary could be assigned to schools of very different racial compositions. In an extreme case, students living on opposite sides of a street could be assigned to different schools. While the broad trend of increasing school
segregation was predictable based on the court order, it is unlikely that families could anticipate the location of the boundary within a small neighborhood many years in advance. Our empirical
12
approach formalizes this intuition by regressing outcomes of interest on the percent minority in a student’s new school zone (based on the pre-policy change address) while controlling for old school zone by neighborhood fixed effects. We estimate:
(1)
where outcome Y for a student living in old school zone z, neighborhood and grade cohort , is regressed on the student’s new school-zone percent minority ( ), a set of covariates that includes race, gender, free lunch status and a 2nd order polynomial in 5th grade math and reading scores, cohort fixed effects based on the first year a student enters the 6th grade ( ), and old school zone by neighborhood fixed effects ( ). We also interact the cohort fixed effects with indicators for eight demographic groups (race by gender by free lunch status) in some specifications to account for time trends in the overall demographic composition of CMS. We cluster the standard errors at both the prior school zone and new school zone by parcel group levels, using the multiway clustering procedure in Cameron, Gehlbach and Miller (2011).
With old school zone by neighborhood fixed effects ( ), the coefficient on captures changes in school racial composition for students who live on opposite sides of a newly drawn boundary. In neighborhoods where there is no new boundary, will have the same value for all students, and thus will not contribute to the estimation of . We define neighborhoods in two ways. First, we use census block groups (CBGs), which are the smallest geographic area for which demographic information is released by the Census Bureau. Our second neighborhood definition is the “micro-neighborhood” parcel group, mentioned above, which is used for property tax assessment. Even with these small spatial definitions of neighborhood, 56 percent of micro-neighborhoods in CMS had a new boundary drawn through them. The median number of students per micro-neighborhood across our eight sample cohorts is 142. For increasingly small definitions of a neighborhood, our approach converges to a boundary discontinuity design as in Black (1999) and Bayer, Ferreira and McMillan (2007), with the important difference that we examine newly drawn boundaries using addresses measured prior to the redrawing. We use parcel groups in our main results, but in general our results are very similar with the two different neighborhood definitions.
While our approach considers the “treatment” to be a change in school racial composition, is in fact just one of many possible ways we could have defined the meaning of
13
the change in school boundaries. Our approach creates groups of students who lived in the same neighborhoods and were formerly zoned to the same schools. After the boundary change, some of these students received a new school assignment, and some did not. One possible approach would be to replace with an indicator variable for receiving a new school assignment. This would compare students who switched schools to students who did not.
However, boundary changes in other neighborhoods bring new peer groups into schools, even if a student’s own assignment does not change. So, in a sense, nearly every student is “treated” by the policy. We have chosen to take a particular stand on the nature of the “treatment” – namely, that it can be measured by – because the policy change represented the end of race-based busing. But, as we will show later, other ways of defining changes in peers (income, prior test scores) are equally valid. In that sense, we are estimating the impact of changes in school racial composition and everything that is correlated with it. The redrawing of CMS school boundaries led to rich variation in the racial composition of students’ assigned schools. While students were overall more likely to be assigned to schools with peers of their own race, a significant share of non-minority students were re-assigned to schools with higher minority enrollment, while a significant share of minority students were re-assigned to schools with lower minority enrollment.9
Our main results focus on the reduced form impact of being assigned to a new school. An alternative approach is to use assigned school racial composition as an instrument for actual school racial composition as part of a two-stage least squares (2SLS) procedure. We pursue the reduced form approach for two reasons. First, we must account for differential exposure by grade cohort to the new school zone boundaries, and any choice of scaling involves strong assumptions about the nature of the treatment. For example, we could estimate the impact of cumulative exposure by multiplying students’ percent minority in the new school zone by the number of years they were enrolled after the policy change. However, this assumes that the impact accumulates linearly and is the same for all age groups. Second, there is the difficult issue of how to treat students who leave CMS, since we do not know the racial composition of their new
9
Moreover, there is considerable variation even within neighborhoods - the mean interquartile range within parcel groups with variation in the change in percent minority is about 10 percentage points for the middle school boundaries and 7 percentage points for high school. Appendix Figure A3 shows the distribution of the change in the percent of minority students between each student’s new and old school zone, separately by race.
14
school (or if they are attending any school). If students who attend highly segregated schools are more likely to drop out, then a cumulative scaling would not be appropriate.
We present results with all grade cohorts pooled together, as well as separated out by “middle school” and “high school” cohorts. Students who were entering grades 6 through 8 and grades 9-12 in the fall of 2002 are in the “middle school” and “high school” cohorts respectively. We also investigate the sensitivity of our results to a wide array of alternative specifications, such as nonlinear impacts of changes in peers and different measures of school composition.
IV.A Checks on Non-Random Sorting and Attrition
The key concern with our approach is that student characteristics are systematically
correlated with being on a particular side of a newly drawn school boundary, even within small geographic areas. If true, this would confound our estimates of the impact of being zoned to a school with more minority students. While we cannot measure the influence of unobserved student characteristics, we can test whether students’ observed characteristics such as race, income and test scores are systematically correlated with our independent variable of interest. To test this, we estimate a regression like equation (1), except with as the outcome variable and demographics and prior test scores as the key independent variables, along with cohort and old zone by parcel group fixed effects. We then conduct an F-test for the joint hypothesis that all the covariates are equal to zero. None of the coefficients are individually statistically significant, and we fail to reject this hypothesis in the full sample and then in
separate specifications for the high school and middle school cohorts. These results, in Appendix Table A3, show that students in the same neighborhoods but with different values of
after the rezoning have very similar characteristics. Despite the apparent balance on prior student characteristics, we still control for them in our main specifications.
Another potential concern for our analysis is incomplete ex post observation of students in our sample, i.e., attrition bias. This is particularly relevant for short-run outcomes, like exam scores, which only are available for students who continue to be enrolled in CMS.10 In Appendix Table A4 we show that the impact of the rezoning on short-run attrition is very small and only
10
Overall, 4.3 percent of non-minority students and 3.3 percent of minority students in our analysis sample were no longer enrolled in CMS in the fall of 2002.
15
statistically significant in some specifications.11 Importantly, attrition from CMS is not a concern for our analysis of crime and college-going, which are measured outside of CMS data. Rather, the main concern in these analyses is whether the new student assignment policy is correlated with students’ future criminal activity outside of Mecklenburg County or attendance at one of the few colleges not covered by the NSC. We find no evidence to suggest that non-random attrition from these data sources is problematic for our results.12
IV.B Impact of Re-zoning on Enrollment
Another possible concern is that the location of the new school boundaries was chosen based on preexisting trends in neighborhood racial composition. In this scenario, the impact of being reassigned would be a smooth trend line that shows up in prior cohorts. We examine this possibility by estimating a series of “first stage” regressions, with (attended) school percent minority as the outcome, separately by grade and year. Concretely, we measure the impact of being reassigned in fall 2002 on the racial composition of grade cohorts from fall 1995 to fall 2006, using students’ earliest addresses in all cases. In Figure IV we present estimates from versions of equation (1), with each point representing an estimate of and its associated 95 percent confidence intervals, for a particular grade and year combination. Overall, we see no evidence of pre-trends in the percent minority of students’ attended schools in relation to the new school assignments. The confidence intervals for almost all grade cohorts prior to fall 2002 include zero, and there are no obvious trends or differences across grades. Consistent with our identification strategy, we see a steep and discontinuous spike in school percent minority beginning in fall 2002 and persisting for the next 5 cohorts. The size of this “first stage” coefficient ranges from 0.2 to 0.3, indicating that a 10 percentage point increase in assigned school percent minority leads to about a 2.5 percentage point increase in attended school percent minority. The one exception is 12th grade, where we see a much smaller estimate in fall 2002 that gradually increases for later cohorts. This is most likely due to the explicit priority that rising 12th
11
We estimate equation (1), with an indicator variable for being enrolled in CMS in fall 2002 as the outcome. We find that the probability of staying in CMS the following year rises by about 0.002 for students assigned to a school with 10 percentage points more minority students. In Panel B (Column 2), we see that this small increase is concentrated among minorities, though estimated impacts of a 10 percent increase in minority enrollment at the assigned school are always below 0.01.
12
While we cannot test for this type of non-random selection directly, the fact that we find very small increases in initial attrition from CMS related to the re-zoning helps support the notion that data limitations do not drive our results. The interpretation of later attrition is complicated by the fact that some students who leave CMS may actually be dropping out of school altogether.
16
grade students were given in the Family Choice Plan (FCP) discussed earlier, combined with a reluctance of students to change schools in their last year of high school.
[FIGURE IV ABOUT HERE]
While the estimates are relatively precise, a coefficient of less than one does suggest imperfect compliance with the newly drawn boundaries. Noncompliance can happen for three reasons. First, the use of earliest known address minimizes potential bias from student sorting, but also induces some measurement error because families may no longer live in the same
residence by 2002. Second, the FCP allowed for families to choose schools other than the ones to which they were assigned, including magnet schools (which have no neighborhood zone). As noted by Kane, Staiger and Riegg (2005), CMS made every effort to accommodate choices in the first year, in part by expanding capacity at schools where they anticipated high demand. Third, noncompliance by individual students has an indirect effect because it alters the racial
composition of the school for other students. For example, if whites are more likely than
minorities within the same school zone to opt out and attend a magnet school, then the first stage coefficient for compliers will still be less than one because the school is not as “white” as it would have been with perfect compliance.
[TABLE II ABOUT HERE]
Table II presents results for a variety of first stage outcomes. Panel A shows results from estimates of equation (1) with percent minority in a student’s fall 2002 school as the outcome. In Panel B, which allows the impact of assignment to vary by race, we see that the impact is a bit stronger for whites. The focus on the percent minority students as a policy outcome is motivated by our study of the elimination of race-based busing. Minority students tend to be poorer, have lower academic achievement, and have more disciplinary problems than non-minorities, and the policy changes we study will affect the composition of schools along these dimensions as well. To illustrate, Columns 2 and 3 of Table II show that a 10 percentage point increase in the share of minority students in the school zone also leads to having peers that are about 2 percentage points more likely to be eligible for free lunches, and who scored about 0.03 standard deviations lower on the 5th grade math exam. Thus the “first stage” results are very similar across measures of peer race, income and prior test scores. In Appendix Tables A5 through A7 we show that we can obtain very similar main results when we replace with these other measures of school composition. As in other studies of the impact of racial segregation on schools (e.g.,
17
Guryan 2004, Jackson 2009, Lutz 2011), our research design cannot separate the impact of race from other factors with which it is correlated, and our results should be interpreted with this in mind. Nevertheless, most efforts to desegregate schools have focused on ethnic and racial composition and have relied on manipulation of school boundaries, so our empirical strategy is well suited to answering a question of great policy interest.
A key point of interpretation is that our results are driven by students who comply with school zone assignments.13 Even before the policy change and the implementation of the FCP, only about 65 percent of students attended their assigned school, mostly because of the existence of magnet programs and alternative schools. This dropped to about 57 percent in 2002-2003, and gradually rose back up to about 65 percent by 2005-2006.14 We find little evidence of differential attendance by school type across the newly drawn boundaries, save a statistically significant increase in the probability of attending a magnet program that is concentrated among
non-minorities (Column 5). To the extent that magnet schools are academically better than a student’s assigned school, this will make the results for whites look more favorable than if we had perfect compliance. Finally, re-zoning may have also affected families’ decisions to change residence within CMS. In Columns 6 and 7, we examine moves between two consecutive school years, from 2001-2002 to 2002-2003 (the first year of the new student assignment plan), and find no evidence of differences in residential relocation in the years leading up to the policy change.
V. MAIN RESULTS
Table III contains the main results of the paper. Panel A presents results that pool all
students. Panels B and C allow the impacts to vary by race and race and gender respectively. The outcome in Column 1 is the average of (standardized) scores on high school EOC exams in four separate subjects.15 We find a statistically significant decrease in high school test scores of about 0.014 standard deviations for a 10 percentage point increase in share minority. The impacts are slightly larger for non-minorities, but none of the impacts by race or gender are significantly different from each other. In other studies in this literature, an increase of about 10 percentage
13
About 73 percent of minority students and 55 percent of minorities attended their assigned school, 9 percent of non-minorities and non-minorities attended their previously assigned school, 9 percent of non-non-minorities and 13 percent of non-minorities attended magnet schools, and the remaining students chose another CMS school.
14
Appendix Table A8 shows the share of students attending their home school by grade cohort and year. 15
The four high school test subjects are English I, Algebra I, Geometry and Algebra II. We average across them to maximize statistical power, and there is no strong pattern of impacts by subject. See Appendix Table A9 for separate results by test subject. In cases where a student took the exam multiple times, we only use the score from the first exam. When students are missing one or more scores, we simply take the average over the available scores.
18
points in share minority has been found to translate to a decrease in math scores of between 0.04 and 0.07 standard deviations (e.g. Hoxby 2000, Hanushek, Rivkin and Kain 2009, Vigdor and Ludwig 2008). Although we cannot make a direct comparison given differences in
methodology, scaling our reduced form coefficient of 0.014 by the “first stage” estimate from Table II (0.25) suggests that our estimates are very much in line with this earlier work.
[TABLE III ABOUT HERE]
Although there is some variation across students in the timing of the test, controlling for the grade in which the exams are taken has little effect on our estimates, suggesting that timing was not sensitive to the re-zoning. Selection into high school test taking is a more serious concern, since advanced math tests are not required for graduation and some students may drop out of high school or leave CMS prior to when they would have taken the exam. We test the robustness of our results by probing their sensitivity to different imputation procedures for missing test scores. The results of these imputations, contained in Appendix Table A10, indicate that missing values are not driving our results.
Columns 2 and 3 present results for educational attainment. The results in Panel A show no overall impact of re-zoning on high school graduation or four-year college attendance. However, we find large and statistically significant decreases in attainment for non-minority students. The estimates imply that an increase of 10 percentage points in share minority of assigned school leads to a reduction of just over 1 percentage point in both high school graduation and four-year college attendance. In contrast, we find a small increase in attainment for minority students, although the results are not significantly different from zero. We can strongly reject equality of the estimates by race (p<0.001). However, the attainment results are not significantly different by gender. When we estimate results for the high school cohorts separately by poverty status (not shown), we find that most of the impact on high school graduation is driven by poor
non-minorities (where poverty is proxied by eligibility for free or reduced-price lunches), while most of the impact on college attendance occurs among non-poor students.
Columns 4 and 5 present results for adult crime. The outcomes are indicators for whether a student has ever been arrested in Mecklenburg County and ever been incarcerated in county jail or state prison respectively. We find that students who are assigned to a school with 10
percentage points more minority students are about 0.7 percentage points more likely to have ever been arrested and 0.6 percentage points more likely to have ever been incarcerated. The
19
impact on arrests is statistically significant at the 10 percent level. In Panel B, we see that the impacts for both crime outcomes are significantly greater for minority students (p=0.002 and p=0.015). Panel C shows further that the increases in crime are driven almost entirely by minority males, who are 1.6 percentage points more likely to be arrested and 1.3 percentage points more likely to be incarcerated for a 10 percentage point increase in share minority of assigned school.
Students who move outside of Mecklenburg County (perhaps by attending an out-of-town college) could in principle commit crimes that are not recorded in our data. However, the results for criminal outcomes are nearly identical when we restrict our analysis to students with no college record, or when we eliminate students who attend college outside Mecklenburg County. We can also investigate the pattern of results over time by breaking the arrest data into four month windows. This acts as an additional robustness check, because being rezoned in 2002 should not affect crime prior to the announcement of the policy change. The results, in Appendix Figure A4, show a statistically significant increase in arrests that begins around the time of re-zoning and persists at roughly the same level for nine years, through the end of our data in 2011, when the age of students in our sample ranges roughly from 19 to 25. Appendix Table A11 contains results for additional outcomes such as selective college attendance and total number of arrests.
After the re-zoning of CMS schools, students attended schools with a greater share of peers of their own race. Thus we can project the impact of our results on racial inequality in outcomes. In Table III, we show estimated test score decreases for students of all racial backgrounds when they attend schools with more minority students. Since the re-zoning led to a decrease in the share of minority peers for white students and an increase for minority students, the net impact was a widening of racial inequality in test scores. To get a sense of the magnitude, we multiply the point estimates from Table III by the mean change in the assigned share minority before and after the re-zoning, separately by race. This calculation implies that the re-zoning widened the racial gap in high school math scores by about 0.025 SDs. However, because of the opposite signs on the coefficients for high school graduation and college attendance, we find only a very small change in the racial gap in educational attainment (about 0.3 percentage points). The impacts on crime imply that the racial gap in arrest and incarceration rates widened by about 1 percentage point, and nearly 2 percentage points for males.
20
V.A Variation in Impacts by Grade Cohort
In Table IV we allow the impact of re-zoning to vary by grade cohort. Some students were already most of the way through high school when busing ended, while others attended most of middle school and high school in more segregated schools. Examining variation in impacts across grade cohorts yields insight into the mechanisms underlying our results – for example, if the impact of school segregation is cumulative, we might expect to find larger impacts for younger grade cohorts. We estimate equation (1) for each of the main outcomes of the paper, but adding an interaction between and an indicator variable for whether a student is in the younger “middle school” cohorts, i.e. entering grades 6-8 in the fall of 2002. In this setup, the main effect gives the impact for students in the “high school” cohorts – grades 9-12 in fall 2002, and the p-value on the interaction is a test for significant differences by grade cohort. We divide the sample into these two groups for ease of presentation – Appendix Table A12 shows results that are estimated separately for each grade cohort.
[TABLE IV ABOUT HERE]
In Column 1 of Table IV, we see that a 10 percentage point increase in share minority of assigned school leads to a decrease of about 0.020 SDs for students in the high school cohorts, but the interaction term is positive, implying a decrease of only about 0.013 SDs in the middle school cohorts. This difference is marginally insignificant at conventional levels (p=0.108). In Column 2, we also see a small, positive and statistically insignificant interaction term for high school graduation. In Column 3, we find a large difference in the impact on four-year college attendance. A 10 percentage point increase in share minority of assigned school leads to a decline in college attendance of about 0.6 percentage points for the high school cohorts, but an increase of about 0.5 percentage points in the middle school cohorts. The interaction term is statistically significant at the less than 1 percent level. However, in Columns 4 and 5 we find no significant difference across cohorts for crime outcomes. The bottom half of Table IV allows these impacts to vary further by students’ own race. The pattern of results is very similar to the pooled specification.
To test for the overall significance of this pattern, we generate a summary index that 1) normalizes all five outcomes to have mean zero and standard deviation one; 2) reverses sign for the crime outcomes so that positive values are “good”; 3) takes the simple average across the 5
21
outcomes, or 4 of 5 when high school test scores are missing. We also create a similar index that averages across the three academic (i.e. non-crime) outcomes. The results are in Columns 6 and 7. We find that attending a school with 10 percentage points more minority students leads to a decline of about 0.014 SDs in outcomes for students in the high school cohorts, and about 0.010 SDs in the middle school cohorts. The difference is not statistically significant. However, we do find a highly significant (p=0.002) difference of about 0.010 SDs across cohorts for the three academic outcomes, driven mostly by four-year college attendance. The difference is larger (about 0.013 SDs) for minority students. From this we conclude that the impact of re-zoning on racial inequality was modestly larger for students in the older grade cohorts, particularly for academic outcomes and for racial minorities. The next section explores possible reasons for this pattern of results.
VI. DISCUSSION
We consider four possible explanations for the pattern of results. The first is that the impact of re-zoning comes not through changes in the school itself, but from endogenous reactions such as families exiting CMS for private school, or moving to a different neighborhood to attend another public school. We examine the impact of endogenous mobility in a variety of ways, and find no evidence that this is an important contributor to our results.16
The second possible explanation is that students may be harmed by additional school
transitions. In this scenario, it is not the racial composition of the school that matters, but simply being rezoned to any new school. We test this explanation in three ways. First, in Appendix Table A12 we analyze results separately by cohort to see if the impacts are smaller for rising 6th and 9th grade cohorts, when most students are attending a new school anyway. Second, in Appendix Table A16 we restrict the sample only to students who received a new school assignment, to see if there is a similar gradient in outcomes by peer characteristics once we eliminate students who kept the same school assignment. In both cases, we find no evidence that the results are driven by additional school transitions. A third related hypothesis is that the increase in crime among minority males is explained by the end of the long bus rides that often characterize school desegregation plans. We test for this possibility in Appendix Table A17 by
16
In Appendix Table A13 we re-estimate our main results for crime and college attendance while excluding the approximately 4 percent of students who were not enrolled in CMS in the fall of 2002. In Appendix Table A14 we exclude the approximately 14 percent of students who relocated to a new address between fall 2001 and fall 2002. In Appendix Table A15 we estimate the impact of re-zoning on attrition from CMS over time.
22
excluding the approximately 4.5 percent of students who attended non-contiguous school zones prior to the policy change (the “bused” children), but it has very little impact on our results.
VI.A Changes in Resource Allocation
A third possible explanation for the results is that the end of race-based busing shifted the allocation of resources across CMS schools. Recent work on the impact of court-ordered school desegregation in the 1960s and 1970s shows that racial integration was also accompanied by a narrowing of racial gaps in per-pupil spending and class size (Reber 2010, Cascio, Gordon, Lewis and Reber 2010, Johnson 2011). This suggests that increased resources, beyond changes in school racial composition itself, may have been an important mechanism for improvements in the outcomes of Black students during this period (e.g. Margo 1990, Card and Krueger 1992).
Did the re-segregation of CMS schools widen racial gaps in resources? Jackson (2009) shows that teachers, who are the main factor in school expenditures, sorted across schools in response to the policy change - he finds that a 10 percentage point increase in the share of black students leads to a reduction in elementary school teacher value-added of about 0.01 to 0.02 teacher-level standard deviations. Those results show that resources shifted away from schools that received inflows of poor and minority students. However, the results in Jackson (2009) only apply to the first year of the re-zoning, and are not focused on high schools.
We investigate changes in school resources over time using a detailed database of CMS teacher and staff characteristics. While we were unable to obtain disaggregated spending data for the years prior to re-zoning, the personnel data (which includes teacher salaries) go back to 1999. This enables us to calculate per-pupil spending on teacher salaries, which is the most important contributor to school spending (and nearly all of spending on instruction). We can also
investigate changes across schools and over time in teacher characteristics such as education and experience.
To address equity concerns and perhaps in anticipation of teacher sorting, CMS paired the new student assignment policy with a program called the Equity Plan, which provided additional funds to high poverty schools for recruitment bonuses for teachers, lower student-teacher ratios, school renovation projects, learning equipment and supplies (Mickelson, Smith and Southworth 2009). However, budget cuts limited the impact of the Equity Plan in the first years after re-zoning (Mickelson 2005). In 2006, CMS began a program called the High School Challenge,
23
which targeted the four high schools with the highest shares of poor and minority students. The High School Challenge was created as a response to the schools’ inability to meet state
accountability benchmarks for achievement on End-of-Course (EOC) tests, and was funded by the Mecklenburg Board of County Commissioners and the Federal Teacher Incentive Fund (TIF) (CMS Schools, 2005). The program increased teacher salaries in these schools by 15 percent and offered signing bonuses of up to $15,000, but also increased accountability, allowing for
expedited removal of teachers and principals as well as restructuring of schools that were not meeting performance standards (CMS Schools, 2008). By 2008, the High School Challenge schools had increased their performance on a composite of EOC tests by an average of 12 percentile ranks. The one school that did not make substantial gains (Garinger High School, which moved from 41 to 43 percent from 2005 to 2008) was reconstituted as five small “academy” programs with themes such as technology, business and finance, and international studies.
Teacher salary data confirm the narrative above. Per-pupil spending on teacher salaries was close to uniform across schools prior to re-zoning, become modestly more variable in 2002-2003, and then diverged further in 2006-2007 when the High School Challenge program was implemented.17 Beginning in 2006-2007, the four targeted high schools spent about 20 percent more per pupil (not including capital costs) than the average CMS high school. More generally, the relationship between the share of minority students in a CMS high school and two measures of resources (per-pupil spending net of capital costs and the student/teacher ratio) was strongly positive.
Thus one hypothesis for the pattern of results shown in Table IV is that compensatory
resource allocation toward high-minority high schools in CMS mitigated the impact of re-zoning on academic outcomes in later cohorts. As a partial test of this hypothesis, we include
along with time-varying resources in a “horse race” specification. We calculate resource measures based on the teachers in each student’s high school averaged across all post-rezoning years that the student was still enrolled. We calculate the resource measures based on students assigned rather than actual school because it mimics the construction of
and the logic of our identification strategy. Since both measures vary only at
17
Mean per-pupil spending on teacher salaries in CMS high schools was $3,494 in 2001-2002 with a standard deviation of only $354. In 2002-2003, the mean was $3,652 but the SD rose to $583. In 2006-2007, mean per-pupil spending on teacher salaries had risen to $5,313 (this includes the incentive money from the High School Challenge) with a standard deviation of $1,219.
24
the school-cohort level, this effectively asks whether the impact of changing peer composition can be explained by changes in resource allocation across schools and over time.
[TABLE V ABOUT HERE]
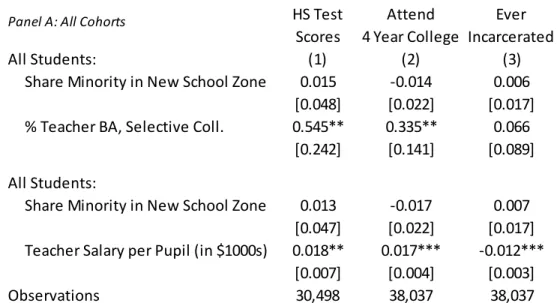
The top panel of Table V shows specifications where is entered along with the percent of teachers with a bachelor’s degree from a selective college, while the bottom panel shows separate specifications where is entered along with per-pupil teacher wages. Clotfelter, Ladd and Vigdor (2010) find that the selectivity of undergraduate institution has a statistically significant and positive impact on achievement among high school students in North Carolina. Looking at impacts on high test scores in Column 1, we see that the negative impacts in Table III can be explained completely by changes in resources. The coefficients for are positive and insignificantly different from zero for both resource measures. The pattern of results is very similar for college attendance in Column 2. We can interpret these estimates as suggesting that there is no impact of increases in assigned school share minority on academic outcomes when resources are equalized across schools. Nevertheless, we find no significant correlation between teacher education and the impacts on crime, and the coefficient on per-pupil wages, while statistically significant, is about 50 percent smaller than the impacts for academic outcomes.
It is important to note that this evidence does not demonstrate the causal impact of teacher characteristics or teacher salaries, because changes in these resource measures could be correlated with changes in other unobserved determinants of school quality, such as peer
characteristics. Still, these results provide some qualified support for the hypothesis that changes in resource allocation can explain the pattern of impacts over time.
Additional evidence that the pattern of results might be explained by academic improvements in high-minority schools over the period we study can be found in data on measures of upper level and advanced placement (AP) course-taking (Appendix Table A18). For students in the high school cohorts, being assigned to a school with more minority students led to decreased enrollment in honors and advanced math courses (defined as pre-calculus and above), as well as decreases in the probability of taking an AP science or English course. However, we find no impact on advanced course-taking for the youngest group of students.
25
If most of the impact of school segregation were driven by associated changes in resources – either financial, or in terms of nonfinancial inputs such as teacher quality – then policymakers could address racial inequality directly through compensatory policies (such as the High School Challenge), rather than manipulating student assignment directly. However, a fourth possible explanation is that the re-zoning of CMS schools led to changes in peer interactions and/or school context. Unlike the allocation of resources, peer interactions and school context may be very difficult for a school district to manipulate.
Because race, poverty and test scores are strongly correlated, the re-zoning of CMS schools also widened inequality by family income and prior achievement. In Table VI we attempt to disentangle the separate influences of each attribute by estimating another “horse race” specification that adds all three measures of changes in peers to equation (1), in the spirit of Cutler and Glaeser (1997) and Hoxby and Weingarth (2006). This specification identifies off of the independent variation across student attributes (i.e., poor whites, non-poor minorities, high-scoring poor students, etc.). We also report the p-values on F-tests for the joint hypotheses that 1) all three coefficients (race, income, test scores) are equal to zero, and 2) all three coefficients are equal to each other. The first test measures whether changes in peers have any net impact on the outcomes in each column. The second test measures whether the peer attributes are significantly different from each other.
[TABLE VI ABOUT HERE]
Our main results are robust to including all peer attributes in the model together. We fail to reject the joint hypotheses that all coefficients are equal to zero for the same set of outcomes and groups that were significantly different from zero in the main results. For crime, we also cannot reject equality of impacts across the three peer attributes. In other words, attending a school with more minority children has roughly the same impact as attending a school with more poor or lower-scoring children.
However, conditional on peer race and poverty status, attending a school with higher scoring children actually lowers students’ own test scores and makes them less likely to attend college. This pattern is stronger among whites for test scores, and stronger among minorities for four-year college attendance. This surprising result implies, for example, that students of all races benefit the most academically from exposure to more low-scoring, non-poor whites, and that they benefit the least from exposure to high-scoring, poor minorities. One possible mechanism is
26
high school course tracking, which limits access to college-level courses to the highest scoring students within a school, or the “frog pond” effect of increased competition and class rank (Attewell 2001, Crosnoe 2009). Thus the offsetting effects of peer race/income and peer prior achievement may have limited the impact of re-zoning on inequality, at least for academic outcomes.
Table VII presents results for minority males where the impact of is allowed to vary by share minority of the student’s 2000 Census Block Group (other groups are included in the model but the coefficients are not reported).18 We find no evidence of
nonlinearities for academic outcomes. However, the results for crime are highly nonlinear and indicate that nearly all of the impact on crime is driven by minority males who live in
neighborhoods that are 60 percent minority or greater. Thus the overall impact on crime is driven by relatively high concentrations of minority males being grouped together. A number of studies find support for the notion that concentrations of minority males increase crime in the aggregate (Cook and Ludwig 2005, Carrell and Hoekstra 2010, Deming 2011, Bifulco, Fletcher and Ross 2011, Imberman, Kugler and Sacerdote 2012). Mechanisms by which this might occur are
suggested by Weinberg (2007), who estimates a model of endogenous peer group association and finds that concentrations of like-minded individuals will increase connectedness among them, and by Fletcher, Ross and Zhang (2013), who show that increasing racial segregation leads to a reduction in cross-race friendships.
Finally, in Appendix Table A19, we report results from a specification where we allow the impact of re-zoning to vary across eight combinations of own income, peer race, and peer income. We find that poor minority males have higher rates of criminal involvement when they are grouped together with other poor minority males, and that crime is not significantly affected among any other groups for any combinations of demographic changes. Combined with the evidence from Table VII, this suggests that crime increases nonlinearly when poor minority males are concentrated together in the same schools.
[TABLE VII ABOUT HERE]
Changes in school context could also come from institutional reactions to peer group composition. Kinsler (2011) shows that while Black students are about twice as likely to be
18
We cannot directly stratify the analysis by school racial composition because our analysis compares students on either side of a newly drawn school boundary, and stratifying by school race would eliminate the identifying variation.