Investigation of outdoor
textiles with respect to
determine the content of
ionic perfluorinated
substances (PFASs)
Evaluation of results
Linda Hanssen, Dorte HerzkeScientific report
Preface
Extract from § 2-32. Consumer products containing perfluorooctanoic acid (PFOA), (Product regulation FOR 2004-06-01 Nr. 922, § 2-32)
From June 1 there is a prohibition against production, import, export and distribution of consumer products which contains PFOA, as a pure substance or as a mixture when the mixture contains 0.001 weight percentage or more of the substance.
From June 1 there is a prohibition against production, import, export and distribution of textiles, carpets and other surface coated consumer products which contain PFOA, when the concentration in some parts of the product is higher than or equal 1 µg/m2. Parts of the product means the materials of which the product is produced, and the product’s individual components.
This prohibition does not apply to food containers, food contact material and medical equipment. It does not apply to spare parts of consumer products made available for trade prior to June 1 2014.
NILU has on behalf of the Norwegian Environment Agency determined the concentration of ionic PFASs, including PFOA, in outdoor clothing.
Contents
Page Preface ... 3 Summary ... 7 1 Samples ... 9 2 Methods ... 10 3 Results ... 10 4 Quality Assurance ... 12 5 Discussion ... 13 6 Conclusion ... 13 7 References ... 14Appendix A Samples analysed, PFAS abbreviations and analytical reports ... 16
Summary
NILU has, on behalf of the Norwegian Environment Agency, determined the concentration of ionic perfluorinated substances (PFASs), including PFOA, in outdoor clothing. Of the investigated 12 items, PFAS was only detected in 2 of the items. Four samples contained PFOA exceeding the limit of 1 µg/m2. The quality assurance where three replicates of one sample were extracted, had a relative standard deviation (RSD) less than 10% for all detected substances except one (PFTrDA). Other quality measures such as recovery calculations and blanks, show that the method used for extraction is suitable for these types of matrixes and substances. PFOS was not present in any of the items investigated, indicating that the textile industry manages to effectively avoid PFOS in their production processes.
Investigation of outdoor textiles with respect to
determine the content of ionic perfluorinated
substances (PFASs)
Evaluation of results
1
Samples
Samples were purchased by the Norwegian Environment Agency and shipped to NILU for analysis.
Table 1: Overview of the analysed outdoor clothing. Pictures are presented in the appendix.
NILU
ID Product Brand Model Water resistance Shop
Produced in 1 Jakke, dame Arc’teryx Acto MX Hoody W’s Camellia, model 9559 DWR treated for outer layer performance Sportsnett.no China 2 Jakke, barn Reflex Bug jacket, 86 cm-18 mnd, pink, item no. 233434
Garment is waterproof, 5000 mm
* China
3 Jakke Skogstad Apple 3-layer technical
jacket, art. No. 214013
Waterproof, 10000
mm G-sport *
4 Bukse,
dame Fjällräven Keb trousers W., art. 89235 Water resistant G-sport China
5 Jakke,
unisex
Helly
Hansen Seaside jacket Waterproof XXL China
6 Bukse,
herre Lundhags
AVHU Pant, item no.
1114018 Water repellent XXL Vietnam
7 Jakke,
ungdom Bergans
Evju youth jacket, art no. 6930 Waterproof, 10000 mm XXL Myanmar 8 Jakke, vattert, barn
Jotunheim Bukkehøe mini, art. No.
271213-W13 Water repellent Anton sport Japan
9 Bukse Norrøna Falketind flex1 pants, Prod.
No. 107937
Can resist some
water Anton sport Vietnam
10 Jakke,
dame McKinley
Cedarville, WMS, art. No. 226855 001400
Water proof – even under extreme conditions
Intersport China
11 Jakke,
dame Berghaus
Vapour storm shell JKT AF, LTPNK/LTGRN 420856M88
Gore-Tex,
waterproof Intersport China
12 Jakke,
dame Didriksons
SAPI WNS JKT, art. no. 575367
100% waterproof,
min 10000 mm * China
2
Methods
To reduce the analytical uncertainty caused by inhomogeneity of the fabric, three pieces (10 x 10 cm) from different parts of the clothing, were cut out and homogenised. A subsample representing 100 cm2, were used for analyses. To give insight into the variations of the chemical analyses as well as the inhomogeneous distribution of PFASs, all three sub samples were analysed for one textile item. More details about this is presented in the quality assurance section.
The samples were transferred to a 50 mL polypropylene tube, followed by addition of internal standard (25 ng) and 20 mL of methanol (Lichrosolv quality). The following PFASs were analysed using the internal standard method: PFHxA, PFHpA, PFOA, PFNA, PFDA, PFUnDA, PFDoDA, PFTeDA, PFBS, PFHxS, PFHpS, PFOS, PFDS, 6:2 FTS, 8:2 FTS and FOSA (the abbreviations are listed in Table 5 in the appendix). After vortexing thoroughly, the samples were put in an ultrasonic bath for 30 minutes. Afterwards, the methanol extract was transferred to a new polypropylene tube and reduced to 2 mL. An aliquot was cleaned up with acidified Envicarb prior to the addition of recovery standard (brPFDA) and analysed on a UPLC-MSMS system. More details about the instrumental analysis can be found in Hanssen et al. (2013).
3
Results
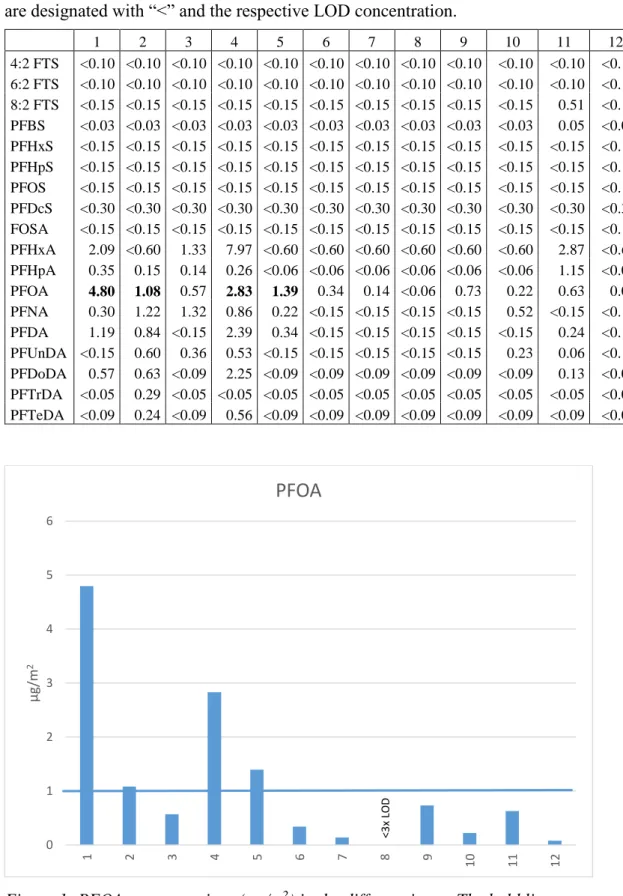
The PFAS concentrations are presented in Table 2. Of the investigated 12 items, PFAS was not detected in 2 of them (sample 8 and 12). The perfluorinated carboxylates (PFHxA, PFHpA, PFOA, PFNA, PFDA, PFUnDA, PFDoDA, PFTrDA and PFTeDA) were detected in 10 of the 12 samples. Of these ten, four contained PFOA exceeding the limit of 1 µg/m2. The PFOA content in the different samples is presented in Figure 1. For one sample, the sulfonate (PFBS) and fluortelomer sulfonate (8:2 FTS) were above the detection limit.
Table 2: The concentration of ionic PFAS (µg/m2). Numbers in bold are concentrations above the limit of 1 µg/m2 for PFOA. Concentrations below LOD are designated with “<” and the respective LOD concentration.
Figure 1: PFOA concentrations (g/m2) in the different items. The bold line indicate the 1 g/m2 concentration.
0 1 2 3 4 5 6 1 2 3 4 5 6 7 8 9 10 11 12 µ g/m 2
PFOA
<3x L O D 1 2 3 4 5 6 7 8 9 10 11 12 4:2 FTS <0.10 <0.10 <0.10 <0.10 <0.10 <0.10 <0.10 <0.10 <0.10 <0.10 <0.10 <0.10 6:2 FTS <0.10 <0.10 <0.10 <0.10 <0.10 <0.10 <0.10 <0.10 <0.10 <0.10 <0.10 <0.10 8:2 FTS <0.15 <0.15 <0.15 <0.15 <0.15 <0.15 <0.15 <0.15 <0.15 <0.15 0.51 <0.15 PFBS <0.03 <0.03 <0.03 <0.03 <0.03 <0.03 <0.03 <0.03 <0.03 <0.03 0.05 <0.03 PFHxS <0.15 <0.15 <0.15 <0.15 <0.15 <0.15 <0.15 <0.15 <0.15 <0.15 <0.15 <0.15 PFHpS <0.15 <0.15 <0.15 <0.15 <0.15 <0.15 <0.15 <0.15 <0.15 <0.15 <0.15 <0.15 PFOS <0.15 <0.15 <0.15 <0.15 <0.15 <0.15 <0.15 <0.15 <0.15 <0.15 <0.15 <0.15 PFDcS <0.30 <0.30 <0.30 <0.30 <0.30 <0.30 <0.30 <0.30 <0.30 <0.30 <0.30 <0.30 FOSA <0.15 <0.15 <0.15 <0.15 <0.15 <0.15 <0.15 <0.15 <0.15 <0.15 <0.15 <0.15 PFHxA 2.09 <0.60 1.33 7.97 <0.60 <0.60 <0.60 <0.60 <0.60 <0.60 2.87 <0.60 PFHpA 0.35 0.15 0.14 0.26 <0.06 <0.06 <0.06 <0.06 <0.06 <0.06 1.15 <0.06 PFOA 4.80 1.08 0.57 2.83 1.39 0.34 0.14 <0.06 0.73 0.22 0.63 0.08 PFNA 0.30 1.22 1.32 0.86 0.22 <0.15 <0.15 <0.15 <0.15 0.52 <0.15 <0.15 PFDA 1.19 0.84 <0.15 2.39 0.34 <0.15 <0.15 <0.15 <0.15 <0.15 0.24 <0.15 PFUnDA <0.15 0.60 0.36 0.53 <0.15 <0.15 <0.15 <0.15 <0.15 0.23 0.06 <0.15 PFDoDA 0.57 0.63 <0.09 2.25 <0.09 <0.09 <0.09 <0.09 <0.09 <0.09 0.13 <0.09 PFTrDA <0.05 0.29 <0.05 <0.05 <0.05 <0.05 <0.05 <0.05 <0.05 <0.05 <0.05 <0.05 PFTeDA <0.09 0.24 <0.09 0.56 <0.09 <0.09 <0.09 <0.09 <0.09 <0.09 <0.09 <0.094
Quality Assurance
The extraction method applied only allows for the determination of the extractable PFAS. All PFAS chemically bound to a fluoropolymer are not accessible for the applied method. Using 13C labelled internal standards for as many PFAS congeners as possible allows for a control of potential suppression of the analytical signal caused by matrix. Therefore, NILU uses a total of 14 13C labelled internal standards, which were added to the sample. To further assure the quality of the method, a certified reference material or a laboratory comparison test is part of PFAS analyses in general. However, for textiles no such material is available. To compensate for that, the recovery of the 14 13C labelled internal standards was used as an additional quality measure. The recovery differed between sample material and varied from 24 to 130%, with an average of 41%. Finally, blank controls give insight into possible contamination in the laboratory. Four blank samples were run together with the samples. None of the investigated PFASs were detected in blank samples. The limit of detection (LOD) was determined by using three times the noise of the mass transition of each PFAS in every sample. The LODs are presented together with the results in Table 2, and ranged between 0.03 and 0.60 µg/m2. The achieved LOD for PFOA of 0.06 µg/m2 is well below the threshold of 1 µg/m2 ensuring good quality of the data.
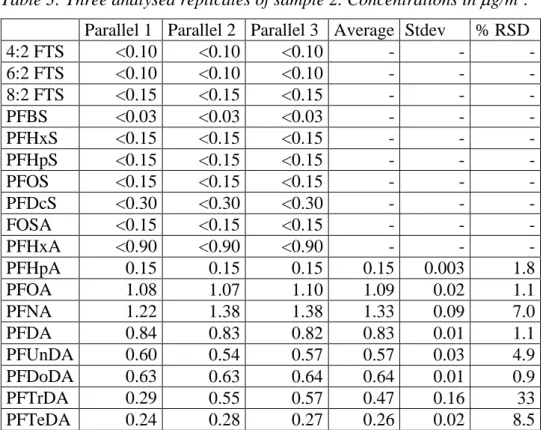
To further investigate the variation in concentration between three samples of the same textile, we chose sample 2 since the fabric was uniform in texture and colour and detectable PFAS concentrations of a broad variety were found, as well as slightly exceeding the PFOA threshold. The results are presented in Table 3.
Table 3: Three analysed replicates of sample 2. Concentrations in g/m2. Parallel 1 Parallel 2 Parallel 3 Average Stdev % RSD
4:2 FTS <0.10 <0.10 <0.10 - - - 6:2 FTS <0.10 <0.10 <0.10 - - - 8:2 FTS <0.15 <0.15 <0.15 - - - PFBS <0.03 <0.03 <0.03 - - - PFHxS <0.15 <0.15 <0.15 - - - PFHpS <0.15 <0.15 <0.15 - - - PFOS <0.15 <0.15 <0.15 - - - PFDcS <0.30 <0.30 <0.30 - - - FOSA <0.15 <0.15 <0.15 - - - PFHxA <0.90 <0.90 <0.90 - - - PFHpA 0.15 0.15 0.15 0.15 0.003 1.8 PFOA 1.08 1.07 1.10 1.09 0.02 1.1 PFNA 1.22 1.38 1.38 1.33 0.09 7.0 PFDA 0.84 0.83 0.82 0.83 0.01 1.1 PFUnDA 0.60 0.54 0.57 0.57 0.03 4.9 PFDoDA 0.63 0.63 0.64 0.64 0.01 0.9 PFTrDA 0.29 0.55 0.57 0.47 0.16 33 PFTeDA 0.24 0.28 0.27 0.26 0.02 8.5
5
Discussion
On general terms, an analytical method with uncertainties below 20% is acceptable. As shown in Table 3, the method applied by NILU results in relative standard deviations ranging between 0.9 and 8.5% which is well below the accepted uncertainty, with the exception of PFTrDA where the RSD was 33%.The increased uncertainty for PFTrDA could be explained by concentrations close to LOD and no 13C labelled internal standard available for this compound. Applying a general uncertainty of 20%, the PFOA results for sample 2 could be considered to be below the limit of 1 µg/m2 even though the parallel extractions shows that the average, as well as all the three replicates were above this limit.
The difference in PFAS content on fabrics within one sample could have an impact on the results. For sample 6, the density for the dark blue fabric was higher than the light blue fabric used on the same garment (see Table 4 in the appendix for pictures). However no PFOA from that particular item was detected, so we did not look further into this. Clothing consisting of a number of different fabrics are quite common in outdoor gear and a more detailed description of the samples are listed in Table 4. For analysis, pieces of each fabric were cut out and mixed together before extraction.
6
Conclusion
The PFOA concentration for the majority of the samples (8 of 12) was below the threshold of 1 µg/m2. The quality assurance where three replicates of one sample was extracted, had a relative standard deviation less than 10% for all detected substances except one (PFTrDA). Other quality measures, such as recovery calculations and blanks, show that the method used for extraction are suitable for these types of matrices and substances. The higher content of PFHxA and PFOA in some samples are of interest with respect to volatile PFAS as a possible source, and would be of interest to study in future projects. PFOS was not found in the items investigated, indicating that the textile industry manages to effectively avoid PFOS in their production processes.
7
References
Produktforskriften [Product regulation] (2004) Forskrift om begrensning i bruk av helse- og miljøfarlige kjemikalier og andre produkter (produktforskriften). Fastsatt av Miljøverndepartementet (nå Klima- og miljødepartementet) 1. juni 2004. FOR 2004-06-01 Nr. 922, § 2-32. URL:
https://lovdata.no/dokument/SF/forskrift/2004-06-01-922/KAPITTEL_2?q=PFOA#KAPITTEL_2
Hanssen, L., Dudarev, A.A., Huber, S., Odland, J.Ø., Nieboer, E., Sandanger, T.M. (2013) Partition of perfluoroalkyl substances (PFASs) in whole blood and plasma, assessed in maternal and umbilical cord samples from inhabitants of arctic Russia and Uzbekistan. Sci. Total Environ., 447, 430-437.
Appendix A
Samples analysed, PFAS abbreviations and
analytical reports
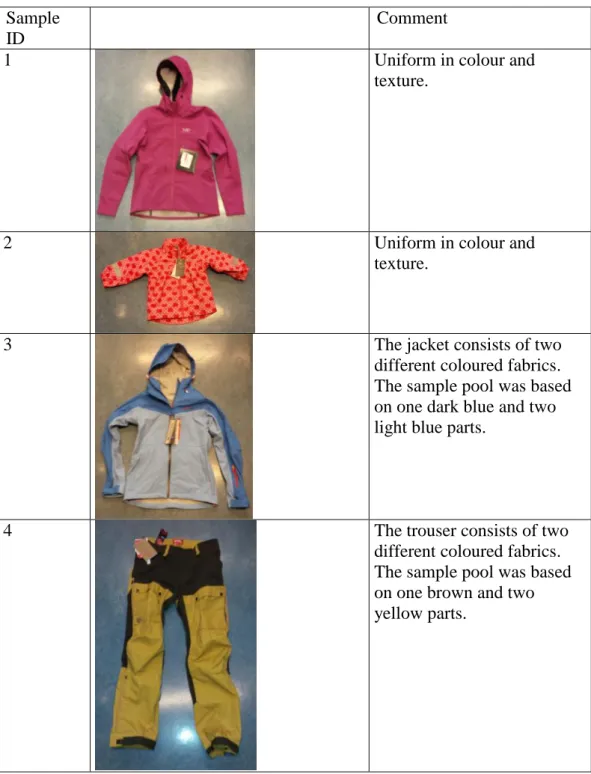
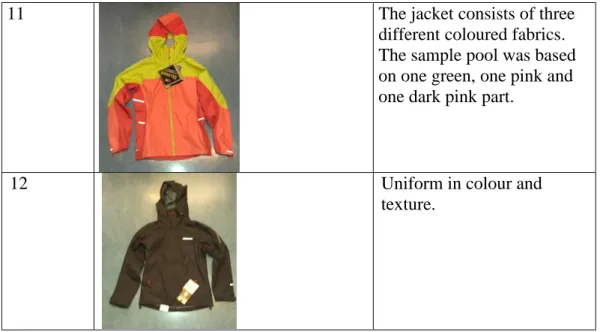
Table 4: Pictures of the analysed samples and comments with respect to type of sample analysed.
Sample ID
Comment
1 Uniform in colour and
texture.
2 Uniform in colour and
texture.
3 The jacket consists of two
different coloured fabrics. The sample pool was based on one dark blue and two light blue parts.
4 The trouser consists of two
different coloured fabrics. The sample pool was based on one brown and two yellow parts.
5 The jacket consists of two different coloured fabrics. The sample pool was based on one black and two white parts.
6 The trouser consists of two
different coloured fabrics. The sample pool was based on one dark blue and two blue parts.
7 The jacket consists of two
different coloured fabrics. The sample pool was based on one dark blue and two blue parts.
8 Only the outer layer was
analysed. The filling was removed prior to analysis.
9 Uniform in colour and
texture.
10 Uniform in colour and
11 The jacket consists of three different coloured fabrics. The sample pool was based on one green, one pink and one dark pink part.
12 Uniform in colour and
texture.
Table 5: PFAS abbreviations. Abbrevation Full name
PFBA* Perfluorobutanoic acid
PFPeA* Perfluoropentanoic acid PFHxA* Perfluorohexanoic acid PFHpA* Perfluoroheptanoic acid
PFOA* Perfluorooctanoic acid
PFNA* Perfluorononanoic acid
PFDA* Perfluorodecanoic acid
PFUnDA* Perfluoroundecanoic acid PFDoDA* Perfluorododecanoic acid PFTrDA Perfluorotridecanoic acid PFTeDA* Perfluorotetradecanoic acid PFBS Perfluoro butane sulfonic acid PFHxS* Perfluorohexane sulfonic acid PFHpS Perfluoroheptane sulfonic acid PFOS* Perfluorooctane sulfonic acid PFDcS Perfluorododecanoic sulfonic acid 4:2 FTS 4:2 fluorotelomersulfonate
6:2 FTS* 6:2 fluorotelomersulfonate 8:2 FTS 8:2 fluorotelomersulfonate FOSA* perflourooctanesulfonamide
brPFDA 3,7-dimethyl perfluorooctanoic acid (branched perfluorodecanoic acid) *Also as 13C labelled ISTD
DATE: January 2015
ISBN: 978-82-425-2743-1 (print)
NILU – Norwegian Institute for Air Research is an independent, nonprofit institution established in 1969. Through its research NILU increases the understanding of climate change, of the composition of the atmosphere, of air quality and of hazardous substances. Based on its research, NILU markets integrated services and products within analyzing, monitoring and consulting. NILU is concerned with increasing public awareness about climate change and environmental pollution.