Sexual Assault, Domestic Violence, and Stalking
by
André B. Rosay, Ph.D.
Justice Center, University of Alaska Anchorage
Darryl Wood, Ph.D.
Program in Public Affairs, Washington State University Vancouver
Marny Rivera, Ph.D.
Justice Center, University of Alaska Anchorage
Greg Postle, M.A.
Justice Center, University of Alaska Anchorage
Katherine TePas, M.A. State of Alaska
with
Alaska State Troopers, Department of Public Safety, State of Alaska Alaska Department of Law, State of Alaska
JC #0601 August 2010
Justice Center
University of Alaska Anchorage Anchorage, Alaska 99508
Published by the Justice Center in 2010 (JC #0601)
Printed in the United States of America
This project was supported by Grant No. 2005-WG-BX-0011 awarded by the National Institute of Justice, Office of Justice Programs, U.S. Department of Justice. Points of view in this document are those of the authors and do not necessarily represent the official position or policies of the U.S. Department of Justice.
Investigation and Prosecution of
Sexual Assault, Domestic Violence, and Stalking
Abstract
This project examined sexual assault, domestic violence, and stalking cases reported to the Alaska State Troopers. More specifically, we examined all sexual assault and sexual abuse of minor incidents reported to Alaska State Troopers in 2003 and 2004, all assaults in domestic violence incidents reported to Alaska State Troopers in 2004, and all stalking incidents reported to Alaska State Troopers from 1994 to 2005. In addition, we examined whether cases were referred to the Alaska Department of Law for prosecution, were accepted for prosecution, and resulted in a conviction. This report provides a thorough overview of key characteristics on reports, suspects, victims, incidents, witnesses, and legal resolutions. This report also examines the predictors of legal resolutions. Finally, this report examines whether rural cases are less likely to have successful legal
resolutions. Results clearly show that what Alaska State Troopers do when investigating reported offenses can increase rates of referral, acceptance, and conviction. In addition, we found no evidence of under-enforcement in rural areas. Contrary to allegations that the provision of criminal justice services is diminished in rural areas, we found that geographic isolation does not hinder case processing. These results are important for other rural jurisdictions. Most importantly, we found that cases first reported to local first responders had better legal resolutions. This finding suggests that the resources provided by these first responders (i.e., reduced response time and enhanced investigation) increase the rates of prosecutions and convictions. This finding is important not just in Alaska, but in other jurisdictions where official responders are not immediately available.
Investigation and Prosecution of
Sexual Assault, Domestic Violence, and Stalking
Table of Contents
I. Index of Tables and Figures 6
II. Acknowledgments 13
III. Executive Summary 14
A. Sexual Assault 14 1. Report Characteristics 14 2. Suspect Characteristics 14 3. Victim Characteristics 15 4. Victim-Suspect Characteristics 15 5. Incident Characteristics 15 6. Witness Characteristics 16 7. Legal Resolutions 16
8. Predictors of Legal Resolutions 16
9. Legal Resolutions by Race and Geography 17
10. Conclusions 17 B. Domestic Violence 18 1. Report Characteristics 18 2. Suspect Characteristics 19 3. Victim Characteristics 19 4. Victim-Suspect Characteristics 19 5. Incident Characteristics 20 6. Witness Characteristics 21 7. Legal Resolutions 21
8. Predictors of Legal Resolutions 21
9. Legal Resolutions by Race and Geography 22
10. Conclusions 22 C. Stalking 23 1. Report Characteristics 23 2. Charge Characteristics 24 3. Suspect Characteristics 24 4. Victim Characteristics 25 5. Witness Characteristics 25 6. Legal Resolutions 25
7. Predictors of Legal Resolutions 26
8. Conclusions 26
V. State of Alaska 36
A. Geography and Climate 36
B. Population 37
C. Alaska State Troopers 38
D. Alaska Department of Law 42
VI. Sexual Assault 44
A. Brief Overview of Sexual Assault in Alaska 44
B. Methodology 46 C. Report Characteristics 48 D. Suspect Characteristics 59 E. Victim Characteristics 65 F. Victim-Suspect Characteristics 70 G. Incident Characteristics 74 H. Witness Characteristics 85 I. Legal Resolutions 87
J. Predictors of Legal Resolutions 93
K. Legal Resolutions by Race and Geography 101
L. Conclusions 106
VII. Domestic Violence 109
A. Brief Overview of Domestic Violence in Alaska 109
B. Methodology 110 C. Report Characteristics 112 D. Suspect Characteristics 117 E. Victim Characteristics 124 F. Victim-Suspect Characteristics 128 G. Incident Characteristics 132 H. Witness Characteristics 143 I. Legal Resolutions 145
J. Predictors of Legal Resolutions 148
K. Legal Resolutions by Race and Geography 155
L. Conclusions 161
VIII. Stalking 164
A. Brief Overview of Stalking 164
B. Stalking Legislation in Alaska 165
C. Methodology 166 D. Report Characteristics 168 E. Charge Characteristics 175 F. Suspect Characteristics 177 G. Victim Characteristics 183 H. Witness Characteristics 187 I. Legal Resolutions 190
J. Predictors of Legal Resolutions 191
IX. References 202
X. Appendices 209
A. Sexual Assault Data Collection Instrument 210
B. Domestic Violence Data Collection Instrument 225
Section I
Index of Tables and Figures
V. State of Alaska
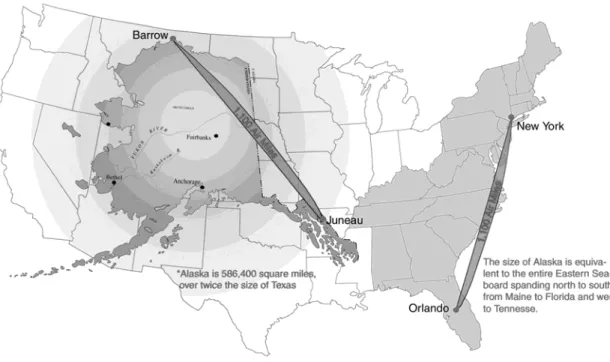
A. Geography and Climate
Figure 1. State of Alaska in Comparison to Lower 48 37
B. Population
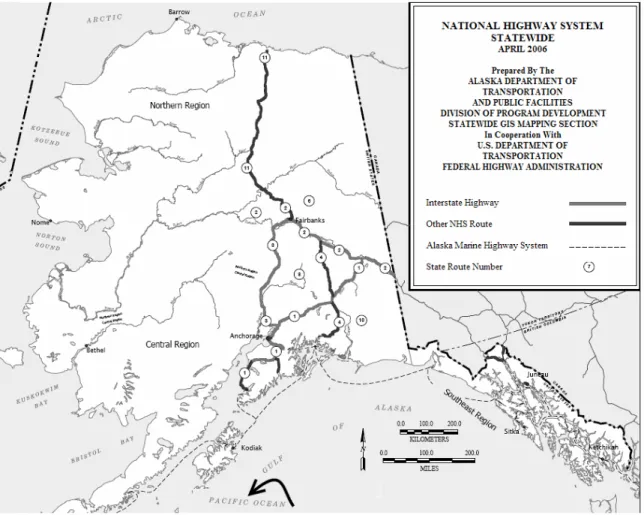
Figure 2. State of Alaska Highway System 38
C. Alaska State Troopers
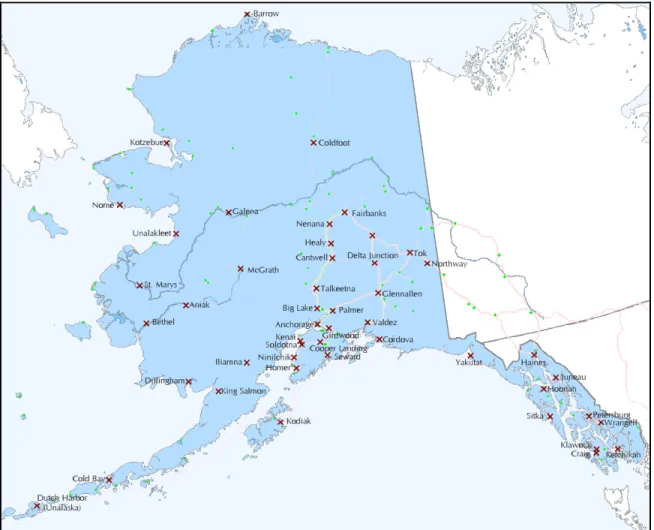
Figure 3. Alaska State Trooper and Alaska Bureau of Wildlife Enforcement Posts 40
VI. Sexual Assault
A. Brief Overview of Sexual Assault in Alaska
Figure 4. Rates of Forcible Rape in the U.S. and Alaska, 1982-2008 45
C. Report Characteristics
Table 1. Year of Report 48
Table 2. Month of Report 49
Table 3. Total Number of Reports by Detachment 49
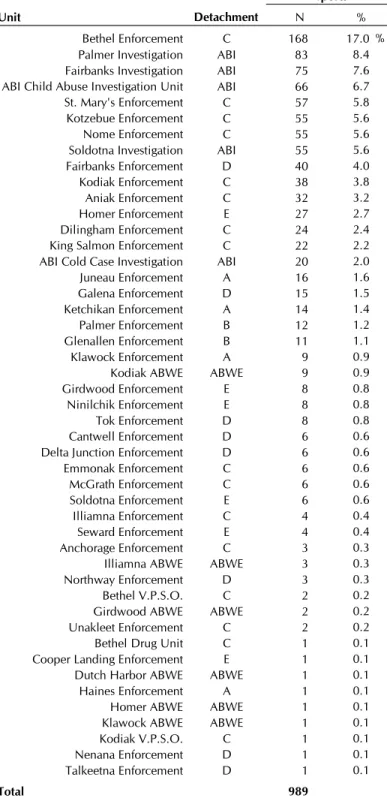
Table 4. Total Number of Reports by Unit 50
Table 5. Case Closure Codes 52
Table 6. Case Closure Codes for Cases with Minor and Adult Victims 52
Table 7. Characteristics of Unfounded Cases 53
Figure 5. Number of Weeks from Report to Case Closure 53
Table 8. First Agency Notified 54
Table 9. Collection of Evidence 55
Table 10. Applicability and Collection of Evidence 55
Table 11. Collection of Evidence for Cases with Minor and Adult Victims 56 Table 12. Timeliness of Report and Sexual Assault Evidence Collection Kits 57
Table 13. Search Warrants 57
Table 14. Forensic Exams 57
Table 15. Notifications Given to Victims 58
Table 16. Total Number of Suspects and Victims per Report 58
Table 17. Total Number of Witnesses per Report 59
D. Suspect Characteristics
Table 18. Race of Suspects 60
Table 19. General Suspect Characteristics 60
Table 21. Suspect Substance Use and Age Group 61
Figure 6. Number of Weeks from Report to Suspect Interview 62
Table 22. Characteristics of Suspect Interviews 62
Table 23. Number of Sexual Assault Charges per Suspect 63
Table 24. Number of Sexual and Non-Sexual Assault Charges per Suspect 63
Table 25. Additional Non-Sexual Assault Charges 64
Table 26. All Sexual Assault Charges 65
E. Victim Characteristics
Table 27. Race of Victims 65
Table 28. General Victim Characteristics 66
Table 29. Age of Victims at Time of Assault 66
Table 30. Victim Substance Use and Age Group 67
Table 31. Victim Injuries 67
Table 32. Emergency Medical Treatment for Injuries 68
Table 33. Timeliness of Report and Victim Injuries 68
Table 34. Timeliness of Report and SART Exams 69
Figure 7. Number of Weeks from Report to Victim Interview 69
Table 35. Characteristics of Victim Interviews 69
F. Victim-Suspect Characteristics
Table 36. Nature of Victim and Suspect Relationship 70
Table 37. Nature of Victim and Suspect Relationship (Minor Victims) 71
Table 38. Victim-Suspect Race Combinations 71
Figure 8. Victim-Suspect Age Combinations 72
Table 39. Victim-Suspect Age Combinations 73
Table 40. Victim and Suspect Living Arrangement 73
G. Incident Characteristics
Table 41. Most Serious Charge for Each Incident 74
Table 42. Total Number of Sexual Assault Charges per Incident 75
Table 43. Substance Use Involved 75
Table 44. Method of Pickup 76
Table 45. Location of Pickup 77
Table 46. Location of Assault 77
Table 47. Location of Drop-off 78
Table 48. Victim Condition at Time of Assault 78
Table 49. Victim Age Group and Condition at Time of Assault 79
Table 50. Location of Assault and Victim Condition at Time of Assault 79
Table 51. Weapons Used During Assault 80
Table 52. Incident(s) Characteristics and Sexual Acts 81
Table 53. Incident(s) Characteristics and Sexual Acts for Minor Victims 82 Table 54. Incident(s) Characteristics and Sexual Acts for Adult Victims 82
Table 55. Resistance Characteristics 83
Table 56. Resistance Characteristics for Minor Victims 83
Figure 9. Number of Days from Last Incident to Report 84
Table 58. Time from Most Recent Incident to Report 85
H. Witness Characteristics
Table 59. General Witness Characteristics 85
Table 60. Race of Witnesses 85
Table 61. Age of Witnesses 86
Table 62. Characteristics of Witness Interviews 86
I. Legal Resolutions
Table 63. Number of Cases by Stage 88
Table 64. Number of Cases with At Least One Witness by Stage 88
Table 65. Number of Cases with No Witness by Stage 88
Table 66. Number of Rural Cases by Stage 89
Table 67. Number of Urban Cases by Stage 89
Table 68. Disposition of Referred Charges 90
Table 69. Charge Progression at Referral 90
Table 70. Detailed Reason for Not Accepting Charges as Referred 91
Table 71. Disposition of Accepted Charges 92
Table 72. Detailed Reason for Accepted Charge Being Dismissed or Pled 93
J. Predictors of Legal Resolutions
Table 73. Number of Cases by Stage 94
Table 74. Coding and Frequencies for Report Characteristics 94
Table 75. Coding and Frequencies for Suspect Characteristics 96
Table 76. Coding and Frequencies for Victim Characteristics 97
Table 77. Coding and Frequencies for Incident Characteristics 97
Table 78. Coding and Frequencies for Witness Characteristics 98
Table 79. Significant Predictors of Referral 99
Table 80. Significant Predictors of Acceptance 100
Table 81. Significant Predictors of Conviction 101
K. Legal Resolutions by Race and Geography
Figure 10. Processing of Sexual Violence Cases Reported to Alaska State Troopers 103
Table 82. Attrition of Sexual Violence Cases by Victim Race 104
Table 83. Attrition of Sexual Violence Cases by Bush Stratum 105
Table 84. Attrition of Sexual Violence Cases by Community Isolation 106
VII. Domestic Violence
C. Report Characteristics
Table 85. Month of Report 112
Table 86. Person Reporting Assaults in Domestic Violence Incidents 113
Table 87. Total Number of Reports by Detachment 113
Table 89. First Agency Notified 115
Table 90. Case Closure Codes 115
Figure 11. Number of Weeks from Report to Case Closure 116
Table 91. Total Number of Charges, Suspects and Victims per Report 116
Table 92. Total Number of Witnesses per Report 117
D. Suspect Characteristics
Table 93. Race of Suspects 118
Table 94. Age of Suspects at Time of Assault 118
Table 95. General Suspect Characteristics 119
Table 96. Characteristics of Suspect Interviews 120
Figure 12. Number of Weeks from Report to Suspect Interview 121
Table 97. Number of Assault Charges per Suspect 121
Table 98. Number of Total, Assault, and Other Charges per Suspect 122
Table 99. All Assault Charges 122
Table 100. Other Charges 123
Table 101. Orders and Conditions for Suspects 124
E. Victim Characteristics
Table 102. Race of Victims 124
Table 103. Age of Victims 125
Table 104. General Victim Characteristics 125
Table 105. Victim Injuries 126
Table 106. Who Victim Consulted Prior to Reporting 126
Figure 13. Number of Weeks from Report to Victim Interview 127
Table 107. Characteristics of Victim Interviews 127
Table 108. Reasons for not Recording Victim Interviews 128
F. Victim-Suspect Characteristics
Table 109. Nature of Victim and Suspect Relationships 129
Table 110. Status of Victim and Suspect Relationship at Time of Assault 129
Table 111. Victim-Suspect Race Combinations 130
Table 112. Victim-Suspect Age Combinations 131
Figure 14. Victim-Suspect Age Groups 131
Table 113. Victim and Suspect Living Arrangement 132
G. Incident Characteristics
Table 114. Total Number of Assault Charges per Incident 133
Table 115. Most Serious Assault Charge for Each Incident 133
Table 116. Substance Use Involved in Incidents 134
Table 117. Method of Contact for Suspects and Victims not Living Together 135
Table 118. Precipitating Factors of Assault 135
Table 119. Location of Assault 136
Table 120. Presence of Others During Assault 136
Table 121. Total Number of Others Present per Incident 137
Table 123. Weapons Used During Assault 137
Table 124. Incident Characteristics (Violent Acts) 138
Table 125. Incident Characteristics (Threats) 139
Table 126. Assault Type as Threat, Physical Assault or Both 139
Table 127. Response Characteristics 139
Table 128. Stalking Behavior 140
Table 129. Suspect Injuries as Offensive or Defensive 141
Table 130. Victim Injuries as Offensive or Defensive 141
Figure 15. Number of Days from Last Incident to Report 142
Table 131. Person Who Stopped Assault 143
H. Witness Characteristics
Table 132. General Witness Characteristics 143
Table 133. Race of Witnesses 144
Table 134. Age of Witnesses 144
Table 135. Relationship of Witnesses to Suspects and Victims 145
Table 136. Characteristics of Witness Interviews 145
I. Legal Resolutions
Table 137. Number of Cases by Stage 146
Table 138. Number of Cases by Stage, for Cases with at least one Male Suspect 147 Table 139. Number of Cases by Stage, for Cases with at least one Female Suspect 147 Table 140. Number of Cases by Stage, for Cases with only Male Suspects 148 Table 141. Number of Cases by Stage, for Cases with only Female Suspects 148
J. Predictors of Legal Resolutions
Table 142. Number of Cases by Stage 149
Table 143. Coding and Frequencies for Report Characteristics 149
Table 144. Coding and Frequencies for Victim Characteristics 150
Table 145. Coding and Frequencies for Suspect Characteristics 151
Table 146. Coding and Frequencies for Victim-Suspect Characteristics 151
Table 147. Coding and Frequencies for Incident Characteristics 152
Table 148. Significant Predictors of Referral 153
Table 149. Significant Predictors of Acceptance 154
Table 150. Significant Predictors of Conviction 154
K. Legal Resolutions by Race and Geography
Figure 16. Processing of IPV Cases Reported to Alaska State Troopers, 2004 157
Table 151. Alaska and National Prosecution and Conviction Rates 158
Table 152. Alaska and National Attrition Rates 159
Table 153. Attrition Rates by Victim Race 159
VIII. Stalking
D. Report Characteristics
Table 155. Year of Report 169
Table 156. Month of Report 169
Figure 17. Number of Reports by Month and Year (3-Month Moving Average) 170
Table 157. Total Number of Reports by Detachment 170
Table 158. Total Number of Reports by Unit 171
Table 159. Case Closure Codes 172
Figure 18. Number of Weeks from Report to Case Closure 172
Table 160. Availability and Collection of Evidence 173
Table 161. Search Warrants 173
Table 162. Total Number of Stalking Charges, Suspects, and Victims per Report 174
Table 163. Total Number of Witnesses per Report 174
Table 164. Total Number of Witness Interviews per Report 175
E. Charge Characteristics
Table 165. Stalking Behaviors 176
Table 166. Primary Location for Stalking Behavior 176
Figure 19. Number of Days from Last Incident to Report 177
F. Suspect Characteristics
Table 167. Race of Suspects 178
Table 168. Age of Suspects 178
Figure 20. Number of Days from Report to Suspect Interview 178
Table 169. Characteristics of Suspect Interviews 179
Table 170. Relationship Between Suspects and Victims 179
Table 171. Number of Stalking Charges per Suspect 180
Table 172. Number of Total, Stalking, and Non-Stalking Charges per Suspect 180
Table 173. Additional Non-Stalking Charges 181
Table 174. Aggravating Factors 181
Table 175. Stalking Charge Severity by Additional Non-Stalking Charges 182
Table 176. Stalking Charge Severity by Aggravating Factors 183
G. Victim Characteristics
Table 177. Race of Victims 183
Table 178. Age of Victims 184
Table 179. Who Victim Consulted Prior to Reporting 184
Table 180. Who Reported Stalking Incident to Law Enforcement 185
Table 181. Agency First Notified 185
Table 182. Number of Interviews with Victim 186
Figure 21. Number of Days from Report to Victim Interview 186
Table 183. Characteristics of Victim Interviews 186
H. Witness Characteristics
Table 185. Total Number of Interviews per Witness 188
Table 186. Type of Witness 188
Table 187. Race of Witnesses 188
Table 188. Age of Witnesses 189
Table 189. Witness Relationships with Suspects and Victims 189
Table 190. Characteristics of Witness Interviews 190
I. Legal Resolutions
Table 191. Case Outcomes by Stage 190
J. Predictors of Legal Resolutions
Table 192. Case Outcomes by Stage 191
Table 193. Effect of Report Characteristics on Legal Resolutions 192
Table 194. Effect of Charge Characteristics on Legal Resolutions 194
Table 195. Effect of Suspect Characteristics on Legal Resolutions 195
Table 196. Effect of Victim Characteristics on Legal Resolutions 197
Table 197. Effect of Witness Characteristics on Legal Resolutions 198
K. Conclusion
Table 198. Annual Estimates of Stalking Incidents by Gender 200
Section II
Acknowledgments
This project was supported by Grant No. 2005-WG-BX-0011 awarded by the National Institute of Justice, Office of Justice Programs, U.S. Department of Justice. Points of view in this document are those of the authors and do not necessarily represent the official position or policies of the U.S. Department of Justice.
Principal investigators sincerely thank the Alaska State Troopers (Department of Public Safety, State of Alaska) and the Alaska Department of Law (State of Alaska) for
providing access to all data presented herein. From the Alaska State Troopers, we particularly acknowledge Colonel (Retired) Julia Grimes, Colonel Audie Holloway, Major (Retired) Joe Masters, Major (Retired) Howard Starbard, Major Matthew Leveque, Captain (Retired) Al Storey, Lieutenant Daniel Lowden, Lieutenant Brandon Anderson, Jeanne Slook, and Kenneth Barnett. We also acknowledge Commissioners William Tandeske, Walt Monegan, and Joe Masters. From the Alaska Department of Law, we particularly acknowledge Susan Parkes (former Deputy Attorney General), Richard Svobodny (Deputy Attorney General), Susan McLean (Chief Assistant Attorney General), and Lu Woods.
Although uncommon to acknowledge one of the authors, we do want to express our sincere gratitude to Ms. Katherine TePas. This study was envisioned and coordinated entirely by Ms. Tepas. We are extremely grateful to have such a dedicated victim advocate and program coordinator here in Alaska.
Along the way, we have talked to many different law enforcement officers, prosecutors, and victim advocates. Their assistance to help us understand crime and victimization as seen by first-responders is greatly appreciated. From the Alaska State Troopers, we sincerely thank Trooper David Bump, Trooper Teague Widmier, Trooper Andrew Merrill, Sergeant Tony April, Sergeant Rodney Johnson, Trooper Aileen Witrosky, and Trooper Kevin Yancey.
From the Alaska Department of Law, we sincerely thank Benjamin Hofmeister (Assistant District Attorney), Lance Joanis (Assistant District Attorney), Robert Collins (Assistant District Attorney), Michael Walsh (Acting District Attorney), Ben Seekins (Assistant District Attorney), and Teressa Foster (Assistant Attorney General).
We also thank Lisa Haggblom, Ginger Baim, Abbey I. Pierce, Erin Smith, Dawn Hackney, Jennifer Meyer, Kirsten Tibbers, Angie Ellis, Carrol Myers, Michelle Dewitt, Meghan Gaughan, Melanie Smith, Lynn Hootch, and Lori Bodwell.
Section III
Executive Summary
This project examined the characteristics of sexual assault, domestic violence, and stalking cases reported to Alaska State Troopers. More specifically, this project
examined all sexual assault and sexual abuse of minor incidents reported to Alaska State Troopers in 2003 and 2004, all assaults involving domestic violence reported to Alaska State Troopers in 2004, and all stalking incidents reported to Alaska State Troopers from 1994 to 2005. For each type of case, the characteristics of the reports, suspects, victims, incidents, and witnesses are documented. In addition, this project examined the legal resolutions of all cases reported to Alaska State Troopers from 1999 to 2004. Finally, this project examined the factors that predicted successful legal resolutions and examined whether legal resolutions varied by race and geography. Key results are summarized below.
A. Sexual Assault
The sample utilized for this analysis included all sexual assault and sexual abuse of minor incidents reported to Alaska State Troopers in 2003 and 2004. It included information from 989 reports, 1,903 charges, 1,050 suspects, 1,082 victims, and 771 witnesses.
1. Report Characteristics
C Detachment and the Alaska Bureau of Investigation (ABI) handled over three-fourths of all sexual assault reports. Two units alone, Bethel Enforcement (17%) and Palmer Investigation (8%) handled 25% of all reported sexual assaults during 2003-2004. Most sexual assault cases reported to AST (61%) were referred for prosecution
consideration. On average, it took 18 weeks to close a case (s = 23). Half of the cases were closed within 8 weeks, and 75% were closed within 24 weeks of being reported. AST received 86% of the initial complaints to law enforcement, 7% were reported to a VPSO, and 7% to a VPO. The most common forms of evidence collected were physical evidence from the victim and victim sexual assault evidence collection kits, collected in 22% and 20% of cases respectively. Search warrants were obtained in 36% of cases and 13% of cases had two or more search warrants. Reports typically included multiple sexual assault charges, but included multiple victims, suspects, and witnesses less often. Of all sexual assault reports to Alaska State Troopers, 47% included at least one witness.
2. Suspect Characteristics
The identity of most suspects (90%) was known by AST. Most suspects (97%) were male, and either Native (59%) or White (37%). On average, suspects were 29 years old (s = 13), with 22% between 16 and 20 years of age, 25% between 21 and 30 years of age, 20% between 31 and 40 years of age, and 13% between 41 and 50 years of
age. Forty-three percent of suspects used alcohol, but only 7% had used drugs. Only one-fourth of suspects were present upon trooper arrival. Overall, 77% of suspects were interviewed and 86% of the interviews were tape recorded. Of those interviewed, 57% were interviewed within one week of the report, 80% interviewed within one month of the report, and 97% were interviewed within one year of the report. Most suspect interviews (77%) were internally consistent. On average each suspect received 1.83 charges (s = 1.84), including an average of 1.56 sexual assault charges (s = 1.47) and an average of 0.26 non-sexual assault charges (s = 0.99). The most common non-sexual assault and sexual abuse of minor charges included assault, burglary, and kidnapping.
3. Victim Characteristics
Most victims (89%) were female, and either Native (61%) or White (38%). On average, victims were 16.2 years old (s = 10.81), with 80% of victims under the age of 21. More specifically, 11% of victims were 5 years of age or younger, 25% were six to 12 years old, 29% were 13 to 15 years old, and 16% were 16 to 20 years old. Only 27% of victims had used alcohol, and only 5% had used drugs. The most common type of injury reported was general physical pain (19%). Evidence of penetration was obtained for 17% of victims. Twenty-six percent of victims received a SART exam and 80% of victims cooperated with AST throughout the investigative process. Overall, 96% of victims were interviewed. Of those interviewed, 48% were interviewed on the day of the report, 80% within one week of the report, and 92% within one month of the report. Eighty-six percent of the interviews were tape recorded and 91% of the interviews took place in person. Lastly, 85% of the victim interviews were internally consistent.
4. Victim-Suspect Characteristics
From the 989 reports, we collected information on 1,138 unique victim-suspect combinations. Nearly half (46%) of the reported incidents involved friends and
acquaintances, 35% involved family members, 12% involved current or former partners, 4% involved a suspect that was an authority figure to the victims, and only 2% involved complete strangers. The vast majority of incidents were intra-racial (87%), with 91% of Native victims and 94% of Native suspects reporting involvement in an intra-racial incident. Comparatively, the proportion of White victims (84%) and White suspects (87%) involved in intra-racial incidents was only slightly lower than that of Native victims and Native suspects. Most victims (71%) were not living with the alleged suspect at the time of the assault.
5. Incident Characteristics
Of the 1,903 charges, 86% were for sexual assault and sexual abuse of a minor in the first, second, third, and fourth degrees. Thirty-four percent of the incidents had documented alcohol use (by either or both the victim and suspect), 32% did not involve any substance use, 29% had substance use documented as unknown, 4% involved drug use, and 2% involved both drug and alcohol use. Eighty-six percent of the incidents occurred in private residences. Beyond using their hands/arms to restrain or strike
victims, suspects almost never used weapons prior to or during the assaults (the most frequently used weapon beyond physically restraining victims was a knife, reported in a total of four incidents). Most of the reported sexual assaults involved some element of sexual penetration (60% of the incidents), as opposed to sexual contact only. The average number of sexual acts per incident was 2.16 (s = 1.82). The most common sexual acts included touching the victim’s external female genitalia (52% of incidents), penile penetration of the victim’s vagina (40% of incidents), touching of the victim’s breasts (35% of incidents), kissing (29% of incidents), and digital penetration of the victim’s vagina (25% of incidents). The use of condoms was relatively low (only 10% of incidents). However, ejaculation was reported to have occurred in 35% of the incidents. Overall, 60% of the incidents were reported within one week of the assault, and 70% were reported within one month.
6. Witness Characteristics
Of the 771 witnesses included in the 989 sexual assault reports, 97% were
interviewed. Most witnesses (94%) were cooperative with the investigation. Only 26% offered eyewitness testimony, while 78% offered corroborative evidence. Of all
witnesses, 38% were male and 62% were female, 53% were Native and 44% were White. Thirty-one percent were between 11 and 20 years of age (while 22% were 21 to 30 years of age and 19% were between 31 and 40 years of age). Fifteen percent of the witnesses had used alcohol, but only 1% had used drugs. The vast majority of witnesses (96%) provided internally consistent interviews.
7. Legal Resolutions
Legal resolutions for sexual assault incidents reported from 2003-2004 were obtained from the Alaska Department of Law. Referrals to other agencies (e.g., the Division of Juvenile Justice) were not collected for this analysis. Of the 989 sexual assault reports, 46% were referred for prosecution to the Alaska Department of Law, 28% were accepted for prosecution by the Alaska Department of Law, and 22% resulted in a conviction with the Alaska Department of Law. Sixty-percent of cases referred to the Alaska Department of Law were accepted and 80% of cases accepted by the Alaska Department of Law resulted in a conviction.
8. Predictors of Legal Resolutions
Twelve factors were found to significantly predict referral. The odds of referral were expected to increase by a factor of 3.4 when physical or DNA evidence was collected from the suspect, by a factor of 3.2 when multiple sex acts were documented, by a factor of 3.0 when the suspect had more than one charge, by a factor of 2.6 when the suspect was tape recorded, by a factor of 2.4 when the assault occurred in a private residence, by a factor of 2.2 when the victim was Alaska Native, by a factor of 2.1 when the suspect had prior arrests against the victim, by a factor of 1.7 when the victim was cooperative, by a factor of 1.6 when the victim resisted the assault, and by a factor of 1.6
when the case was closed within two weeks. On the other hand, the odds of referral were expected to be lower when the primary charge was an unclassified felony.
Nine factors were found to significantly predict acceptance. The odds of accepting cases that had been referred for prosecution were expected to increase by a factor of 4.7 when the victim was female, by a factor of 3.7 when multiple sex acts were documented, by a factor of 3.7 when the case was closed within two weeks, by a factor of 2.6 when the first responder was a local paraprofessional (e.g., VPSO), by a factor of 2.5 when the report was investigated by C Detachment (in Western Alaska), by a factor of 2.4 when Troopers took photographs of the assault scene, by a factor of 2.3 when the suspect provided inconsistent statements to Troopers, by a factor of 1.9 when the suspect had more than one charge, and by a factor of 1.7 when the suspect was interviewed within three days of the report.
Only three factors were found to significantly predict conviction – and additional research will be needed to properly interpret these findings. The odds of conviction were expected to be significantly lower when the victim received a SART exam, when the victim was disabled, and when at least one witness provided inconsistent statements to investigators.
9. Legal Resolutions by Race and Geography
We found little empirical support for allegations of discrimination in the processing of sexual violence cases by AST or DOL on a racial or geographic basis. With the exception of SAM cases against Alaska Native victims being less likely to be founded, cases of sexual violence against Alaska Native victims were just as likely or actually more likely to receive full enforcement and prosecution when compared with cases against non-Native victims. On the basis of geography, cases occurring in locations with predominately Alaska Native populations believed to be underserved by AST were actually more likely to be dealt with by AST or DOL when compared with cases from outside those geographic areas. Our results indicate that the anecdotal evidence found in reports critical of the state’s response to sexual violence against Alaska Natives does not accurately reflect the actual processing of cases of rape, sexual assault, and SAM
reported to AST and prosecuted by DOL. Ultimately, these results do not support claims of unequal enforcement by the state in response to the victimization of the Alaska Native population. However, Alaska continues to experience high rates of forcible rape, and the prosecution of sexual violence continues to be difficult: the percentage of AST-founded cases that resulted in a conviction never exceeded 30 percent.
10. Conclusions
We found several factors that Alaska State Troopers can address to increase the rate of successful legal resolutions. Three factors significantly increased the odds of both referral and acceptance. More specifically, documenting multiple sex acts more than tripled the odds of referral and almost quadrupled the odds of acceptance. Closing cases within two weeks increased the odds of referral by a factor of 1.6 and increased the odds of acceptance by a factor of 3.7. Finally, the odds of referral were tripled when the suspect had multiple charges and the odds of acceptance were doubled when the suspect
had multiple charges. Four additional factors significantly increased the odds of referral – collecting physical evidence or DNA from the suspect, tape recording the suspect, tape recording the victim, and building victim cooperation. The odds of referral were
increased by a factor of 3.4 when physical evidence or DNA was collected from the suspect, by a factor of 2.6 when the suspect was tape recorded, by a factor of 2.2 when the victim was tape recorded, and by a factor of 1.7 when Troopers were able to secure victim cooperation. Four additional factors significantly increased the odds of acceptance – taking photographs of the assault scene, interviewing the suspect within three days, finding inconsistencies in statements by the suspect, and having a local paraprofessional as the first responder. More specifically, the odds of acceptance were increased by a factor of 2.4 when Troopers took photographs of the assault scene, by a factor of 2.3 when Troopers documented inconsistencies in statements by the suspect, by a factor of 1.7 when the suspect was interviewed within three days, and by a factor of 2.6 when the first responder was a local paraprofessional.
These results are important because they highlight that what Alaska State
Troopers do can increase the rate of successful legal resolutions. With training, time, and resources, many of these factors are easily addressed (e.g., ensuring that suspect and victim statements are tape recorded). In addition, many of these factors had a
substantively large impact on the odds of referral and acceptance. Results also showed that once accepted for prosecution, cases were likely to result in conviction. Increasing the number of cases referred for prosecution and accepted for prosecution will
significantly impact overall rates of conviction.
Local paraprofessionals (e.g., Village Public Safety Officers) are important in the prosecution of sexual violence. They assist Alaska State Troopers and can address some of the factors found to significantly impact rates of referral (e.g., by building victim cooperation). Local paraprofessionals also had a direct impact on acceptance, by significantly increasing the likelihood that cases referred for prosecution would be accepted for prosecution. Contrary to recent reports, we found no evidence of under-enforcement or prosecution in rural Alaska.
B. Domestic Violence
The sample utilized for this analysis included all assaults in domestic violence incidents reported to Alaska State Troopers in 2004. It included information from 1,281 reports on 1,803 assault charges, 1,356 suspects, 1,523 victims, and 1,283 witnesses. This descriptive analysis documents the characteristics of these reports, charges, suspects, victims, witnesses, and legal resolutions. Key results are summarized below.
1. Report Characteristics
Three detachment areas (C, D and B) handled 82% of all assaults in domestic violence incidents. The three units that handled the largest number of assaults in
domestic violence incidents were the Fairbanks AST enforcement unit (23% of reports), the Palmer AST enforcement unit (18% of reports), and the Soldotna AST enforcement unit (9% of reports). Most assaults in domestic violence incidents reported to AST were closed by arrest (79%) and 13% were closed by referral. On average, it took 6.3 weeks to
close a case (s = 10.39). Forty-seven percent of the cases were closed within two weeks, and another 20% of cases were closed within four weeks of being reported. Alaska State Troopers received 80% of the initial complaints to law enforcement, 8% were reported to a Village Public Safety Officer, and 6% were reported to a Village Police Officer or Tribal Police Officer. Reports typically included a single assault charge, a single victim, a single suspect, a single witness and a single arrest. Of all assaults in domestic violence incidents reported to Alaska State Troopers, 58% included at least one witness.
2. Suspect Characteristics
Most suspects (76%) were male, and either White (51%) or Native (45%). On average, suspects were 33.13 years old (s = 11.7), with 31% between 21 and 30 years of age, 27% between 31 and 40 years of age and 20% between 41 and 50 years of age. Six percent of suspects were under 18 years of age and 7% of suspects were 51 years of age or older. Fifty-seven percent of suspects had used alcohol prior to the assault, but only 3% had used drugs. The majority of suspects (79%) were present upon trooper arrival. Overall, 79% of suspects were interviewed and 83% of the interviews were recorded. Of those interviewed, 81% were interviewed the same day the incident was reported and 96% were interviewed within one week of the report.Most suspect interviews (87%) were internally consistent. On average, each suspect received 1.78 charges (s = 1.29), including an average of 1.33 assault charges (s = 0.80) and an average of 0.45 other charges (s = 0.87). Just over 1% of suspects had a domestic violence protection order filed against them by the victim. Two percent of suspects violated a condition of release with their current charge while 4% violated a condition of probation.
3. Victim Characteristics
Most victims (70%) were female, and either White (51%) or Native (47%). On average, victims were 31.98 years old (s = 14.51). Fifteen percent of victims were minors under 18 years of age, and 10% of victims were 51 years of age or older. Nine percent of victims were 18 to 20 years old, 26% of victims were 21 to 30 years old, 21% were 31 to 40 years old, and 19% were 41 to 50 years old. Only 32% of victims had used alcohol, and only 1% had used drugs. The most common types of injury reported were bruising (38%). The majority of victims (88%) cooperated with AST throughout the investigative process. Overall, 95% of victims were interviewed. Of those interviewed, 89% were interviewed on the day of the report, and 98% were interviewed within one week of the report. In 84% of cases, the victims’ interviews were recorded and 94% of the victim interviews were internally consistent. Seventy-six percent of victims did not consult anyone prior to the assault. Victims who consulted with others were most likely to consult an official or a professional (3%), a friend (7%), or a family member (11%).
4. Victim-Suspect Characteristics
From the 1,281 reports, we collected information on 1,540 unique victim-suspect combinations. Over half (58%) of the incidents involved current or former intimate partners and this was more common in incidents involving female victims (66%) than
male victims (38%). Assaults between parents and children occurred in 19% of domestic violence incidents. Ten percent of assaults involved siblings, 8% involved roommates and 5% involved extended family members. The majority of incidents were intra-racial (86%), with 87% of Native victims and 89% of Native suspects reporting involvement in an intra-racial incident. Similarly, 87% of White victims and 87% of White suspects were involved in intra-racial incidents. Most victims (72%) were living with the suspect at the time of the assault. Few parties involved in assaults experienced a change in their relationship status around the time of the assault. In 6% of cases, the relationship ended before the assault took place and in another 2% of cases the assault took place during a time when the suspect had been rejected by or was attempting to reconcile with the victim. Despite the fact that the average age of suspects (33.14) and victims (31.96) in our sample was quite similar, 59% of victim-suspect combinations involved victims and suspects from different age groups.
5. Incident Characteristics
The term incident refers to assaults in domestic violence incidents that took place between a unique suspect and a unique victim in a single report. Therefore, a report with multiple suspects or victims resulted in multiple incidents. On average, each incident generated 1.18 assault charges (s = 0.56). Most incidents (86%) included only one assault charge. Of the 1,540 assault charges, most (83%) were for assault in the fourth degree. In fifty-nine percent of the incidents, alcohol use (by either or both the victim and suspect) was documented, in 1% drug use only was documented, and in 2% alcohol and drug use were documented. Twenty-seven percent of incidents included
documentation on the absence of alcohol and/or drug use. Ten percent of incidents lacked documentation of alcohol or drug use so an assessment could not be made as to the presence or absence of alcohol or drugs. Most of the assaults in domestic violence incidents included physical assaults (70%) as opposed to threats only or assaults and threats. Though suspects were more likely to assault victims than threaten to do so, the most common types of threats were to kill the victim (9%) and threats of other bodily injury (7%). Other threats included threatening the victim with a gun (5%), threatening the victim with a knife (5%), making threats against the victim’s family or friends (4%), threatening the victim with an object other than a traditional weapon (3%), and
threatening to sexually assault the victim (1%). The most common violent acts noted in the reports were pushing, shoving or grabbing (48%), punching (29%), and slapping or hitting the victim (28%). Less common forms of violence included in the reports were choking, strangling, or suffocating the victim (11%), grabbing or pulling the victim’s hair (10%), kicking the victim (9%), chasing the victim (7%), biting the victim (3%) and sexually assaulting the victim (1%).
Stalking behavior was uncommon. Evidence of stalking was documented in only 3% of reports. This percentage reflects only stalking, threats and forms of violence that were documented in reports as a result of victim disclosure or officer inquiry, rather than all forms of stalking, threats or violence that occurred. It is important to remember, when interpreting the figures on stalking and threats, that this study examined assaults in domestic violence incidents, not homicides.
Suspects rarely used weapons like knives or guns prior to or during the assaults (4% and 3% respectively), but they hit victims with an object in 10% of incidents and/or threw objects at the victim in 9% of incidents. The most common response to an assault employed by victims was calling police (37%) followed by running away (25%). Overall, 98% of the assaults were reported within one week of the incident. In most incidents (75%), the suspect and victim were living together at the time of the assault. The majority of assaults took place at a shared residence (55%), the residence of the victim (15%), or the residence of the suspect (10%). In 63% of incidents, other people were present during the assault. In 43% of incidents, the victim’s and/or suspect’s children were present during the assault. In 27% of incidents, only one other person was present.
6. Witness Characteristics
Of the 1,283 witnesses included in the 1,281 reported assaults in domestic
violence incidents, 92% were interviewed. Of the witnesses who were interviewed, 97% provided internally consistent interviews and 96% of all witnesses were cooperative with AST. Witnesses provided information that was more consistent with information from other witnesses (81%) or from the victim (80%) than from the suspect (42%). Witnesses were eyewitnesses in 59% of reports. Eleven percent of the witnesses had used alcohol, but less than 1% had used drugs. Of all witnesses, 48% were male and 52% were female; 56% were White and 43% were Native. Most witnesses (65%) were 21 years old or older. Twenty-six percent of witnesses were minors. Eight percent were 18 to 20 years of age and 18% were 21 to 30 years of age. Witnesses were most commonly a friend or acquaintance of the victim (35%) or suspect (35%), a son or a daughter of the victim (17%) or suspect (14%), or a parent of the victim (12%) or suspect (11%).
7. Legal Resolutions
Legal resolutions examined for assaults in domestic violence incidents reported in 2004 were obtained from the Alaska Department of Law. The focus was exclusively on referrals to the Alaska Department of Law, not on referrals to other agencies, such as the Division of Juvenile Justice. Of the 1,281 assaults in domestic violence incidents
reported to Alaska State Troopers, 80% were referred for prosecution to the Alaska Department of Law, 68% were accepted for prosecution by the Alaska Department of Law, and 54% resulted in a conviction with the Alaska Department of Law. Eighty-four percent of cases referred to the Alaska Department of Law were accepted and 80% of cases accepted by the Alaska Department of Law resulted in a conviction. Cases with at least one female suspect were slightly less likely to be referred for prosecution, to be accepted for prosecution, and to result in a conviction than cases with at least one male suspect.
8. Predictors of Legal Resolutions
The odds of cases being referred for prosecution were increased by a factor of 5.8 when the victim was interviewed by an Alaska State Trooper, 2.9 when the victim and
suspect were intimate partners, 2.5 when the suspect had used alcohol or drugs prior to the domestic violence incident, 2.3 when the case was closed within 19 days, 2.1 when the victim and suspect were not cohabitating, and 2.0 when the suspect was over 32 years of age.
The odds of referred cases being accepted for prosecution were increased by a factor of 3.1 when an Alaska State Trooper secured an admission of guilt or a full
confession from the suspect, 2.7 when multiple charges against the suspect were referred, 2.3 when someone other than the victim reported the assault, 2.3 when the victim
suffered injuries, 2.3 when children were present during the assault, 2.2 when the suspect was male.
Finally, the odds of accepted cases resulting in a conviction were increased by a factor of 2.4 when the first responder was a Village Public Safety Officer (VPSO), a Village Police Officer (VPO), or a local police department; 2.3 when the suspect was reported to have used alcohol or drugs prior to the domestic violence incident; 1.8 times when multiple charges against the suspect were referred; and 1.8 when the suspect admitted guilt or gave a full confession.
9. Legal Resolutions by Race and Geography
The consideration of disparities by victim race and geography is important because of scrutiny placed on the State of Alaska’s response to violence against Alaska Native women in rural villages. Using a slightly different sample, we examined whether legal resolutions varied by victim race and geography. Examining all intimate partner violence cases with female victims reported to Alaska State Troopers in 2004, we found that cases with Alaska Native victims were never less likely to be founded, never less likely to be referred for prosecution, never less likely to be accepted for prosecution, and never less likely to result in a conviction. Similarly, we found that cases from isolated locations (i.e., locations without a Trooper post) were never less likely to be founded, never less likely to be referred for prosecution, never less likely to be accepted for prosecution, and never less likely to result in a conviction. If anything, results indicate that assault cases involving intimate partners with Alaska Native victims and with victims from isolated villages are not neglected by the State of Alaska but are instead to be fully prosecuted.
10. Conclusion
Based on our analyses, a number of report, victim, suspect, victim-suspect, and incident characteristics predict prosecution of assaults in domestic violence incidents reported to Alaska State Troopers. Some of these characteristics are not within the control of law enforcement (e.g., who called law enforcement to report the assault). Other characteristics are in control of law enforcement and these create an opportunity to modify policy and/or practice in a way that enhances prosecution of these types of assaults. Most importantly, the odds of cases being referred for prosecution were increased by a factor of 5.8 when the victim was interviewed and 2.3 when the case was closed within 19 days. The odds of referred cases being accepted for prosecution were increased by a factor of 3.1 when an admission of guilt or a full confession was secured
from the suspect, 2.7 when multiple charges against the suspect were referred, and 2.3 when the victim injuries were documented. Finally, the odds of accepted cases resulting in a conviction were increased by a factor of 1.8 times when multiple charges against the suspect were referred and 1.8 when the suspect admitted guilt or gave a full confession. These specific results indicate that with sufficient training, time, and resources, Alaska State Troopers and other first responders (e.g., Village Public Safety Officers) can increase rates of prosecution. Most importantly, Alaska State Troopers must have the training, time, and resources to interview victims, to close cases quickly, to document victim injuries, and to secure admissions of guilt or full confessions from suspects. Thorough investigations are also likely to uncover additional charges – and these additional charges will significantly increase rates of prosecution.
We also found that cases first reported to Village Public Safety Officers had better legal resolutions. This finding suggests that the resources provided by these first
responders (i.e., reduced response time and enhanced investigation) increases conviction of assaults in domestic violence incidents. This finding is important not just in Alaska, but in other jurisdictions where official responders are not immediately available. Even when official responders are immediately available, locally based first responders may provide valuable assistance to both victims and official responders. In particular, first responders can assist law enforcement to interview victims, to close cases quickly, to document victim injuries, and to secure admissions of guilt or full confessions from suspects.
C. STALKING
The sample utilized for this analysis included all stalking incidents reported to Alaska State Troopers from 1994 to 2005. It included information from 210 reports, 222 charges, 211 suspects, 216 victims, and 246 witnesses. We also examined the legal resolutions for a sub-sample of stalking incidents (those reported from 1999 to 2004) and examined the predictors of those legal resolutions. Key results are summarized below.
1. Report Characteristics
Within the first four years of anti-stalking legislation in Alaska (1994 to 1997), the number of reports averaged 22 per year (s = 4). In subsequent years, the average number of reports dropped significantly to 15 per year (s = 3; p < 0.01). Three units (Fairbanks AST Enforcement, Plamer AST Enforcement, and Soldotna AST
Enforcement) accounted for almost half (49%) of all stalking reports within AST jurisdiction. Over 50% of stalking reports occurred in B and D detachments. Most stalking cases reported to troopers (67%) were closed by arrest. Only 4% of cases were closed as unfounded. On average, it took 43 days to close a case (s = 62). Half of the cases were closed within 20 days and 75% were closed within 46 days. Evidence (other than testimony) was available in 65% of cases and was collected in 67% of these cases. The most common forms of evidence available included physical evidence (available in 36% of cases) and electronic evidence (available in 30% of cases). Physical and
electronic evidence were also the most likely to be collected, when available. Search warrants were obtained in 13% of cases. Reports rarely included multiple stalking
charges, suspects, or victims, but often included multiple witnesses. Of all stalking reports to Alaska State Troopers, 55% included at least one witness and 29% included two or more.
2. Charge Characteristics
Of the 222 charges, 35% were for stalking in the first degree and 65% were for stalking in the second degree, 55% were between current or former intimate partners (i.e., boyfriends, girlfriends, or spouses) and 45% were between strangers, friends, and
acquaintances, 21% involved alcohol use and 79% did not, and 2% involved drug use while 98% did not. The most common forms of stalking behaviors included standing outside or visiting the victim’s home (found in 54% of charges), making unsolicited phone calls to victims (found in 51% of charges), following the victim (found in 39% of charges), threatening to physically assault the victim (found in 36% of charges),
harassing the victim’s family and friends (found in 28% of charges), trying to
communicate with the victim in other ways (found in 27% of charges), standing outside or visiting the victim’s work (found in 20% of charges), physically assaulting the victim (found in 19% of charges), sending the victim unsolicited mail (found in 15% of
charges), and vandalizing the victim’s home (found in 13% of charges). The primary locations for stalking behaviors included the victim’s house (for 45% of charges),
cyberspace (for 27% of charges), and public roads and parking lots (for 10% of charges). All but two charges (99%) were reported to troopers within one month (and over half were reported on the same day as the last stalking incident).
3. Suspect Characteristics
Few suspects (7%) were strangers. Most suspects (93%) were known by the victim and the identity of the suspect was almost always known (98%). Most suspects (98%) were male and most (78%) were White. On average, suspects were 36 years old (s
= 12), with 55% between 21 and 40 years of age. One in five suspects (20%) had used alcohol, but only 1% had used drugs. Over half of suspects (58%) were present upon trooper arrival. Overall, 60% of suspects were interviewed, with 94% interviewed within one month of the report. Most suspect interviews (87%) were internally consistent and most (73%) included an admission of guilt, but few (21%) included a confession. Half of suspects (54%) currently were or had been in a romantic relationship with the victim, most often as an ex-boyfriend or current spouse. Over half (55%) of the victim-suspect relationships had ended prior to the stalking and 58% had ended prior to the report. Most suspects were charged with only one stalking charge, but most suspects (55%) also had at least one non-stalking charge (for a total of 267 non-stalking charges). The most
common non-stalking charges included assault, violating a protective order, and
harassment. While stalking the victim, 20% of suspects violated a protective order, 9% violated their conditions of release, and 9% violated conditions of probation. Overall, 30% of suspects violated at least one of these orders or conditions. In addition, 22% of suspects had a prior arrest for stalking, assaulting, or harassing the victim. More specifically, 12% of suspects had a prior arrest for stalking the victim, 8% had a prior arrest for assaulting the victim, and 5% had a prior arrest for harassing the victim.
4. Victim Characteristics
Most victims (89%) were female and most (86%) were White. On average, victims were 33 years old (s = 12), with 55% between 21 and 40 years of age. Very few victims (2%) had used alcohol and only victim had used drugs. Most victims (79%) reported the stalking to law enforcement themselves and most victims (70%) did not consult anyone before making the report. Most reports (93%) were made directly to an Alaska State Trooper. The majority of victims (95%) were present upon trooper arrival and 95% of victims were interviewed. On average, victims were interviewed 1.5 days after making the report (s = 8), with 81% of victims interviewed on the same day the report was made. Most victims (90%) continued to cooperate with the investigation after the report was made. Most victims (99%) provided internally consistent interviews and (not surprisingly) most (60%) provided interviews that contradicted the suspect’s interview. Victims expressed to suspects that their contact was nonconsensual most commonly by contacting law enforcement prior to the stalking report (by 74% of victims). Prior contacts with law enforcement included, for example, reports of harassment made prior to the stalking report. Other methods included ending their relationships with the suspects (by 46% of victims) and verbally informing suspects that their contact was nonconsensual (by 35% of victims). Victims often utilized two or more methods.
5. Witness Characteristics
Of the 246 witnesses included in the 210 stalking reports, 93% were interviewed. Most witnesses (97%) were cooperative with the investigation. Most (79%) offered eyewitness testimony, while 18% offered corroborative evidence. Of all witnesses, 50% were male and 50% were female, 86% were White, and 43% were between 20 and 39 years of age (while 16% were less than 20 years of age and 3% were less than 10). Very few witnesses (1%) had used alcohol and none had used drugs. Most witnesses knew both the suspect and the victim. The most common relationships between witnesses and suspects included friends (reported by 55% of witnesses) and other family (reported by 33%). The most common relationships between witnesses and victims also included friends (reported by 51% of witnesses) and other family (reported by 29%). The vast majority of witnesses (99%) provided internally consistent interviews. Most witness interviews (91%) were consistent with victim interviews and most (94%) were consistent with interviews of other witnesses. However, only 44% of witness interviews were consistent with suspect interviews.
6. Legal Resolutions
Legal resolutions were obtained from the Alaska Department of Law for a sub-sample of the stalking cases (only those reported from 1999 to 2004, N = 92). Of these 92 stalking reports, 75% were referred for prosecution, 55% were accepted for
prosecution, and 40% resulted in a conviction. 74% of referred cases were accepted and 73% of accepted cases resulted in a conviction. At first glance, convictions seem more likely in Alaska than they are elsewhere.
7. Predictors of Legal Resolutions
With very rare exceptions, we did not find any stalking cases reported to Alaska State Troopers that had less than a 50% chance of being referred for prosecution, we did not find any cases referred to the Alaska Department of Law that had less than a 50% chance of being accepted for prosecution, and we did not find any cases accepted for prosecution that had less than a 50% chance of resulting in a conviction. Oftentimes, cases had a much higher likelihoods of referral, acceptance, and conviction. We found few significant predictors of referral, acceptance, and conviction (even when using relatively relaxed statistical standards).
Cases reported to Alaska State Troopers were more likely to be referred for prosecution when investigations were closed within 45 days, when suspects were charged with stalking in the first degree, when the victim reported the offense to law enforcement within 48 hours, when the charge involved domestic violence, when the charge involved alcohol or drugs, when the suspect did not follow the victim, when the suspect harassed the victim’s family and friends, when the suspect engaged in two or more different stalking behaviors, when the suspect had three of more charges, when the suspect was an intimate partner, when the relationship ended prior to the report, when the victim moved residence, when the victim used four or more methods to express that contact was nonconsensual, when witnesses provided eyewitness testimony, and when the witness testimony was consistent with the victim’s.
Once referred for prosecution, cases were more likely to be accepted for prosecution when the charge involved alcohol or drugs, when the suspect made unsolicited phone calls, when the suspect threatened to physically assault the victim, when the suspect had three or more charges, when the suspect used alcohol or drugs, and when the victim used four or more methods to express that contact was nonconsensual.
Finally, once cases were accepted for prosecution, they were more likely result in a conviction when the stalking occurred primarily at the victim’s home, when the suspect did not follow the victim, when the suspect did not physically assault the victim, when the suspect used alcohol or drugs, when the suspect had no prior arrest for assaulting the victim, when the victim did not consult with someone, when the victim interview was not tape recorded, when fewer than two witnesses were present, and when fewer than two witnesses were interviewed.
Because of small sample sizes, these results should be interpreted with great caution. The meaning and implication of some results remain unclear. Additional data will be required before making strong inferences from these results.
8. Conclusions
Although exact estimates are not available, all evidence currently suggests that stalking incidents are greatly under-reported and that the extent of under-reporting is greater in Alaska than it is elsewhere. It is therefore safe to conclude that awareness of stalking legislation should be increased. To do so, we should enhance public awareness of stalking as a crime and should train law enforcement to recognize the signs of stalking. Because many victims had prior contacts with law enforcement, this presents a unique
opportunity for intervention and law enforcement should be trained to capitalize on these opportunities.
Because of small sample sizes, we were only able to perform a preliminary analysis of what law enforcement can do to increase rates of referral, acceptance, and conviction. Nonetheless, we found several predictors of referral that are directly linked to the investigative work that Alaska State Troopers do. For example, we found that the odds of referral were significantly increased when investigations were closed within 45 days, when suspects were charged with stalking in the first degree, when the charge involved domestic violence, when the charge involved alcohol or drugs, when the suspect harassed the victim’s family and friends, when the suspect engaged in two or more
different stalking behaviors, when the suspect had three of more charges, when the victim used four or more methods to express that contact was nonconsensual, and when
witnesses provided eyewitness testimony.
These results are important because they suggest that what Alaska State Troopers do can increase rates of referral, acceptance, and conviction. Generally speaking, rates of referral, acceptance, and conviction increase when Alaska State Troopers have enough time and resources to fully investigate offenses so that their full complexity and severity can be uncovered and documented. A clear example is that if Alaska State Troopers have the time and resources to investigate all of the different ways that suspects stalked victims (and can document that suspects used multiple methods) and have the time and resources to investigate all of the different ways that victims expressed to suspects that their contact was nonconsensual (and can document that victims utilized at least four different
methods), cases were significantly more likely to be referred for prosecution. As Alaska State Troopers gain the time and resources to perform thorough investigations, they also enhance the likelihood of finding additional charges, and this dramatically increased the likelihood that cases would be referred for prosecution.
Section IV
Goals and Background for this Study
This project examined the characteristics of sexual assault, domestic violence, and stalking in Alaska. It was conducted in partnership with the Alaska State Troopers and the Alaska Department of Law. From the Alaska State Troopers, we secured detailed information on sexual assault, domestic violence, and stalking. Alaska Department of Law data were then examined to determine if cases reported to Alaska State Troopers were referred for prosecution, were accepted for prosecution, and resulted in a
conviction.
More specifically, we examined all sexual assault and sexual abuse of minor cases reported to Alaska State Troopers in 2003 and 2004, all assaults involving domestic violence reported to Alaska State Troopers in 2004, and all stalking incidents reported to Alaska State Troopers from 1994 to 2005. From these reports, we collected detailed information on reports, suspects, victims, incidents, and witnesses. This information was only collected from offenses reported to Alaska State Troopers. As a result, we have no information from offenses not reported to law enforcement or from offenses reported to local or municipal departments. Microsoft Access databases were created to capture information from Alaska State Trooper reports. These databases used in this project were based on previous work that had been done in the areas of sexual violence, domestic violence, and stalking (both locally and nationally). The content of each database was also informed by consultations with law enforcement officers, prosecutors, and victim advocates in both urban and rural Alaska. In the end, we created a very thorough data collection template for each offense included in this study (see Appendix).
All reports were photocopied by Alaska State Troopers and shipped to
headquarters. A team of trained research assistants then read each report (2,480 reports) and entered information about each case directly into the Microsoft Access databases. Reliability checks were performed by randomly selecting some cases to be entered into the databases by different research assistants. An on-site supervisor was present for all data entry to answer questions and to resolve discrepancies across research assistants. Throughout this project, we worked closely with Alaska State Troopers to design and conduct this study.
Throughout this project, we also worked closely with the Alaska Department of Law. The Alaska Department of Law provided all data on legal resolutions. For all sexual violence, domestic violence, and stalking cases, we examined whether cases were referred for prosecution, whether cases were accepted for prosecution, and whether cases resulted in a conviction. In the sexual assault and sexual abuse of a minor sample, we collected additional information on case processing. All information from the Alaska Department of Law was manually or electronically retrieved from a statewide
management information system.
Broadly speaking, the goals of the project were to provide thorough descriptions of sexual violence, domestic violence, and stalking in Alaska. These were the first descriptions of violence against women reported to Alaska State Troopers. Although some descriptions of offenses reported to municipal agencies were available, there was