THE EFFECTIVENESS OF A MATH TUTORING PROGRAM AT AN URBAN HIGH SCHOOL
Shannon M. Sample
A Thesis
Submitted to the Graduate College of Bowling Green State University in partial fulfillment of
the requirements for the degree of
MASTER OF EDUCATION August 2010
Committee:
Dr. John Fischer, Advisor Dr. Toni Sondergeld Dr. Art Samel
Dr. John Fischer, Advisor
Abstract
The objective of this study is to assess the effectiveness of a math tutoring program at a high school that is part of a large, inner-city school district. Participating students completed identical pre- and post- Likert-scaled surveys, which included statements about math and math tutoring. Additionally, students were administered a pre-assessment and a corresponding post-assessment that tested their level of performance in math. The matching post-assessments solely contained questions that were formulated from the Ohio Academic Content Standards. Analysis methods for this study included the evaluation of how many students selected each the “Agree” or “Strongly Agree” option from the Likert-scale on the survey. In addition, both assessments were analyzed based on how students performed in each math concept category that was addressed on the assessment, as well as what percentage of students answered each item
correctly. The results from a dependent t-test that compared the average scores from the pre- and post-assessment showed no evidence of statistical significance. However, there was evidence of improvement in the optimistic responses on the attitudinal survey from pre- to post-assessment. Furthermore, there was substantial improvement in specific math concepts represented in the higher-scoring percentage category from pre- to post-assessment. Overall, it has been concluded that many students who participated in the study will likely be more willing to learn about math since their attitudes toward it and performance in the subject have changed for the better.
ACKNOWLEDGEMENTS
I would like to recognize my committee chair, Dr. John Fischer, as well as the other members of my graduate committee, Drs. Toni Sondergeld and Art Samel. Your advice and guidance have
greatly enhanced my journey to becoming a lifelong learner.
I am also earnestly thankful to my friends and family who have offered such overwhelming support and encouragement. You all are greatly appreciated.
“Trust in the Lord with all thine heart; and lean not unto thine own understanding. In all thy ways acknowledge Him, and He shall direct thy paths.”
TABLE OF CONTENTS
Page
CHAPTER ONE: INTRODUCTION ... 1
Topic and Purpose... 3
Research Questions ... 6
CHAPTER TWO: REVIEW OF RELATED LITERATURE ... 8
Students’ Attitudes and Achievement in Math ... 8
Tutoring Programs ... 10
CHAPTER THREE: METHODS AND PROCEDURES ...… 14
Purpose and Research Questions ... 14
Researcher Role and Participation ... 14
Research Design and Methodology ... 15
Instrumentation and Procedures…... ... 16
Sampling Method and Sample ... 17
Limitations ... 20
CHAPTER FOUR: RESULTS ... 22
Summary of Literature ... 22
Survey and Assessment Results ... 23
CHAPTER FIVE: CONCLUSIONS ... 39
Summary of Purpose ... 39 Explanation of Results ... 40 Implications ... 44 Future Research ... 45 Conclusions ... 46 REFERENCE ... 47
APPENDIX A. MATH ATTITUDE SURVEY ... 50
APPENDIX B. PRE- AND POST-ASSESSMENT ... 52
APPENDIX C. PRE-SURVEY MATH PERCENTAGES ... 62
APPENDIX D. PRE-SURVEY MATH TUTORING PERCENTAGES ... 64
APPENDIX E. POST-SURVEY MATH PERCENTAGES ... 66
APPENDIX F. POST-SURVEY MATH TUTORING PERCENTAGES ... 68
APPENDIX G. PRE- VS. POST-SURVEY PERCENTAGES ... 70
LIST OF TABLES/FIGURES
Table/Figure Page
1 Figure 1. Variables Defined ... 7 2 Figure 2. Research Questions vs. Analyses ... 20
3 Figure 3. Percentage of Students who Chose the Correct Answer
Per Pre-Assessment Item ... 28
4 Figure 4. Overall Number of Pre-assessment Items per Percentage
Category ... 30
5 Figure 5. Percentage of Students who Chose the Correct Answer
Per Post-Assessment Item ... 32
6 Figure 6. Overall Number of Post-assessment Items per Percentage
Category ... 34
7 Figure 7. Pre- vs. Post-assessment Percentages of Students who Chose the
Correct Answer Per Item ... 37
8 Figure 8. Difference Curve for Change in Correct Percentages for Each
Assessment Item ... 41
10 Figure 10. Math Concept Category Rankings for Post-assessment ... 43
CHAPTER ONE: INTRODUCTION
School tends to compete for adolescents’ attention along with the other demands that come with adolescence (Arnett, 2007). Core subjects can be on that list of demands, and hold a very important place of importance in the curriculum and even in choosing future careers (Saffer, 1999). Identified as a core subject, math is deemed as the “bedrock of our modern world” and it is of crucial importance that students are successfully taught to understand the concepts that lie within math, as the skills involved are an integral part of our society (Roman, 2004, p. 16). Knowledge of mathematical concepts is one of the all-important skills needed in order to
function in most parts of society. Many may not realize that math is the tool that we use to make sense of our world in numbers. Not only are math skills needed for simple functions such as calculating purchase totals and being able to read graphs to understand trends and patterns, but math is also an integral part of science as well. Many of the sciences (i.e. physical sciences, chemistry, astronomy, etc.) require proficiency in math, and the background knowledge associated with the sciences can be used for everyday problem solving. With a strong
foundation in basic mathematics, a repertoire can be built up, possibly leading the way to a math or science-related career, something that many students tend to rule out.
The GEAR UP program, which stands for Gaining Early Awareness and Readiness for Undergraduate Programs, is a federally funded grant program “designed to increase the number of low-income students who are prepared to enter and succeed in postsecondary education” (Bowling Green State University GEAR UP, 2010). My affiliation with this program is through Bowling Green State University’s branch of the program, where it has collaborated with *
River High School of a large inner-city district in Northwest Ohio. The purpose of this partnership is
to encourage academic success and to improve retention and graduation rates. Through the GEAR UP program at River High School, a math tutoring program has been implemented in the hopes of helping freshmen and sophomore students pass Algebra 1 and Geometry, two obstacles that can be a challenge in the journey towards graduation. The math tutoring program meets twice a week immediately after school in the school’s cafeteria for one hour. The majority of the tutees are 9th and 10th grade students, as the program is mostly marketed to that particular
population of the school. However, there are some 11th and 12th grade students who participate in the program, and as a result are part of the sample involved in this study. Most 9th grade students are enrolled in Algebra I and the majority of 10th grade students are taking Geometry, which is the normal track for college prepatory coursework in this school. In addition, some of the upper classmen are taking Algebra II, which is another course that is represented in the tutoring program repertoire.
A typical afternoon of math tutoring consists of 9th and 10th grade tutees, as well as 11th and 12th graders who serve as peer tutors, gathering in the cafeteria. Math teachers who are willing to put in the afterschool time to help their students and others who need extra math assistance are there as well. In a locked storage space in the school cafeteria are two file carts which are rolled out for each session. They hold designated Algebra 1 and Geometry content materials. On another cart full of materials are resources for tutors and tutees such as pencils, scrap paper, individual-sized dry-erase boards, dry erase markers, and math course content books that match those assigned to the students. If students have extra time to complete the worksheets in the file carts after their homework is finished, then the tutors may choose a worksheet for the student based on the provided pacing guide (a week-by-week curriculum outline for a designated math course) for either Algebra 1 or Geometry. During a typical after school session, after
signing in for the day, it usually takes students about 10 minutes to settle down and start on their homework or assigned worksheet from their class cart. Each student or group’s assigned tutor is responsible for keeping the tutee on task. During the hour session, there should be minimal conversation between tutees, unless it is math-related. Though this protocol is ideal, it is rare that is it consistently followed. There is almost always a steady chatter between tutors and tutees concerning the topic being taught. Upon the clock reaching 4:25 pm, the Algebra 1 and
Geometry carts are re-filled with the returned resources that were used by students and their peer tutors during that session, and after signing out, tutors and tutees can leave as they please, once the designated time arrives.
This program has been running for six years on grant and fundraising money. However, GEAR UP is currently in its second to last year in this school and the funding for this program and others will cease to exist at the end of the next school year. If the math tutoring program is going to continue after GEAR UP funds are no longer available, data providing evidence of its success with increasing tutee attitudes and performance regarding math must be provided in order to receive district funding.
Topic and Purpose
Resulting from the mentioned ideas, measuring the impact of the math tutoring program has captured the researcher’s interest for many reasons. As a student progressing through grade-school, the researcher did not begin to appreciate math until she began to understand it for herself. Due to the new-found appreciation, she was able explain math to her classmates, while possessing the ability to apply it to her surroundings outside of school. In early grades when she struggled with math, her parents made a successful effort to provide her with resources such as math-related books and flashcards, which allowed her to appreciate and understand the basic
concepts of math. In addition, as the last resort for her success, her parents sent her to a popular math tutoring center, which boosted her appreciation of the subject even more. This led to the pursuit of a teaching career in middle-level math and science in an effort to coax students into understanding just how important math is in our everyday society.
Much of society is aware that math is considered one of the most difficult and
challenging academic subjects out of the four core subject areas. Harry T. Roman, a technology and related concepts researcher, supports this when he explains that kids and even parents often complain about the need and use of math and how it “doesn’t relate to anything” (Roman, 2004, p. 16). It is my assertion that the average student, especially at a younger age, is likely to give up on a subject that requires calculation and multiple tries if the correct answer is not generated the first time. With this belief in mind, combined with the historic debate that superior learning can occur when students receive individualized one-to-one tutoring, it would be fair to say that a student struggling in math might benefit from personalized tutoring (Schacter, 2000). In addition to this, it has even been argued that students can learn more from a peer tutor, or someone who is in the age group of the student being tutored. Schacter, via educational scholar Jean Piaget, also proposed the idea that “when children interact with other children they are both agents and recipients of instruction.” In an effort to reach more students, “tutoring programs…are open to boys and girls in ordinary classrooms throughout the country” in order to boost students’ understanding of concepts associated with mathematics (Cohen, 1982, p. 237).
The struggle to achieve success in mathematics stands especially true for economically disadvantaged students, who are often minorities such as African-American and Latino students. This is evident through the National Assessment of Educational Progress (NAEP) statistics from past years, which show that black and Hispanic students are continually outperformed by their
white and Asian/Pacific Islander counterparts (Holloway, 2004; Walker, 2006). The
underachievement of these two minority groups has been extensively documented in past years by many researchers and has been identified as a major problem in American education (Walker, 2007; Walker, 2006). In typical urban school districts, populations are usually comprised of a vast majority of these minority students. Math tutoring programs can serve as a great outlet for those students who are struggling. In accordance with the lack of success in mathematics on behalf of these two minority groups, Robinson, Schofield, and Steers-Wentzell (2005) suggest that “low levels of math achievement serve as a serious barrier for entry into a large number of well-paying scientific and technical occupations in which African-American and Hispanic
students are strikingly underrepresented” (p. 329). With so many future effects at stake, it causes one to wonder what is being done to improve these unfortunate statistics.
As a graduate assistant for an educational reform program funded by the government (GEAR UP), the researcher was placed in an urban high school where approximately half of the school’s population is white and the other half is ethnic minority. Though 55% of the students in the building are considered Caucasian, still about 24% are African-American and 17% Hispanic (Ohio Department of Education, 2009). In addition to this, about 3% of the students are multi-racial, with 63% of the entire student population eligible for an economically disadvantaged government classification. Unfortunately, according to the school’s 2008-2009 local report card and math scores on the Ohio Graduation Test, River High School’s overall population of
students has not performed well in mathematics, as previously mentioned research suggests. These data show that only 68.9% of 10th graders passed the Ohio Graduation Test in 2009, and 82.2% of 11th graders passed the test, neither meeting the state requirements of 75% and 85% respectively for state proficiency. In an effort to meet students’ needs to succeed in math, and in
conjunction with the GEAR UP program, River High School implemented an after school math tutoring program. This math tutoring program is primarily a peer tutoring program, one in which a group of high-achieving math students have been recruited to “provide one-on-one instruction for another student [or students], accompanied by explicit assignment[s] of participants to “tutor” to “tutee” roles (Roscoe & Chi, 2007, p. 535). The program is sponsored by GEAR UP in
response to the trend of underachievement in mathematics, as documented in the Ohio Department of Education school report card, which is based on student performance at the school.
Research Questions
In order to keep the program running after GEAR UP leaves the building, the school would like to know what makes the math tutoring program effective and what impacts students’ decisions to participate in or leave the program. As one who has completed an undergraduate degree in the areas of math and science education, and as a participating tutor in the program, it has become the researcher’s deep interest to analyze the effectiveness of the math tutoring program at River High School. Through this analysis, students’ performance in math and their attitudes toward math will also be assessed. The research questions for this study are as follows: 1) Does the program impact students’ attitudes toward math over time? 2) Does the program impact students’ attitudes toward math tutoring over time? 3) Does the program impact students’ ability in math over time? Results from these questions will provide a well-rounded perspective on the effectiveness of the math tutoring program on behalf of the students (see Figure 1).
Figure 1. Variables Defined
Variable Definition
Math Tutoring Program The math tutoring program refers to the GEAR UP-
sponsored after school math tutoring program. This program assigns upper classmen students as tutors to 9th and 10th grade tutees.
Student Attitudes Toward This describes how the student feels concerning their ability Math in math, as well as the opinion they have come to form
about the subject of math in general. Student Attitudes Toward Student attitudes toward math tutoring describe how the Math Tutoring students view the impact of the math tutoring program as
connected to their proficiency and confidence in math. Student Math Ability Student math ability is concerned with the results of their
pre- and post-assessments. This primarily involves their numeric scores on these assessments.
CHAPTER TWO: REVIEW OF RELATED LITERATURE
Due to the amount of research available that highlights the impacts of tutoring, it is clear that a number of researchers have taken notice of this avenue of learning. Though there has been a considerable amount of research done concerning tutoring programs, those dealing with
underserved high school students such are not as well documented (Walker, 2007). In addition to this, “many of the programs that address the problem of Black and Latino/a underachievement in secondary mathematics are out-of-school, off-site, and/or summer programs.” Findings on the mentioned topics were limited, but what was found has provided me with a stable foundation. Now equipped with the ability to recognize the benefits of math tutoring programs, this
foundation has enabled me to build my own thoughts concerning past findings on tutoring programs and minority math achievement.
Student Attitudes and Achievement in Math
A major part of this study will be to determine how students’ attitudes toward both math and math tutoring change from the start of the school year to the latter end of the school year. Concerning student attitudes toward math in general, research generally shows that students do not “associate math activities with enjoyment” (Mitchell, 1999, p. 1). This finding is not
surprising, and has become my hypothesis concerning students’ attitudes toward math. The logic of my expecting students to side with negative connotations of math comes from my peers’ and my own not-so-great opinions of the subject as a grade school student. It takes work and practice to master math skills, and at first, many students are not eager to put forth the effort to do so. Another reason for this hypothesis stems from hearing students say things like “I can’t do this” and “I don’t get it” when trying to reason with them while working through a math problem during math tutoring. Trisha Mitchell’s action research project conducted at a primary school in
Sydney, Australia, found through survey responses from her students, that even in younger grades students “indicated a strong polarization towards negative attitudes [in math].” This is disappointing news for those involved in math education. However, if negative attitudes towards math begin in primary grades for some students, attitudes toward math in adolescent and young adult students may be even worse. More specifically, research involving economically
disadvantaged students’ attitudes toward math is also an aspect of this project. The math tutoring program at River High School serves many economically disadvantaged students (Ohio
Department of Education, 2009), who also happen to be African-American and Latino. With this in mind, research has found that “contrary to persistent myth, it’s not that they lack interest in math or don’t have high educational aspirations. In fact, several studies document that Black and Latino students sometimes have more positive attitudes toward mathematics…than do their white counterparts, especially in the early years of secondary school” (Walker, 2007, p. 48). There is hope that shines through this statement, as it reveals that not all is lost when it comes to minority students’ perceptions of math.
Through conducting this study and even through participation in the program as an adult tutor, the researcher found that many students’ attitudes toward math are affected by their peers’ attitudes toward math. A report by Erica N. Walker (2006) titled Urban High School Students’
Academic Communities and Their Effects on Mathematics Success points this out. She claims that “more attention should be directed to the attitudes and behaviors of students themselves, the explanations they give for their academic success…,student peer group norms, and the implicit and explicit support (or lack of support) for academic success they may receive from their peers.” This idea is definitely something to keep in mind when analyzing a phenomenon such as a tutoring program, especially a math tutoring program that is set up in a secondary school,
where adolescents are easily influenced by their peers (Arnett, 2007). Keeping the aim of a positive peer influence in mind, Walker goes on to describe how many authors have expressed the importance of students being a part of peer groups that advocate their learning in math. This applies to the math tutoring program at hand because through observing the participating high school students, it is clear that many students have the attitude that math tutoring is a social program. The researcher even noticed that many students had been attending math tutoring after school with a group of friends. However, this does not necessarily indicate that because peers participate in math tutoring together, they have the same attitudes toward math. The researcher also came to know, as an adult tutor, that some of the involved students had very different opinions of math compared to what their friends thought about the subject. Overall, in
agreement with Walker’s previous statements, the reseacher believes that students can benefit from a peer group that is conducive to a positive attitude towards math. Students’ attitudes toward math are valuable for this study because it is being used as a variable in determining the effectiveness of this math tutoring program.
Tutoring Programs
The practice of students teaching other students has a history that dates all the way back to the ancient Greeks (Robinson et al., 2005). However, it was not until recent years that peer-assisted learning gained attention in literature and it was at that time when the emphasis on this phenomenon shifted to focus on the benefits it provided to both tutors and tutees. In addition, the potential of tutors benefitting academically, combined with the lower costs and large selections of potential tutors, has contributed as a factor and enduring reason as to why peer tutoring is such a justified avenue for student learning (Roscoe & Chi, 2007). Peer tutoring can also be considered “same-age” tutoring. Same-age tutoring is the practice that has been put into
place as the main teaching pedagogy in the tutoring program that is being studied. According to Roscoe and Chi, “in same-age tutoring, tutors and tutees are of a similar age or grade [and] participants are more likely to be actual peers because they attend the same classes or interact outside of tutoring.” In the way that this particular program is structured, tutors are assigned to at least one person each, and on some occasions there may be one tutor working with up to three students at a time. In addition, up to seven math teachers can be present at every after school session to serve as a personal tutor for their students, or to help supplement tutor-tutee learning.
Tutoring Benefits
The impact of tutor learning over the spectrum of academic subjects can also have an effect on tutors. Tutors seem able to learn through tutoring, no matter what subject they are teaching. Based on these findings and others, it is revealed that not only do tutees benefit from tutoring programs, but the tutors of the program gain from it as well (Cohen et al., 1982). However, math is among the subjects that may exhibit stronger gains than other programs such as reading (Roscoe & Chi, 2007). The data collected by John Schacter (2000) also shows that students working with other students increases learning and achievement. Cohen, Kulik, and Kulik (1982), completed a comprehensive study that included 65 separate studies of different tutoring programs across the nation that have been identified as effective. Eight of these studies reported on student attitudes toward the subject area in which they were being tutored. In all eight of the studies documented by Cohen et al., student attitudes were more positive in classrooms with tutoring programs, and in seven of the eight studies, self-concepts were more favorable for students in classrooms with tutoring programs. Additionally, Schacter found that students in individual tutoring programs performed significantly better than students in other collaborative learning-type programs. The authors of the meta-analysis also discuss how the
programs “have definite and positive effects on the academic performance and attitudes of those who receive tutoring” and how tutored students outperformed their peers on exams. From these statements, it is clear that the potential benefits associated with tutoring programs can have remarkable impacts on student achievement.
Studies of the effects of tutoring programs have included potential outcomes for
minorities as well. Robinson et al., (2005) discuss how in prior research it was “concluded that peer-assisted learning strategies were especially beneficial to minority students,” and state how other researchers suggest that this could be true for minorities in a number of different domains, including mathematics (p. 330). Research also considers how strategies such as “collaborative learning approaches are known to have a positive impact on minority students’ academic achievement.” Furthermore, Roscoe and Chi (2007) again support the notion that such tutoring programs can have benefits for tutors and tutees, and this is one of the most appealing aspects of peer tutoring: the opportunity to support learning for both the tutees and the tutors.
Overall, varied research supports that tutoring programs have substantial benefits. Benefits that are more specific include the fact that “peer…tutoring [has] had a positive impact on a variety of math proficiencies, including arithmetic computation, conceptual understanding, and problem solving skills. Moreover, this finding held true for inner city and minority students as well as for others” (Robinson, et al.2005, p. 334). In relation to inner city students of urban districts, even entities such as the National Assessment of Educational Progress admit that urban districts face such enormous socioeconomic and educational barriers compared to the rest of our nation’s schools (Cavanaugh, 2009). Yet, in a recent article on urban district math assessment, they proclaim that some urban districts have progressed in this area. Hopefully, we will find that the math tutoring program at River High School can assist in contributions to the school’s
progress in math. As a result of these findings, optimism is revealed that hopes for the best outcomes in the math tutoring program that is at the center of this study.
CHAPTER THREE: METHODS AND PROCEDURES
Purpose and Research Questions
The purpose of this study is to assess the effectiveness of a math tutoring program at an urban high school. This is important because the results of this study can be used to interpret the effect that this program may have on students over time. Also, the results of the study can be used as evidence to support the implementation of tutoring programs as a resource for student success in mathematics. In order to evaluate the program, the following research questions have been devised: 1) Does the program impact students’ attitudes toward math over time? 2) Does the program impact students’ attitudes toward math tutoring over time? 3) Does the program impact students’ ability in math over time? The questions were created in order to assess student attitudes and performance asparticipants or former participants in the program.
Researcher Role and Participation
As one who had already been “integrated” into the school’s enviornment as a graduate assistant serving students and as a tutor for the program, I was familiar with the students
involved in this study. Therefore, as I gathered data, I was already aware of what some students were capable of concerning performance ability. However, my role as a graduate assistant and tutor did not interfere with my role as a researcher in the study and the interpretation of results were not be affected by any subjectivity. Still, due to my familiarity with the students, there were certain personal expectations of achievement that I would have liked to see present in the results. Keeping this in mind, my goal in this research project was to remain as objective as possible in the review, analysis, and reporting of the data. Additionally, concerning the students’ consent in participation, they were made fully aware of the purpose of this study, as it had been communicated to them verbally.
The researcher’s participation in the study was quite extensive. As an adult tutor in the program, she assisted with tutor training and had been tutoring up to six students in the program since the beginning of the 2009-2010 school year, up until research began, and continued to tutor until the end of the school year. She played an active role in gathering and organizing data for the math tutoring program as a graduate assistant for GEAR UP. Therefore, students were aware of the data-gathering process and were familiar with her as a presence at math tutoring.
Participation observation notes were not collected, as the quantitative data was sufficient for the purposes the study.
Research Design and Methodology
This study is structured upon an experimental design, which is defined as “procedures in quantitative research in which the investigator determines whether an activity or materials make a difference in results for participants” (Creswell, 2005, p. 51). The quantitative research is represented by the numerical data that is being collected from the scores on pre- and post-assessments as well as on Likert-scale pre- and post-math attitude surveys. According to Creswell, an experimental design is used when the investigator wants to detect a potential cause and effect between independent and dependent variables. In this case, the independent variable represents the math tutoring program, while the dependent variables are the participants’ attitudes toward math and math tutoring based on the surveys, and their math performance abilities based on the pre- and post-assessments. In a typical experimental design, the
investigator would “attempt to control all variables that influence the outcome, except for the independent variable,” so that if the independent variable does influence the dependent variable, then it could be said that the independent variable “caused” the change in the dependent variable. However, this study is not a standard experimental design with random assignment of
participants to groups. As the investigator, the researcher was not able to control all outside influences on the subjects of this study—especially concerning students’ outside factors that may contribute to their participation in the math tutoring program. Therefore, if students decided to discontinue their participation in math tutoring, she could not control that decision.
In reference to the specific type of quantitative research design that is being used, this study is classified as a quasi-experimental design. A quasi-experimental design includes a pre-test as well as a post-pre-test, where the participants are those who are part of an already intact group (Creswell, 2005). In the case of the math tutoring program, the quantiative participants are those who have already chosen to attend the after school math tutoring sessions—the students were not specifically chosen by me. For this specific experimential design, there is only one group of students who serve as the “quantitative group.” Therefore, these students serve as the
experimental group, and in keeping with the design, are administered a pre-test, then exposed to experimental treatment activities (math tutoring sessions), and are then given a post-test. In general, this simple design serves as a basic structure to logically analyze the impact the math tutoring program has on its participants.
Instrumentation and Procedures Surveys and Assessments
Quantitative analysis occured using descriptive analysis of the results from the distributed math attitude surveys, pre- and post-assessment overall scores, and individual item analysis from all three instruments. The original survey was accessed online through another campus’ GEAR UP-associated website (Loyola University GEAR UP, 2008). Using this survey as a base, it was altered so that the positively-worded statements addressed both math in general and the math tutoring program (See Appendix A) The survey distributed to students was a 20-question,
positively worded instrument, which contained 10 questions relating to math and 10 questions concerning math tutoring. The students were to answer the statements using the Likert-scale options “Strongly Disagree,” “Disagree,” “Agree,” “Strongly Agree,” or “No Opinion.” Additionally, the pre- and post- assessments, which are the same instrument, were created through accessing the Ohio Department of Education’s official website. The 21-question math assessments were then compiled based on the Ohio Graduation Test’s math questions that were related to the math tutoring students’ current Algebra 1 class. The math questions were based on the Ohio Academic math Content Standard “Patterns and Functions” (Ohio Department of Education, 2009). Refer to Appendix B.
Sampling Method & Sample Participants
The participants of this study included students who were part of a convenient sample. This indicates that all students who had been regular math tutoring attendees were asked to come to an afterschool math tutoring session on a specified day, and those who were in attendance were distributed a math attitude survey and an Algebra or Geometry pre-assessment to complete, depending on the class in which they were enrolled at that time. The population of students was comprised of 16 Caucasian students, 14 African-American students, 1 Hispanic student, and 3 multi-racial students. Included in this group were 15 male students and 19 female students. Moreover, 29 of the students were ninth graders and five were 10th graders.
Data Analysis
In order to appropriately analyze the quantitative data collected from this study, a computer software program called SPSS, which stands for Statistical Package for the Social Sciences (SPSS, 2010) was used. This particular software program has been applied to process
the data in a logical, easy-to-read fashion. The data was broken down into sections that described the answers to questions in depth according to the percentage of students who chose each option for each question. The frequency for each question was also shown by SPSS. In addition to SPSS, Microsoft Excel was used to process the data for the project as well. In Excel, several statistical tests were run to analyze the data.
In the analysis of the data, discussion concerning what statements on the survey received overwhelming responses on either end of the Likert-scale took place. The problems on the math assessment which proved the most difficult for students have been analyzed, as well as those which received majority correct responses. Also, the pre- and post- survey and assessment results were compared in order to analyze any significant change in performance. Furthermore, a Dependent T-test was used to compare the overall scores of the pre-assessment versus the overall scores of the post-assessment for each participant.
The type of analysis that took place for each research question was different (See Figure 2). Research Questions One and Two “Does the program impact students’ attitudes toward math over time?” and “Does the program impact students’ attitudes toward math tutoring over
time?”were analyzed through descriptive analysis. Finally, Research Question Three “Does the program impact students’ ability in math over time?” was evaluated using descriptive analysis, as well as a dependent T-test for paired samples. I believe that using descriptive analysis for each research question was appropriate because they involved statistics. Statistics need to be
explained in a way that is understandable to any audience, even those who have no background in statistical analysis. Descriptive statistics “indicate general tendencies in the data…, the spread of scores…, or a comparison of how one score relates to all others…” (Creswell, 2005, p. 181). If these general vitals are shared with the audience, then a more logical understanding can be
attained by the reader. In reference to Research Question Three’s analysis through a dependent t-test for paired samples, this type of test was run through Microsoft Excel. As reported by experiment-resources.com (2010), the “dependent T-test for paired samples is used when the samples are paired. This implies that each individual observation of one sample has a unique corresponding member in the other sample.” In the case of the study of the math tutoring program at River High School, a certain number of students had a sample (score) from the pre-assessment and a sample from the post-pre-assessment. This is true for the pre- and post-surveys as well. Additionally, the dependent T-test for paired samples has a few assumptions associated with it. According to the experiment-resources.com website, “the sample of differences…should be normal—an assumption that can be tested…dependent and…[able] to identify specific
pairs…[and] two samples should be of equal size.” The pre- and post-samples represented in this study do reflect normal differences, and are completely independent of one another, as they occurred at separate times. In general, there has been consistent evidence that explains the appropriateness of the chosen types of data analysis for this study.
Figure 2. Research Questions vs. Analyses
Research Question Analysis
Research Question 1:
Does the program impact students’ Descriptive attitude toward math over time?
Research Question 2:
Does the program impact students’ Descriptive attitude toward math tutoring over time?
Research Question 3:
Does the program impact students’ Descriptive and Paired ability in math over time? Sample T-test
Limitations
The time lapse that occurred between the pre-assessment and post-assessment consisted of approximately 16 weeks of tutoring. The pre-tests and surveys were distributed during the first quarter of the school year, and the post-test took place during the third quarter. The
mentioned duration represents a total of approximately four months. During those four months, tutees, typically 9th or 10th graders, were paired to 11th and 12th grade tutors who used the hour time-slot after school to help their students with homework. Many students’ attendance rates dropped between the first quarter of the school year, and the third quarter. Attendance rates especially dropped at the start of the third quarter, which was right after the students’ winter break. Winter break allotted students time away from school that lasted about two weeks. As a result of this drop in attendance, many original students from the pre-assessment lost motivation to remain involved in math tutoring, and as a result, no longer remained participants in the study.
Although many students chose not to complete both assessments, descriptive results for the pre-assessment were still analyzed for all 34 original students. Preliminary analyses
indicated there was not a statistically significant difference in pre-assessment scores between those who chose to complete both the pre- and post-assessments (M=10.27; SD=4.57) or only complete the pre-assessment (M=8.95; SD=4.14); t (32) =.881, p=.385, two-tailed.
The focus of this study has been put on participating students’ attitudes towards math, their performances on specific assessments. It is understood that not all students answered questions to the best of their ability, which resulted in possible inaccuracies in the interpretation of collected data. In addition, data collected for this project represents only a small population of students at the school and does not represent all students’ beliefs and math abilities. Moreover, official student grades will not be collected and interviews of the participating students’ teachers will not be conducted. With this in mind, this study is not meant to evaluate students’ grades in math and progress in their specific math class. This study is only meant to track students’ attitudes and beliefs toward math, as well as their performance in math over time.
CHAPTER FOUR: RESULTS
Purpose of Research Questions
The analysis of the effectiveness of River High School’s math tutoring program has led to answers of the following research questions: 1) Does the program impact students’ attitudes toward math over time? 2) Does the program impact students’ attitudes toward math tutoring over time? 3) Does the program impact students’ ability in math over time? These questions have been designed in order to gauge the impact of the math tutoring program.
Summary of Literature
Key literature points out past and recent trends of student attitudes toward math. This research supports that students do not “associate math activities with enjoyment” (Mitchell, 1999, p. 1). More research has found that peer tutoring programs have “had a positive impact on a variety of math proficiencies, including arithmetic computation, conceptual understanding, and problem solving skills. Moreover, this finding held true for inner city and minority students as well as for others” (Robinson et al.,2005, p. 334). In reference to inner city and minority students, these students are usually represented heavily in the “economically disadvantaged” group of students, which makes up 63% of the population at River High School (Ohio Department of Education, 2010). In addition to the acknowledged research, there are more studies which communicate that students working with other students increases learning and achievement (Schacter, 2000). These primary findings have helped build the foundation of this study, especially through supplementing the research questions.
Survey and Assessment Results Pre-Survey Results
Concerning Research Question One, “Does the program impact students’ attitudes toward math over time?,”the following results were found for the pre-survey. At least 70% (n=19) of students at least agreed with the statements “Mathematics is a necessary subject for my future success,” “I get a great deal of satisfaction out of correctly solving a math problem,” “Math teaches me to think more logically,” “Mathematics is important to everyday life,” and “I am comfortable answering questions in math class.”
There were also statements that resulted in a 50/50 “split” among responses. In response to the statement “I have a lot of self confidence when it comes to mathematics,” students yielded a 44% (n=12) response of at least “Agree” and a 48% (n=13) response of a combined “Disagree” and “Strongly Disagree.” Additionally, the statement “I have usually enjoyed studying math in school” resulted in about 41% (n=11) of at least “Agree” responses and about 56% (n=15) of “Disagree” responses. The statement “I believe I am good at solving math problems” also showed a divided response of about 48% (n=13) “Agree” and 44% (n=12) “Disagree.”
Concerning the “scattered” responses, defined as those where no one option was chosen as the majority, the item that stated “I really like math” resulted in an array of various answers. About 44% (n=12) answered at least “Agree,” 33% (n=9) answered a combined “Disagree” and “Strongly Disagree,” and about 22% (n=6) responded with “No Opinion.” The item “I believe studying math helps me with problem solving in other areas of my life” yielded somewhat similar results with about 67% (n=18) of students answering with “Agree,” about 19% (n=5) answering with “Disagree,” and about 15% (n=4) responding with “No Opinion.” See Appendix C for more detail.
The results for Research Question Two, “Does the program impact students’ attitudes toward math tutoring over time?” showed that at least 70% (n=19) of students agree that they enjoy going to math tutoring, believe that going to math tutoring is beneficial for them, agree that math tutoring helps them realize that math is important to everyday life, believe that going to math tutoring will help them understand more advanced math, and agree that going to math tutoring increases their self-confidence in math. At least 70% (n=19) of students who completed the survey also think that getting help at math tutoring helps them to focus better in their regular math class, acknowledge that math tutoring helps them to see how math can be used in other areas, consent that getting help at math tutoring helps them feel more secure when answering questions in math class, and agree that math tutoring helps develop their math problem-solving skills. The statement “Math tutoring helps me to enjoy studying math in school” yielded answers where the “Agree” response was the majority at 63% (n=17), while the “Disagree” option was chosen among approximately 30% (n=8) of the students. All in all, based on the results to the items on the given survey, students’ attitudes toward math tutoring produced higher, more positive results compared to students’ attitudes toward math, although both types of attitudes were generally positive. View Appendix D for reference.
Post- Survey Results
A post-survey was administered approximately four months after the initial pre-survey was given to students. In reference to the first research question, “Does the program impact students’ attitudes toward math over time?,”the post-survey showed that students responded with an answer of at least “Strongly Agree” or “Agree” to nine out of the ten math-related statements on the post-survey. At least 72.8% (8 out of 11) of students believed that math is a necessary subject for their future success, get a great deal of satisfaction out of correctly solving a math problem, agree that math teaches them to think more logically, consent that math is important to everyday life, and have a lot of self-confidence when it comes to mathematics. Moreover, at least 72.8% of students (8 out of 11) responded optimistically to the following math-tutoring-related survey sentences: “I have usually enjoyed studying math in school”, “I believe studying math helps me with problem-solving in other areas of my life”, “I am comfortable answering questions in math class”, and “I believe I am good at solving math problems”. There was one single statement that resulted in a scattered response. The statement “I really like math” showed that 18.2% (n=2) chose “Strongly Disagree”, 27.3% (n=3) responded with “Disagree”, 27.3% (n=3) yielded an answer of “Agree”, and 27.3% (n=3) answered
“Strongly Agree.” Refer to Appendix E for more details.
In reference to the second research question, “Does the program impact students’
attitudes toward math tutoring over time?”,the post-survey revealed that students responded with an answer of at “Strongly Agree” or “Agree” to nine out of the ten math-tutoring-related
statements on the post-survey. At least 72.8% (n=8) of students concurred that they enjoy going to math tutoring, believe that going to math tutoring is beneficial for them, think that math tutoring helps them realize that math is important to everyday life, agree that going to math
tutoring will help them understand more advanced math, and believe that going to math tutoring increases their self-confidence in math. Additionally, at least 72.8% of students (n=8) responded positively to these math-related survey statements as well: “Getting help at math tutoring helps me to focus better in my regular math class”, “Math tutoring helps me to see where math can be used in other areas”, “Getting help at math tutoring helps me to feel more secure when answering questions in math class”, and “Math tutoring helps me develop my math problem-solving skills”. There was only one statement that showed a “split” among responses. In response to the
sentence “Math tutoring helps me to enjoy studying math in school”, 9.1% (n=1) chose
“Strongly Disagree”, 36.4% (n=4) responded with “Agree”, 27.3% (n=3) yielded an answer of “Strongly Agree”, and 27.3% (n=3) answered “No opinion.” Please see Appendix F for more information.
Pre- and Post-Survey Differences
There were a few substantial differences from the pre-survey to the post-survey. Originally, 27 students participated in the pre-survey. However, only 11 students returned for the completion of the post-survey. The identical pre- and post-surveys had 10 math-related questions as well as 10 math-tutoring-related questions. The two question categories were formed as a result of two of the research questions that have been formulated for this study. Additionally, both question categories showed significant improvements from the post-survey data. All questions resulted in at least 72.8% (n=8) of the students choosing “Agree” or
“Strongly Agree” except for the statements “I really like math” (question 8) and “Math tutoring helps me to enjoy studying math in school” (question 13). Overall, the major changes that occurred between the pre- and post-surveys were the increases in the positive attitudes of students toward math as well as in their attitude toward math tutoring. More students selected
the more positive Likert-scale responses in the post-survey, compared to what was chosen in the pre-survey. See Appendix G for pre- versus post-survey response comparisons and see Appendix A for survey content.
Pre-assessment Results.
Upon the evaluation of the results from the twenty-one-question, all-Algebra pre-test that was administered to 34 math tutoring tutees, each test item was put into a percentage category as well as a mathematical concept category. The percentage categories were as follows: more than 50% of the students answered the item correctly, between 40% and 50% of the students
answered the item correctly, or less than 40% of the students answered the item correctly. The mathematical concept categories were translated from the mathematics Academic Content Standards of Ohio. The math concept categories included Category 1: “solving equations, expressions, or inequalities with variables” (five items total), Category 2: “creating equations from charted functions” (two problems total), Category 3: “interpreting graphed functions” (five items total), as well as Category 4: “translating story problems into equations” (four questions total). More mathematical concept categories included Category 5: “determining patterns to calculate unknown values” (two questions total), Category 6: “understanding number arrays” (one item total), and Category 7: “interpreting equations with variables” (two problems total). See Figure 3 for the percentage of students who chose the correct answer per item for the pre-assessment.
Figure 3. Percentage of Students who Chose the Correct Answer per Pre-assessment Item.
For the “less than 40%” category, nine out of twenty-one questions were put into this group. The items included numbers 1, 2, 12, 16, 17, 18, 19, 20, and 21 (Please see Appendix B). Out of the nine questions in this group, three of the items involved “solving equations,
expressions, or inequalities”, two of the problems entailed “interpreting graphed functions”, another two asked students to “translate story problems into equations”, while the remaining two items in this category required students to “interpret equations with variables.” The lowest scoring item out of this group, and out of the entire selection of questions on the assessment was item number 17 with 17.6% (n=6) of students answering it correctly. This item asked students to interpret a graphed function of a character’s salary versus her sales, based on information from a story problem.
In reference to the “between 40% and 50%” group of questions, this category represented items on the pre-assessment where between 40% and 50% of students answered them correctly.
The questions included numbers 3, 7, 8, 11, 14, and 15 (See Appendix B). Two of the items involved “solving equations, expressions, or inequalities.” For two more problems in the category, students were required to “translate story problems into equations,” and the last two items dealt with students “determining patterns to calculate unknown values.”
Concerning the “more than 50%” section of questions, the items represented reflected those of which more than 50% of students answered correctly. The items in this category consisted of numbers 4, 5, 6, 9, 10, and 13 (see Appendix B). Two of the questions required students to “create equations for charted functions” and two more problems asked students to “interpret graphed functions.” One item involved “solving equations, expressions, or
inequalities,” and the last mentioned item tested students’ ability to “interpret number arrays.” The highest scoring item out of this group, and out of the entire selection of questions on the assessment, was item number 10 with 79.4% (n=27) of students answering it correctly. This item required students to interpret a graphed function of distance versus time. According to the items represented in the highest category (“more than 50%”), students were already familiar with a few key mathematical concepts. The concepts included knowing how to create equations based on given input and output values of a function (item numbers 4 and 6), interpreting graphs of functions that represented constant rates and linear functions (item numbers 10 and 5), and knowing how to read number arrays (item number 13). Refer to Appendix B to see the exact assessment the students completed. Also, see Figure 4 for the overall number of pre-assessment items per percentage category.
Figure 4. Overall Number of Pre-assessment Items per Percentage Category.
This set of data produced an interesting trend concerning the overall results of the pre-assessment. Each item was designated to a percentage category and was analyzed according to the percentage of students who chose each particular option. This analysis revealed several ideas behind the data. Besides the twelve questions (items 3, 4, 5, 6, 7, 8, 9, 10, 11, 13, 14, and 15) that reflected assurance among many of the students concerning what they knew (more than 40% of students chose the appropriate answer), the remaining questions demonstrated a sense of confusion among students. For six out of the nine questions (items 1, 12, 17, 18, 19, and 20) that yielded a correct response from less than 40% of the students, the results for the answers were “scattered.” A scattered item represents a question where no one option (A, B, C, D) earned the majority’s response. For example, 30% of students could have chose “A,” 30% could have chose “B,” 25% could have selected “C,” and 15% could have picked “D.” This indicated that students were either confused about the questions, or did not know the answers at all and simply
guessed. Whichever is true, these items showed that students did not know the content
associated with those questions. The associated content included solving equations, inequalities, and expressions with variables as described in story problems, interpreting equations with variables based on word problems, and understanding graphed functions as explained through story problems (See Appendix H for results of a “scattered item”).
In relation to the three remaining questions that have not been addressed, these items proved to be troublesome for students, considering the statistical findings that were produced. The questions of focus, which fall under the “problematic item” category, signify those of which the results showed more students chose an item similar to the correct answer rather than the actual answer. These “problematic items” included questions number 2, 16, and 21. The answers for these questions showed a definite misconception among students, which can be explained in a number of different ways. These potential explanations are discussed in chapter five.
Post-assessment Results
The post-assessment was given to student four months after the pre-assessment was administered. There are a few significant details to keep in mind concerning the post-assessment in relation to the pre-assessment. Only 15 of the original students participated in the
post-assessment, compared to the 34 who took part in the pre-assessment as part of the convenient sample. As with the pre-assessment results, the post-assessment results have been divided into percentage categories. The post-test categories are the same as the pre-test categories—“less than 40%”, “between 40% and 50%”, and “more than 50%,” all referring to the percentage of students who answered each question correctly.
In accordance with the pre-test analysis techniques, the post-assessment questions have been labeled based on what mathematical content each item addresses. Identical to the ones from the pre-assessment, the math concept categories consist of “solving equations, expressions, or inequalities with variables” (five items total), “creating equations from charted functions” (two problems total), “interpreting graphed functions” (five items total), and “translating story problems into equations” (four questions total). More labels include “determining patterns to calculate unknown values” (two questions total), “understanding number arrays” (one item total), and “interpreting equations with variables” (two problems total). View Figure 5 for
post-assessment correct answer percentages and for the overall number of post-post-assessment items per percentage category.
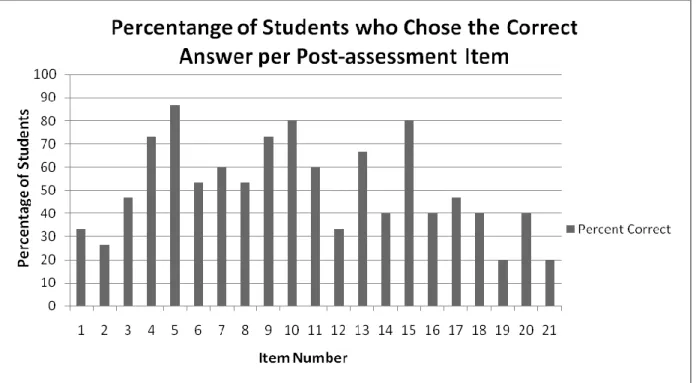
Figure 5. Percentage of Students who Chose the Correct Answer per Post-assessment Item.
For the “less than 40%” category, only five out of twenty-one questions were put into this group. The items include numbers 1, 2, 12, 19, and 21 (see Appendix B). Out of the five
inequalities”, two of the problems entailed “interpreting graphed functions”, and one involved “interpreting equations with variables.” The lowest scoring items out of this group, and out of the entire selection of questions on the post-assessment were item numbers 19 and 21 with 20% (n=3 each) of students answering it correctly. Item number 19 asked students to interpret a graphed function of a character with a money scenario, based on information from a story problem, while item 21 required students to analyze a number of equations and choose which one best represented what was described in the story problem.
In reference to the “between 40% and 50%” group of questions, this category represents items on the post-assessment in which between 40% and 50% of students answered them correctly. The questions include numbers 3, 14, 16, 17, 18, and 20 (Appendix B). Two of these items involve “interpreting graphed functions”, for three problems in this category, students were required to “translate story problems into equations,” as the last item dealt with students
“interpreting equations with variables.”
Concerning the “more than 50%” section of questions, the items represented reflect those of which more than 50% of students answered correctly on the post-assessment. The items in this category consist of numbers 4, 5, 6, 7, 8, 9, 10, 11, 13, and 15 (view Appendix B). Two of these questions required students to “create equations for charted functions” and two more problems asked students to “interpret graphed functions.” Two items involved “solving
equations, expressions, or inequalities”, two more items asked students to “determine patterns to calculate unknown values”, while one item dealt with “translating story problems into equations” and the last mentioned item tested students’ ability to “interpret number arrays.” The highest scoring item out of this group, and out of the entire selection of questions on the assessment was item number five with 86.7% (n=13) of students answering it correctly. This item required
students to interpret a graph that represented a linear function. See Figure 6 for the number of post-assessment items per percentage category.
Figure 6. Overall Number of Post-assessment Items per Percentage Category.
According to the items represented in the highest category (“more than 50%”), students’ understanding of concepts have been enhanced concerning how to make sense of many Algebra-related concepts. In addition to what students already knew as displayed by the pre-assessment results, on the post-assessment, students exhibited their newly developed knowledge of
discovering equations through story problems (question number seven), understanding variables in expressions, and determining patterns to calculate unknown values in functions. See
Appendix B to view mentioned questions.
This set of data has yielded fascinating results relating to the general outcome of the post-assessment. For a second time, designating each item to a percentage category and analyzing each item according to the percentage of students who chose each particular option, revealed several strong meanings behind the post-data. The students still showed signs of struggling with
seven out of the twenty-one questions on this assessment. Their responses for the post-assessment were not as scattered as the pre-post-assessment; however, the participants display a significant difficulty with the concept of variables. Out of the seven “problematic items” on the post-assessment, four of them involve variables. Two out of the remaining three questions are concerned with translating story problems, and the remaining item relates to interpreting a graphed function. In general, there was a significant change from the pre-data to the post-data— one that may serve as an indication of promising impact.
Pre- and Post-assessment Differences
Many changes occurred between the pre-assessment and post-assessment results. Most noticeable is a shift that took place between the arrangement of items in each percentage
category. Both assessments were evaluated through the analysis of three percentage categories: “less than 40%”, “between 40% and 50%”, and “more than 50%,” with each category referring to the percentage of students that answered each question correctly. The pre-assessment outcome originally consisted of nine items in the “less than 40%” category. However, the post-assessment resulted in only five items in that category, which is a noteworthy shift. In the “between 40% and 50%” group, the pre-test contained six items. Invariable results came about from the post-test, as the students’ responses yielded six items in the category once again. Finally, serving as the highest grouping out of the three percentage groups, the “more than 50%” category generated six items for the pre-test, however, the post-test revealed a more
knowledgeable sector of students by exhibiting a remarkable shift from six items to 10 items. Concerning changes that occurred in each mathematical concept category, the results for each category showed a correct percentage increase in at least one question. The outcomes of each category are as follows: “solving equations, expressions, or inequalities with variables” an
increase 3 out of 5 questions, “creating equations from charted functions” an increase in 1 out of 2 items, “interpreting graphed functions” and increase of 3 out of 5 problems, and “translating story problems into equations” showed an increase in 3 out of 4 problems. Additionally, the other categories showed promise as well: “determining patterns to calculate unknown values” showed a percentage increase in 2 out of 2 items, “understanding number arrays” an increase in 1 out of 1 problem, and “interpreting equations with variables” displayed a percentage increase in 1 out of 2 problems. Overall, concerning improvement with percentages, students performed better on 14 out of 21, which is about 67% of the problems on the post-assessment.
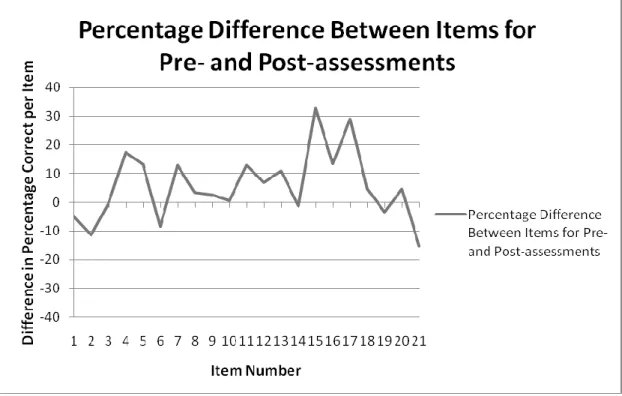
There were two items on the assessment that showed noticeably significant improvement. The most significant percentage increase was seen in item number 15, which received a correct response from 47.1% (n=16) of students in the pre-assessment, but yielded a correct answer from a remarkable 80% (n=12) of students in the post-test, a 32.9% increase. The mathematical concept associated with this question was “determining patterns to calculate unknown values.” Another significant change occurred for the results of item number 17 between the pre- and post-test. This item was originally answered correctly by only 17.6% (n=6) of students. However, in the post-test 46.7% (n=7) of students knew the correct answer, which reveals a 29.1%
improvement. Number 17 dealt with understanding how to read graphed functions in relation to story problems. Each of these questions transcended to the next percentage category. Item number 15 placed in the “more than 50%” category for the post-assessment, compared to the “between 40% and 50%” category in the pre-assessment, while question number 17 was put in the “between 40% and 50%” category, as opposed to the “less than 40%” category from the pre-assessment. Please view Figure 7 for reference.
Figure 7. Pre- vs. Post-test Percentages of Students who Chose the Correct Answer Per Item.
In addition to descriptive analysis, a paired-sample dependent T-test was run in order to statistically compare the data from the pre-assessment and post-assessment. The T-test indicated that there was not a statistically significant improvement in performance ability between the pre- and post-assessment for the group of 15 math tutoring students who took both tests. The
obtained p-value for the non-directional dependent T-test was 0.584201773, which is more than the .05 alpha level. Therefore, there is not a statistically significant improvement in performance ability in students from the pre-test to the post-test. There was not a statistically significant improvement in performance ability as from the time students took the pre-test, (M=10.26,
SD=4.57) to the time they took the post-test (M=10.73, SD=4.68); t(14)=-0.56, p=0.58, two-tailed. On average, results increased from correctly answering 49% of the assessment items on the pre-test, to correctly answering 51% of the items on the post-test. The results of this study
allow for some interesting conclusions in reference to what the future holds for math tutoring programs in urban high schools.
CHAPTER FIVE: CONCLUSIONS
Summary of Purpose
Identified in chapter one as a core subject, math is regarded as the “bedrock of our modern world” and it is of crucial importance that students are successfully taught to understand the concepts that lie within math, as the skills involved are an integral part of our society
(Roman, 2004). Knowledge of mathematical concepts is one of the all-important skills needed in order to function in most parts of society. Many may not realize that math is the tool that we use to make sense of our world in numbers. Not only are math skills needed for simple functions such as calculating purchase totals and being able to read graphs to understand trends and patterns, but math is also an integral part of science as well. Many of the sciences (i.e. physical sciences, chemistry, astronomy) require proficiency in math, and the background knowledge associated with the sciences can be used for everyday problem-solving. While many students tend to rule out a career in the math or science fields, they may be more inclined to pursue them if they had a strong foundation in basic mathematics.
Another focus of the study was the idea of peer tutoring serving as a positive resource for students, especially inner city students from economically disadvantaged backgrounds
(Robinson, et al., 2005). Previous research supports that tutoring programs similar to the one installed at River High School have resulted in more positive student attitudes in classrooms with tutoring programs, and more favorable self-concepts for students in classrooms with tutoring programs (Cohen et al., 1982). Overall, tutoring has earned an agreeable record, one of which this study provides further evidence.