The Effect of Changes in Tick Price and Lot Size on Stock Liquidity: Evidence
from Indonesia Stock Market
Abstract
New regulation in the tick price and lot size was implemented in Indonesia Stock Exchange on 6 January 2014. This research aims to examine the effects of the changes toward stock liquidity. Comparison of stock liquidity measurement variables before and after the event is conducted with 15 days window period. 370 stocks fulfilled the criterion and used as sample in this paper. This study employs paired sample t-test for normally distributed data and Wilcoxon test for not normally distributed data to assess mean significant differences before and after the event. Result shows that to some extent, the event enhanced stock liquidity. Keywords: changes in tick price and lot size, stock liquidity, Indonesia Stock Market
I. INTRODUCTION
On 6 January 2014, government implement new regulation regarding tick price and lot size as written in “Surat Keputusan Direksi PT. Bursa Efek Indonesia Kep-00071/BEI/11-2013”. Tick price is the minimum threshold in bargaining stock price which is established by the Stock Exchange. It is the minimum change in stock price either an increase or a decrease. Tick price that is applicable to all the stocks in all price range is called single fraction. On the other hand, tick price that is applicable differently to stocks based on its price range is called multi fraction. Meanwhile, lot size is the minimum volume of shares traded in the stock exchange or the volume within one lot.
Table 1 below shows the difference in tick price and lot size between new regulation after 6 January 2014 and old regulation before 6 January 2014. In the new regulation, 1 lot size equal 100 shares compared to 500 shares in the old regulation. Hence, with the new regulation, traders can purchase only 100 shares while the old regulation required traders to purchase at least 500 shares. Not just lot size, tick price also changed in the new regulation. Within the category of Rp 200 until less than Rp 500, the new regulation stated that the tick price becomes Rp 1 instead of Rp 5. In addition, within the category of Rp 500 until less than Rp 5000, the new regulation set the tick price is Rp 5. As for the category of equal or more than Rp 5000, the new regulation arranged that the tick price is Rp 25.
Table 1 Changes in Tick Price and Lot Size
Source: PT. Bursa Efek Indonesia, 2014
According to Ito Warsono, president director of PT. Bursa Efek Indonesia, government decided to impose the changes in tick price and lot size in order to increase
Lot Size 500 Lot Size 100
Price Range Tick Price Price Range Tick Price
< Rp 200 Rp 1 Rp 200 - < Rp 500 Rp 5 Rp 500 - < Rp 2.000 Rp 10 Rp 2000 - < Rp 5000 Rp 25 ≥ Rp 5000 Rp 50 ≥ Rp 5000 Rp 25 Rp 5 Old Regulation Old Regulation New Regulation New Regulation < Rp 500 Rp 500 - < Rp 5000 Rp 1
stock liquidity which will eventually boost local investment. With lower lot size, Samsul Hidayat, director monitoring compliance of BEI members, revealed that government expects the stock price to be more affordable for the investors hence leads to higher purchasing power of public investors and eventually to higher liquidity. As for the tick price, the changes expected to diminish the spread between bid and ask (Perubahan Lot Size dan Tick Price BEI: Seluruh AB Sudah Siap, 2014). In addition, Argha J Karo Karo, analyst of Creative Trading System, said that retail investors are having difficulties in purchasing and managing diverse portfolio due to its expensive price for a single lot (BEI Menyatakan Siap Terapkan Fraksi Baru, 2014). By lowering lot size, it is expected that retail investors can purchase their portfolio of stocks and finally increase stock liquidity.
There are several studies that have been conducted around the world, regarding the changes in tick price. Lau and McInish (1995) analyzed the event on 18 July 1994, when Stock Exchange of Singapore decreased the tick price from 50 cent to 10 cent for stocks traded at SGD 25 or more.They found out that bid-ask spread hence transaction costs were decreased significantly (Lau & McInish, 1995). Porter and Weaver (1997) conducted a research to examine the impact of reduction in tick price on market quality in Toronto Stock Exchange. They report lower execution costs and a decrease in quoted market depth (Porter & Weaver, 1997).
Ronen and Weaver (1998) analyzed the case happened on 1997, when AMEX (American Stock Exchange) reduced the tick price from $1/8 to $1/16 for all stocks. They found out that bid-ask spread and depth were significantly decreased while trading volume was insignificantly increased due to the changes (Ronen & Weaver, 1998). For similar event, Goldstein and Kavajecz (2000) also documented significant decrease in bid-ask spread and depth in New York Stock Exchange (NYSE).
Aitken and Comerton-Forde (2005) investigate the impact of reduction in tick size on stock liquidity which occured in Australian Stock Exchange on 4 December 1995. They found out that low priced stocks, overall, experience improvement in liquidity particularly for high volume stocks which exhibit the utmost increase but stocks priced higher than AUD 10 particularly in the group of low volume stocks displays overall deterioration in liquidity (Aitken & Commerton-Forde, 2005).
Although there are several studies has been conducted regarding with changes in tick size, this paper gives contributions in several aspects. First, this paper examine the
effect of slightly different event in dissimilar context. The event in the previous studies is only changes in tick size while new regulation in Indonesia Stock Exchange per 6 January 2014 is changes on both tick size and lot size. The context also different since it happen in different market. Second, previous studies also give various results particularly in term of effect of the changes on depth and trading volume. Results of this paper can be used to enrich the existing studies and literatures. Lastly, several studies that had been carried out are limited in term of number of sample such as Lau and McInish (1995) which only cover three stocks and limited window period such as 5 days before and 5 days after the changes took place as in Lau and McInish (1995). This paper expands the works by scrutinizing larger number of sample and examining the effect of the changes through longer window period which is 15 days before and 15 days after the event.
Based on the background above, this research particularly aims to evaluate whether the new regulation, changes in tick price and lot size effective per 6 January 2014, have effect on stock liquidity in Indonesia Stock Exchange.
II. STOCK LIQUIDITY MEASURES
Liquidity is the ability to buy and sell stocks without having significant changes in their prices. Fleming (2003) stated that the liquidity of a stock is depending on how high the transaction cost is. If the transaction cost is low it means the stock is liquid, while if transaction cost is high then the stock is illiquid. Furthermore, liquidity can be defined as the ability to execute a transaction directly at that time at the bid and ask price. Thus, a stock is liquid when there is always a buyer whenever a stock is about to be sold with low volatility in the price.
Stock liquidity is important because it reflects how liquid a bourse is. There are many measurements of liquidity according to experts. Based on Fleming (2003), stock liquidity can be measured through the bid-ask spread, depth, and trading volume. Meanwhile, Wyss (2004) measured liquidity through trading time, tightness, depth, and resiliency. This research will employ four measurements of liquidity which are bid-ask spread, depth, trading volume, and trading time.
A. Bid-ask Spread
Bid-ask spread is the difference between ask and bid price. It related measures gives an approximation of the cost incurred when trading as in Wyss (2004). Beside fees and taxes, traders also have to pay the spread as the transaction cost. Instead of buying at the bid price, traders sometimes choose to buy at the ask price to execute immediate transaction. Same goes when traders want to sell, instead of selling at the ask price, traders decide to sell at the bid price to be able to execute immediate transaction. There are three types of spread based on Wyss (2004) which are absolute spread or quoted spread, relative spread, and effective spread. Relative spread itself can be calculated using last trade or mid price as the denominator. Absolute or quoted spread is not being used in this paper because the result would be as obvious as the tick price itself. Relative spread with last trade and effective spread also not chosen because there is no solid reason to determine the base price. Thus, among all types of spreads, this study use relative spread, specifically relative spread with mid-price. Relative spread with mid price is able to compare spread of different stocks because it uses middle price as the denominator of the gap between bid price and ask price. Wyss (2004) stated that relative spread could make stock comparable one to another while Christie and Huang (1994) stated that relative spread is more appropriate measurement in measuring liquidity compare to absolute-dollar spread. Relative spread with mid-price is calculated as follows:
(1)
Relative spread with mid-price ( calculates the difference between the lowest ask and the highest bid divided by , where
.
B. Depth
Fleming (2003) stated that depth (quote size) is an estimation of the quantity of securities tradable at the bid and offer price. Just like bid-ask spread, depth is also commonly used as one of the measurements of liquidity. Depth is the total number of demand and supply of stocks in bid and ask price respectively as in Wyss (2004). For depth, basic depth is employed in this research. Lau & McInish (1995), in analyzing Stock Exchange of Singapore, also used basic depthin their research. Basic depth is calculated below:
denotes the quantity depth on ask price in time t, while signifies the quantity depth on bid price in time t.
C. Trading Volume
Trading volume is the number of trades executed within a specified interval regardless the trade size as in Fleming (2003). High trading volume indicates higher liquidity. Trading volume in this research considers not about the nominal of the transaction but the number of stock involved within trading hours per day as commonly used by previous studies such as Lau and McInish (1995) and Bacidore (1997).
where is the number of trades happened in that specified interval of time, while is the number of shares traded in particular i.
D. Trading Time
Trading time measures the time interval between one transaction to another as in Wyss (2004). The more transaction happen in a certain period of time makes the trading time lower which leads to a higher liquidity (Wyss, 2004). This measure is also known as waiting time in which it can be measured in second, minute, or even hour. Trading time in this study deliberates the average waiting time between each transaction.
where is the waiting time in time t, indicates the time of the trade, while denotes the time of the trade before. N is the frequency of transaction between the time and . Trading time together with trading volume is able to show which stocks have few large trades and which stocks have many small trades.
III. RESEARCH METHOD
As explained in the section 2, bid-ask spread specifically relative spread with mid price, basic depth, trading volume, and trading time are employed as proxies for stock liquidity.
Data
Data are taken from Indonesia Stock Exchange (IDX) official website and KSEI (Kustodian Sentral Efek Indonesia). Details needed for the calculation of stock liquidity such as daily stock listed, closing bid and ask price, closing bid and ask volume, trading volume, and trading frequency were gathered from the official website of Indonesia Stock Exchange while the details regarding corporate actions occurred between the window period were gathered through Kustodian Sentral Efek Indonesia. The window period is determined to be 15 working days before and 15 days after the event took place, excluding holiday, joint holiday, and the event itself.
Sample selection
To get the appropriate samples to answer the research objectives of this study, there are several criterion need to be fulfilled. The first criterion is stocks should be listed in Indonesia Stock Exchange during the whole 15 days window period before and after the event. Stocks that are not listed since the beginning of the window period or removed before the end of the window period will be omitted since it cannot be used in the comparison.
The second criterion is that stocks must not be affected by any kind of corporate actions such as stock split, right issue, distribution of dividend, and merger and acquisition during the window period. Collected the necessary data from KSEI (Kustodian Sentral Efek Indonesia), stocks which have any corporate action in between the window period will be excluded.
The third criterion is that stocks should be traded during the window period. Stocks which has zero mean trading volume and trading time will be excluded since it means that they are not traded even once during the entire window period. In the end, 370 stocks fulfilled the criterion and used as sample for 15 days window period.
Statistical Tests
Means significant differences for each measurement of stock liquidity which are bid-ask spread, depth, trading volume, and trading time before and after the event is tested using Paired sample t-test or Wilcoxon test. Paired sample t-test is used when data is
normally distributed while Wilcoxon test is employed when data is not normally distributed. To analyze the distribution of data, One Sample Kolmogorov-Smirnov test is used.
If data is not normally distributed, natural log transformation will be carried out. Data which are still not normally distributed even after being transformed would be analyzed using its original value with Wilcoxon test, while data which are normally distributed after being transformed would be analyzed using its transformed value with paired sample t-test.
IV. RESULTS AND DISCUSSIONS
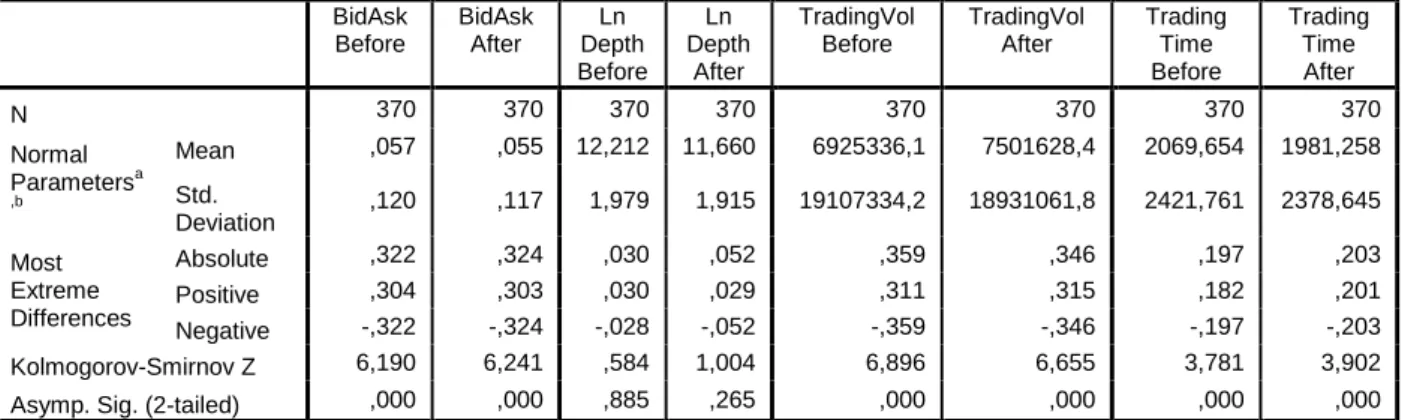
Table 2 below shows brief summary of normality test for all variables within 15 days window period in this study using One-Sample Kolmogorov Smirnov Test. From table 2, it can be seen that data of bid-ask spread, trading volume and trading time before and after the event are not normally distributed hence should be tested using Wilcoxon test. On the contrary, data of depth after ln transformation both before and after the event are normally distributed thereby will be tested using Paired sample t-test.
Table 2 One Sample Kolmogorov Smirnov Test All Variables - 15 days window period One-Sample Kolmogorov-Smirnov Test
BidAsk Before BidAsk After Ln Depth Before Ln Depth After TradingVol Before TradingVol After Trading Time Before Trading Time After N 370 370 370 370 370 370 370 370 Normal Parametersa ,b Mean ,057 ,055 12,212 11,660 6925336,1 7501628,4 2069,654 1981,258 Std. Deviation ,120 ,117 1,979 1,915 19107334,2 18931061,8 2421,761 2378,645 Most Extreme Differences Absolute ,322 ,324 ,030 ,052 ,359 ,346 ,197 ,203 Positive ,304 ,303 ,030 ,029 ,311 ,315 ,182 ,201 Negative -,322 -,324 -,028 -,052 -,359 -,346 -,197 -,203 Kolmogorov-Smirnov Z 6,190 6,241 ,584 1,004 6,896 6,655 3,781 3,902
Asymp. Sig. (2-tailed) ,000 ,000 ,885 ,265 ,000 ,000 ,000 ,000
a. Test distribution is Normal. b. Calculated from data.
After conducting normality test, appropriate statistical test for each stock liquidity measurement variable is carried out. Results of statistical test for stock liquidity measurement variables (bid-ask spread, depth, trading volume and trading time) within 15 days window period are summarized in Table 3.
Table 3 Summary of Statistical Test Results for Liquidity Measures – 15 days Window Period
Variables Before After Differences test statistics p-value
Bid-Ask Spread 0,057 0,055 -0,002 -6,645 0,000
LnDepth 12,2118 11,6604 -0,552 -11,398 0,000
Trading Volume 6925336,13 7501628,41 576292,29 0,935 0,350
Trading Time 2069,654 1981,258 -88,396 -3,783 0,000
From Table 3, it can be seen that there are mean significant differences for bid-ask spread, depth, and trading time before and after the event while mean trading volume is not significantly different before and after the event. In line with the result of previous studies in other stock markets, this research found that there is a significant decrease in bid-ask spread thereby improvement in stock liquidity after reduction in the tick price and lot size took place in Indonesia Stock Exchange. Chung and Chuwonganant (2004) mentioned that reduction in the tick price required traders to compete which resulted in smaller bid-ask spread. In other words, when tick price decrease, the willingness for traders to either buy or sell stocks increase, which results in lower price sellers want to sell and higher price buyers want to buy and in the end, spread gets narrowed. Thus, when tick price decrease, it reduce the minimum spread and improve stock liquidity.
Table 3 shows that there is significant decrease in the depth after the changes in tick price and lot size in Indonesia Stock Exchange. The transformed mean of depth before and after are 12.212 and 11.660 respectively. Using the formula to transform back the data, the mean of depth before is 201,148.757 lots, while the mean of depth after is 115,890.377 lots. It indicates that there is a decrease of 85,258.42 or 42.4% in mean of depth after the event. Depth is decreased because with the lower tick price the more likely the transaction occurs since the traders would tolerate the small gap between bid and ask price. Traders would be more willing to sell at bid price and buy at ask price to execute immediate transaction, rather than queue in the order book. Hence, depth could decrease as the spread are small (Huang, 2000). Furthermore, Niemeyer and Sandas (1994) found out that the changes of tick size in the Stockholm Stock Exchange (SSE) are positively correlated to the market depth. Thus, when the tick size is decrease, depth would also decrease, which supports the results of this study. There are other similar researches done by Bacidore (1997), Porter and Weaver (1997), Ronen and Weaver (1998) which is in overall found out that the depth were significantly decreased following reduction in tick price.
In term of trading volume within 15 days window period, this paper finds that mean trading volume before and after are 6,925,336.126 shares and 7,501,628.414 shares correspondingly. However, an increase in trading volume after the evet is not significant. Ryan and Taffler (2004) suggested that trading volume activity and stock price are significantly generated by internal firm performance such as firm formal accounting releases because traders, investors, and other financial market participants are driven by fundamental information and not by fads or other prior news releases (Ryan & Taffler, 2004).
Finally, as can be seen from table 3, for trading time, this study documented that there is significant difference between mean trading time before and after the changes of tick price and lot size in Indonesia Stock Exchange. The mean trading time before and trading time after are 2,069.654 seconds and 1,981.258 seconds. Result shows that there is a decrease of 88.396 seconds or 4.27% in trading time after the event took place. Furthermore, result shows that decrease in the trading time is significant. The decrease in trading time happened because when tick size was reduced, trading frequency would increase and eventually improved the market liquidity. When trading frequency was boosted, it would diminish the trading time as trading time equals to working hours divided by trading frequency (Chordia, 2012).
V. CONCLUSION
This research paper empirically investigates the effect of changes in tick price and lot size which implemented on January 2014 toward stock liquidity in Indonesia Stock Exchange. This study utilizes bid-ask spread, depth, trading volume and trading time as measurement variables of stock liquidity and found out that bid-ask spread, depth, and trading time have significant mean difference before and after the event, while trading volume has no significant mean difference before and after the event. Based on the analysis, mean bid-ask spread was significantly decreased by 36.78% after the changes. Same goes with depth which was also significantly decreased by 42.4%. On the other hand, mean trading volume was insignificantly increased. Lastly, mean trading time was significantly decreased by 88.396 seconds or 4.27% after the changes.
The result of this study showed that the changes makes mean bid-ask spread and mean trading time significantly better off, mean trading volume insignificantly improved, while depth significantly diminished. Through this study, regulator can evaluate the effectiveness of the new regulation and consider the impact that might occur if same decision needs to be taken in the future.
REFERENCES
Aitken, M. & Comerton-Forde, C. (2005). Do reductions in tick sizes influence liquidity? Accounting and Finance 45(2), 171-184.
Bacidore, J. (1997). The impact of decimalisation on market quality. Journal of Financial Intermediation 6(2), 92-120.
BEI Menyatakan Siap Terapkan Fraksi Baru. (2014, January 6). Retrieved March 3, 2015, from Koran Jakarta: http://www.koran-jakarta.com/?2590-bei%20menyatakan%20siap%20terapkan%20fraksi%20baru
Christie, W. & Huang, R. (1994). Market Structures and Liquidity: A Transactions Data Study of Exchange Listings. Journal of Financial Intermediation 3(3), 300-326.
Chung, K. H. & Chuwonganant, C. (2004). Tick Size, Order Handling Rules, and Trading Costs. Financial Management 33(1), 47-62.
Fleming, M. J. (2003). Measuring Treasury Market Liquidity. FRBNY Economic Policy Review, 83-108.
Goldstein, M. & Kavajecz, K. 2000. Eighths, sixteenths and market depth: changes in tick size and liquidity provision on the NYSE. Journal of Financial Economics 56, 125-149. Huang, R. D. & Stoll, H. R. (2001). Tick Size, Bid-Ask Spreads and Market Structure. The Journal of Financial and Quantitative Analysis 36(4), 503-522.
Lau, S. T. & McInish, T. H. (1995). Reducing Tick Sizes on the Singapore Stock Exchange. Pacific Basin Finance Journal 3, 485-496.
Niemeyer, J. & Sandas, P. (1994). An Empirical Analysis of the Trading Structure at the Stockholm Stock Exchange. Journal of Multinational Finance Management 3(3), 63-101.
Perubahan Lot Size dan Tick Price BEI: Seluruh AB Sudah Siap. (2014, January 6). Retrieved March 3, 2015, from Jurnal Asia: http://www.jurnalasia.com/ 2014/01/06/perubahan-lot-size-dan-trick-price-bei-seluruh-ab-sudah-siap/
Porter, D. C. & Weaver, D. G. (1997). Tick Size and Market Quality. Financial Management 26(4), 5-26.
Ronen, T. & Weaver, D. G. (1998). The Effect of Tick Size on Volatility, Trader Behavior, and Market Quality. 2-22.
Ryan, P. & Taffler, R. J. (2004). Are Economically Significant Stock Returns and Trading Volumes Driven by Firm-specific News Release? Journal of Business Finance & Accounting 31, 49-82.
Wyss, R. V. (2004). Measuring and Predicting Liquidity in the Stock Market. Dissertation.
Retrieved from http://www1.unisg.ch/www/edis.nsf/
15 Days Window Period
BID-ASK SPREAD
Table 4.1 Descriptive Statistics Bid-Ask Spread, Wilcoxon Test Descriptive Statistics
N Mean Std. Deviation Minimum Maximum MeanBidAskSpread_Before 370 .05739 .12024 .00174 .97894 MeanBidAskSpread_After 370 .05528 .11713 .00195 .88986
Table 4.2 Ranks Bid-Ask Spread, Wilcoxon Test Ranks
N Mean Rank Sum of Ranks MeanBidAskSpread_After - MeanBidAskSpread_Before Negative Ranks 269a 178.43 47997.00 Positive Ranks 101b 204.34 20638.00 Ties 0c Total 370 a. MeanBidAskSpread_After < MeanBidAskSpread_Before b. MeanBidAskSpread_After > MeanBidAskSpread_Before c. MeanBidAskSpread_After = MeanBidAskSpread_Before
Table 4.3 Test Statistic Bid-Ask Spread, Wilcoxon Test Test Statisticsa
MeanBidAskSpread_After - MeanBidAskSpread_Before
Z -6.645b
Asymp. Sig. (2-tailed) .000
a. Wilcoxon Signed Ranks Test b. Based on positive ranks.
DEPTH
Table 4.4 Paired Samples Statistics Depth, Paired Sample T Test Paired Samples Statistics
Mean N Std. Deviation Std. Error Mean Pair 1 LnMeanDepth_Before 12.2118 370 1.97890 .10288
LnMeanDepth_After 11.6604 370 1.91520 .09957 Table 4.5 Paired Samples Correlations Depth, Paired Sample T Test Paired Samples Correlations
N Correlation Sig. Pair 1 LnMeanDepth_Before & LnMeanDepth_After 370 .886 .000
Table 4.6 Paired Samples Test Depth, Paired Sample T Test Paired Samples Test
Paired Differences T df Sig. (2-tailed) Mean Std. Dev. Std. Error Mean 95% Confidence Interval of the Difference Lower Upper Pair 1 LnMeanDepth_After - LnMeanDepth_Before -.55145 .93065 .04838 .45631 .64658 -11.398 369 .000 TRADING VOLUME
Table 4.7 Descriptive Statistics Trading Volume, Wilcoxon Test Descriptive Statistics
N Mean Std. Deviation Minimum Maximum MeanTradingVolume_Before 370 6925336.13 19107334.23 66.667 157282800 MeanTradingVolume_After 370 7501628.41 18931061.79 6.667 158545113
Table 4.8 Ranks Trading Volume, Wilcoxon Test Ranks
N Mean Rank Sum of Ranks
MeanTradingVolume_After - MeanTradingVolume_Before Negative Ranks 188 a 172.30 32393.00 Positive Ranks 182 b 199.13 36242.00 Ties 0c Total 370 a. MeanTradingVolume_After < MeanTradingVolume_Before b. MeanTradingVolume_After > MeanTradingVolume_Before c. MeanTradingVolume_After = MeanTradingVolume_Before
Table 4.9 Test Statistic Trading Volume, Wilcoxon Test Test Statisticsa
MeanTradingVolume_After - MeanTradingVolume_Before
Z -.935b
Asymp. Sig. (2-tailed) .350
a. Wilcoxon Signed Ranks Test b. Based on negative ranks.
TRADING TIME
Table 4.10 Descriptive Statistics Trading Time, Wilcoxon Test Descriptive Statistics N Mean Std. Deviation Minimum Maximum MeanTradingTime_Before 370 2069.654 2421.761 1.759 11880 MeanTradingTime_After 370 1981.258 2378.645 3.627 10858
Table 4.11 Ranks Trading Time, Wilcoxon Test Ranks
N Mean Rank Sum of Ranks MeanTradingTime_After - MeanTradingTime_Before Negative Ranks 254a 164.92 41890.00 Positive Ranks 115b 229.35 26375.00 Ties 1c Total 370 a. MeanTradingTime_After < MeanTradingTime_Before b. MeanTradingTime_After > MeanTradingTime_Before c. MeanTradingTime_After = MeanTradingTime_Before
Table 4.12 Test Statistic Trading Time, Wilcoxon Test Test Statisticsa
MeanTradingTime_After - MeanTradingTime_Before
Z -3.783b
Asymp. Sig. (2-tailed) .000
a. Wilcoxon Signed Ranks Test b. Based on positive ranks.