FlexSplit: A Workload-Aware, Adaptive Load Balancing
Strategy for Media Clusters
∗Qi Zhang
1and Ludmila Cherkasova
2and Evgenia Smirni
11
Computer Science Dept., College of William and Mary, Williamsburg, VA 23187, USA
{
qizhang, esmirni
}
@mail.cs.wm.edu
2
Hewlett-Packard Laboratories, 1501 Page Mill Road, Palo Alto, CA 94303, USA
[email protected]
Abstract A number of technology and workload trends motivate us to consider a new request distribution and load balancing strategy for streaming media clusters. First, in emerging media workloads, a significant portion of the content is short and encoded at low bit rates. Additionally, media workloads display a strong temporal and spatial locality. This makes modern servers with gigabytes of main memory well suited to deliver a large fraction of accesses to popular files from memory. Second, a specific characteristic of streaming media workloads is that many clients do not finish playing an entire media file which results from the browsing nature of a large fraction of client accesses. In this paper, we propose and evaluate two new load-balancing strategies for media server clusters. The proposed strategies, FlexSplit and FlexSplitLard aim to efficiently utilize the combined cluster memory by exploiting specific media workload properties by “tuning” their behavior to media file popularity changes. The ability of the proposed policies to self-adapt to changing workloads across time while maintaining high performance makes these strategies an attractive choice for load balancing in media server clusters.
1. INTRODUCTION
Streaming high quality audio and video from a central server configuration to a large number of clients is a challenging and resource intensive task. Transmitting media files requires more bandwidth and storage, and it is more sensitive to network jitter than transmitting Web objects.
With large spread of media demands in current Internet, media server clusters are used for scalable and highly available solutions. While network bandwidth usage by media applications can be considered as a primary component in service billing, the cost to manage and operate traditional resources like CPU, memory, and storage should be taken into account as an additional important target of resource management and allocation.
There is a significant body of research in task scheduling and load balancing (see1 for a survey of load
balancing policies in Web server clusters). Traditional load balancing solutions for a media server cluster, such as Round-Robin (RR), try to distribute requests uniformly to all machines. However, this may adversely affect efficient memory usage because frequently accessed content is replicated (cached) across the memories of all
machines. Earlier analysis2–5 shows that emerging media workloads exhibit a high degree of temporal and
spatial reference locality (i.e., a high percentage of requests are accessing a small subset of media files) and exhibit a strong sharing pattern (i.e., accesses to the same file may come in “bursts”). Typically, a media server throughput is significantly higher (3 to 10 times) when media streams are delivered from memory versus from disk. A significant portion of media content is represented by short and medium videos (2 min to 15 min) and their encoding bit rates are typically in the range of 56 Kb/s to 256 Kb/s CBR. Furthermore streaming objects may have footprints in the order of 10 MB. As the amount of main memory of modern servers reaches to 4GB, a large fraction of the accesses to popular media objects can potentially be served from memory, even when a media server relies on traditional file system and memory support and does not have additional application level caching. Thus, the locality available in a particular workload will have a significant impact on the behavior of the system because serving content from memory incurs much lower overhead than serving the same content
from disk. This observation led researchers to a design of “locality-aware” balancing strategies likeLARD6 and
DALA,7 which aim to reduce unnecessary file replication (caching) by different cluster nodes in order to improve
∗This research has been partially supported by the National Science Foundation under grants ITR-0428330 and CCR-0098278 and ACI-0090221.
the overall system performance. Current such load balancing strategies specially for clustered media servers,7–11 concentrate on video-on-demand workloads characterized by long durations and high encoding rates. A basic assumption in these works is that requested videos are watched entirely, requiring a large storage space in order to allow for full replication across all the cluster nodes.
An additional specific characteristic of streaming media workloads is that a significant amount of clients do
not finish playing the entire media file.2, 5, 12 This reflects the browsing nature of client accesses, client time
constraints, or QoS-related issues. Most incomplete sessions (i.e., sessions that are terminated by clients before the video is finished entirely) access only the initial segments of media files. In two streaming media workloads
analyzed in prior work,2 only 29% of the accesses in one workload and 12.6% of the accesses in the other workload
finish the playback of the accessed file. Note that a high percentage as high as 50%-60% of the accesses in both workloads lasts less than 2 minutes. This high percentage of incomplete accesses as well as a high number of sessions accessing only the initial part of the file create a very special resource usage model, which can help in
streaming media cache design.13
In this paper, we design and evaluate two novel load-balancing strategies for a media server cluster,FlexSplit
andFlexSplitLardthat aim to efficiently utilize the combined cluster memory by exploiting specific media work-load properties as outlined above. Under these new strategies, a media file is split into a sequence of continuous pieces of different sizes for streaming by different nodes in the cluster, and as such, it is delivered to the client by a coordinated ensemble of nodes in the media cluster. The file “split” points (i.e. the “cut-off” points in the file that define what portions of a media file are served by different cluster nodes) are dynamically updated over time. This feature enables the proposed strategies to deal with media file popularity changes and other dynamics exhibited by the media workload across time.
We evaluate the efficiency of the new strategies using a simulation model and a synthetic workload closely
imitating parameters of a real media server workload. Our evaluation of FlexSplit and FlexSplitLard when
compared to the traditionalRRload balancing strategy reveals a factor of ten improvement in the number of
dropped sessions and an increase by 15% in the available capacity in the media cluster over time. Our evaluation ofFlexSplitandFlexSplitLardcompared toLARDstrategy reveals a factor of two improvement in the number of dropped streams as well as a 4% increase in the media cluster’s available capacity on average. Furthermore, two new strategies support a more predictable resource usage pattern compared to LARD, a property that makes
them an attractive choice for handling dynamically changing workloads† .
This paper is organized as follows. Section 2 outlines background on media server benchmarking, gives a definition of cost function for streaming media requests, and presents a segment-based memory model. Section 3 introduces FlexSplit and FlexSplitLard. Section 4.1 describes the synthetic workload used in our performance study. Performance evaluation results are given in Section 4.2. We conclude with a summary and directions for future work, see Section 5.
2. MEDIA SERVER CAPACITY AND SEGMENT-BASED MEMORY MODEL
Commercial media servers are characterized by the number of concurrent streams that can be supported by a server without loss of a stream quality, i.e., to meet the real-time constraint of each stream. Two simple basic
benchmarks14 can establish the scaling rules for server capacity when multiple media streams are encoded at
different bit rates:
• the Single File Benchmark that measures a media server capacity when all the clients are accessing the same file, and
• theUnique Files Benchmarkthat measures a media server capacity when each client is accessing a different file.
†We compare new strategies against LARD, because DALA strategy concentrates on locality-aware content replication
issues. DALA strategy is targeting video-on-demand workloads where videos are represented by long durations from 60 min to 120 min and high encoding rates from 1.5Mb/s to 8 Mb/s. For such workload the required storage space may be very high for being fully replicated across all the cluster nodes. The DALA authors design a system with locality-aware content replication in the cluster. In their design, they assume that the videos are requested and watched entirely, they do not consider a problem that many clients access only the initial part of the videos.
Measurement results show that scaling for server capacity is non-linear when multiple media streams are encoded at different bit rates and that media server performance is much higher (for some disk/file subsystems up to 10
times higher) when media requests are served from memory versus from disk.14 Using measurements from these
two benchmarks, one can derive a cost function that defines thefractionof system resources needed to support
a particular media stream depending on the stream bit rate and type of access, i.e., memory file access or disk
file access, as follows15:
• costdisk
Xi gives the value of the cost function for a stream with disk access to a file encoded atXiKb/s, and
• costmemoryXi gives the value of the cost function for a stream with memory access to a file encoded atXiKb/s.
LetW be the current workload processed by a media server, where
• Xw=X1, ...Xkw is a set of distinct encoding bit rates of the files appearing inW,
• NXmemorywi is the number of streams having a memory access type for a subset of files encoded at Xwi Kb/s,
and • Ndisk
Xwi is the number of streams having a disk access type for a subset of files encoded atXwi Kb/s.
Under the above assumptions, the service demand to a media server under workloadW can be computed by the
following capacity equation:
Demand= kw i=1 NXmemorywi ×cost memory Xwi + kw i=1
NXdiskwi ×costdiskXwi, (1) which we use to evaluate the capacity requirements of a media workload on a particular media server configu-ration.
In order to assign a costto a new media request, we need to evaluate whether a request will be streaming
data from memory or will be accessing data from disk. Note that memory access does not assume or require that the whole file resides in memory. If there is a sequence of accesses to the same file that are issued closely in time to one another, then the first access may read a file from disk, while the subsequent requests may be
accessing the corresponding file from memory. For this classification, we use a segment-based memory model15
that reflects data stored in memory as a result of media file accesses. This model closely approximates the media server behavior when the media server operates over a native OS file buffer cache using the LRU replacement policy. The basic idea of computing the request access type exploits the real-time nature of streaming media
applications and the sequential access to file content. Let Sizemem be the size of memory in bytes‡. For each
request r, we have information about the media file requested by r, the duration ofr in seconds, the encoding
bit rate of the media file requested byr, the timetwhen a stream corresponding to requestris started , and for
all finished requests, we have the time when a stream initiated by requestris terminated. Note thatr(t)reflects
that the request started at timet.
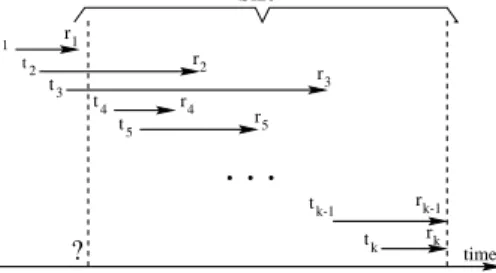
k-1 t k t 1 2 t 3 3 2 1 4 4 time 5 5 ? k k-1 T T t t r t r r r r r r mem t Sizemem
. . .
Figure 1.Memory state computation example.
Let r1(t1), r2(t2), ..., rk(tk) be a recorded sequence of requests to a media server. Given that the model ap-proximates a file buffer cache under LRU, if the segment streamed by a request is already in the memory, this segment will be updated with a new time stamp. Otherwise this segment will be read into the memory from
disk. Given current time T and request r(T) to media file f, we compute the time stamp Tmem such that all
bytes stored in memory betweenTmemandT is equal toSizememas shown in Figure 1. This effectively suggests
that the file segments streamed by the media requests between timesTmemandT are in memory. Thus, one can
identify whether requestrwill stream file f (or some portion of it) from memory by checking if the segments it
requests are in memory.
3. LOAD BALANCING SOLUTIONS FOR MEDIA SERVER CLUSTERS
Media server clusters are used to create scalable and highly available solutions. We assume that each node in
a cluster has access to all media content, i.e., any node can satisfy any client request. A cluster of N nodes
offers an N-fold-increase in the processing power, while its combined memory is N times larger than a single
node. Capacity planning in such a system must take into account both increased processing power and increased memory size.
Traditional load balancing solutions for a media server cluster, such as Round-Robin (RR)try to distribute
requests uniformly to all the machines. However, this may adversely affect an efficient memory usage because the frequently accessed content is replicated across the memories of all machines. With this approach, a cluster
havingNtimes bigger memory might effectively utilize almost the same memory as one node. This observation
contributed to the design of “locality-aware” balancing strategies likeLARD6andDALA,7 which aim to avoid
the unnecessary file replication in memory (LARD and DALA) and across the nodes in the cluster (DALA) to improve overall system performance. While LARD and DALA can obtain significantly improved memory hit ratios, they do not specifically aim for equally balancing the load in the cluster. AdaptLoad has been proposed
to achieve both “workload-aware” and “locality-aware” behavior.16 AdaptLoad monitors the incoming workload
and balances load using the empirical size distribution of the requested documents to dispatch a request based on its requested file size. Note that AdaptLoad can not be directly applied to a streaming media scenario. Because many clients (as high as 80% of all) do not finish playing the whole video, the distribution of durations of media sessions (i.e., client accesses) and the distribution of original media file durations can be vastly different.
Our load balancing strategy FlexSplit is inspired by AdaptLoad, but instead of considering file sizes, we focus on the prefix duration of requests and aim to achieve high memory hit ratios for the early play durations of the streaming workload as well as equally load balancing in the cluster. In the next section, we describe the FlexSplit strategy in more detail.
3.1. FlexSplit strategy
000000000000000000000000000000000000 000000000000000000000000000000000000 000000000000000000000000000000000000 000000000000000000000000000000000000 000000000000000000000000000000000000 000000000000000000000000000000000000 000000000000000000000000000000000000 000000000000000000000000000000000000 000000000000000000000000000000000000 000000000000000000000000000000000000 000000000000000000000000000000000000 000000000000000000000000000000000000 000000000000000000000000000000000000 000000000000000000000000000000000000 000000000000000000000000000000000000 000000000000000000000000000000000000 000000000000000000000000000000000000 000000000000000000000000000000000000 000000000000000000000000000000000000 000000000000000000000000000000000000 000000000000000000000000000000000000 000000000000000000000000000000000000 000000000000000000000000000000000000 111111111111111111111111111111111111 111111111111111111111111111111111111 111111111111111111111111111111111111 111111111111111111111111111111111111 111111111111111111111111111111111111 111111111111111111111111111111111111 111111111111111111111111111111111111 111111111111111111111111111111111111 111111111111111111111111111111111111 111111111111111111111111111111111111 111111111111111111111111111111111111 111111111111111111111111111111111111 111111111111111111111111111111111111 111111111111111111111111111111111111 111111111111111111111111111111111111 111111111111111111111111111111111111 111111111111111111111111111111111111 111111111111111111111111111111111111 111111111111111111111111111111111111 111111111111111111111111111111111111 111111111111111111111111111111111111 111111111111111111111111111111111111 111111111111111111111111111111111111 s0 = 0 s1 s2 s3 Play DurationNode 1 Node 2 Node 3
Cost
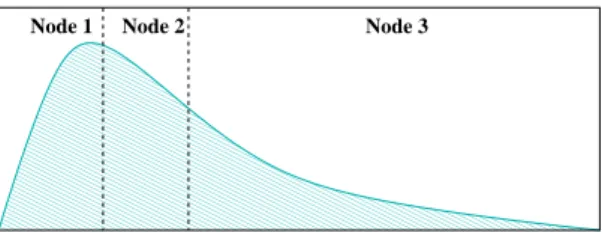
Figure 2.Illustration of histogram of costs by play duration forN= 3.
Assume that there areN identical nodes in the cluster and thatM multimedia files are stored in the system.
FlexSplit partitions the entire duration into N disjoint intervals, [s0 ≡0, s1),[s1, s2), up to [sN−1, sN ≡ ∞), so
that node i, for 1≤i ≤N, is responsible for satisfying requests whose current streaming duration is between
to nodei contribute a fraction 1/N to the value of the expected total costs,S, that is, for 1≤i≤N, si−1 x=si−1 F(x)≈ N1 ∞ 0 F(x) = S N, (2)
whereF(x) is the total costs for thexthtime unit play duration. By routing specific requests to specific nodes
according to the above interval definitions, FlexSplit achieves load balancing in the cluster. Additionally the requests streaming the same file segment will be dispatched into the same node so that the probability of a memory hit increases.
The key of FlexSplit is the prediction of an accurate histogram of total costs in every play time unit, i.e.,
F(x) for all 0≤x <∞. For a streamrwith encoding bitrateXr, if stream’s behavior is known a priori, i.e., if
we know that forDrtime units it remains in the cluster and that it streams itsxthplay time unit from memory,
then F(x) can be incremented bycostmemoryXr . Otherwise F(x) will be incremented bycostdisk
Xr . Recording all
streams behavior in each node and forwarding this information to the front-end server/switch introduces high overhead to FlexSplit. Building the histogram at the front-send server/switch without exchanging information with back nodes is an efficient alternative.
Predicting whether a request will be streaming a file from memory or disk at the time it arrives at the system is a difficult problem which is further exacerbated by the fact that the portion of the file will be streamed from memory or disk is not known a priori, as this request may generate more sub-requests to different nodes sequentially. To address this problem, we assign a “higher” cost to tails of files given that tails are not frequently requested and that they have a higher probability to result in a memory miss. We compute the average play
durationaccessi of all previous streams for filei. Then all play time units afteraccessi have higher costs, which
are given by multiplying them with a scalar weight. The value of weight is important for performance. If
weight= 1, then we totally ignore the high cost of disk streams, resulting in under-loading first several nodes while the last several nodes are over-loaded because of lower memory hit ratios expected in the last nodes. If weight=costdisk
Xi /costmemoryXi , then this results in overloading the first nodes because we over-estimate the costs
of the last nodes by considering all the streams in the last nodes as disk streams. Thereforeweight should be
a value in the range [1, costdisk
Xi /costmemoryXi ] and it should also depend on the hit ratio and the cost function of
each node. Currentlyweightis decided off-line by searching for optimal dropping ratios.
We use a monitoring window, i.e., for everyKdepartures (10,000 in our experiments), we monitor and update
the splitting intervals [s0≡0, s1),[s1, s2),up to [sN−1, sN ≡ ∞). When a requestrfor fileideparts the system,
the histogramF(x) of this monitoring window is updated using the following steps:
• we get the request’s prefixed play durationDr, and its encoding bitrateBr;
• we incrementF(x) byBr for allx: 0≤x≤accessi, and byBr·weight for allx: accessi< x≤Dr−1;
and
• we recompute the average play durationaccessifor fileiby adding the durationDi of the latest access to
filei to all the previous accesses to filei.
To adapt to transient workloads, we predict the nextK requests using a geometrically discounted weighted
sum of all the previously observed batches. The histogramF(x) for the most recentK requests has the highest
weight.
3.2. FlexSplitLard Strategy
Under FlexSplit, the first several nodes in the cluster always have higher memory hit ratios than the last ones. The reason is that most of the accesses to short initial portion of the files are streamed by the first node from memory. Many of these sessions get terminated as media workload analysis shows, and fewer sub-requests go to the second node, and so on. As a result, the split duration gradually increases for latter nodes. Less predictable and longer play durations streamed by the last nodes decrease memory hit ratios. One way to improve performance of the nodes that stream media file “tails” is to exploit locality in file accesses and use different nodes to stream different subset of the files, i.e. serve the file “tails” using the benefits of LARD.
We propose a hybrid load balancing policy FlexSplitLard, which combines FlexSplit and LARD. The splitting boundaries under FlexSplitLard are decided in the same way as FlexSplit and requests get service from the first
nnodes exactly as in FlexSplit. Note thatnis chosen to let the firstnnodes have good memory hit ratios. For
those requests that are assigned into the nodes after thenth node, they are not dispatched according to the play
durations, but they are assigned to the remaining (N−n) nodes according to LARD.
4. PERFORMANCE EVALUATION
4.1. Simulated workload
We use the publicly available, synthetic media workload generatorMediSyn.17 In our study we use a synthetic
workload that closely imitates parameters of real enterprise media server workloads.2
The media file duration distribution can be summarized via the following six classes: 10% of the files represent short videos up to 2min, 15% of the videos have a 2 to 5min duration, 20% of the videos are from 5 to 10min, 23% are from 10 to 30min, 20% are from 30 to 60min, and 12% of the videos are longer than 60 min. This
distribution represent a media file duration mix that is typical for enterprise media workloads,2 where along
with the short and medium videos (e.g., demos, news, and promotional materials) there is a representative set of long videos (e.g., training materials, lectures, and business events).
The file bit rates are defined by the following discrete distribution: 5% of the files are encoded at 56Kb/s, 20% of the files at 128Kb/s, 50% of the files at 256Kb/s, and 25% of the files at 500Kb/s. Request arrivals are modeled using a Poisson process; one new request arrives per second on the average. The file popularity in this
synthetic workload is defined using a generalized Zipf distribution17withα= 1.5 andk = 7 ink-transformation.
The workload has a fileset of 4000 files (with overall storage requirements of 207 GB), where 90% of the requests target 8% of the files. Correspondingly, 8% of the most popular files have an overall combined size of 16.7 GB.
Number of Files 4000
Zipf α 1.5
Storage Requirement 207 GB
Number of Requests 1,089,245
Trace Duration 1 month
Table 1. Workload parameters used in the
simulation study. 0 20 40 60 80 100 0.01 0.1 1 10 100 1000 CDF (%) Prefix (minutes) Stream requests Unique files
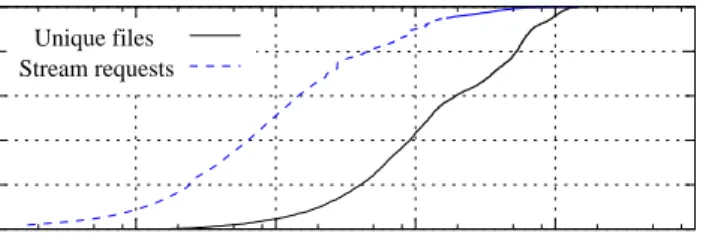
Figure 3. CDF of the media session (client access) durations and the
original media file durations.
Evidence from media workload analysis2, 12, 18 indicates that client demands are highly variable: some days
(hours) exhibit 10-30 times higher load comparing to the typical daily (hourly) averages. In MediSyn, a user can specify a global diurnal pattern, which contains a set of bins. Each bin specifies a time period and the ratio of accesses in this bin. Our workload is defined by the 1-hour-long bins with load variation of up to 16 times between the “quiet” and “peak” load hours.
The requests to the streaming media server usually have very short play durations as illustrated in Figure 3. By characterizing both the unique media files provided by the cluster and the requests arriving at the cluster, we find that although only 10% of unique files have play duration less than 2 minutes, 67% of the requests stay in the cluster for less than 2 minutes, and 90% of the requests stay in the cluster for less than 10 minutes. This large gap is not only because the popularity of the short media files, but also because most requests stream only prefixes of the entire files, e.g., as high as 80% of all clients do not finish playing the whole video.
We use a 5-node media server cluster in our simulation study. The server capacity scaling rules for different encoding bit rates are similar to those measured using the experimental testbed described in Section 2. We use
costdiskXi /cost
memory
Xi = 10, i.e., the cost of disk access for files encoded at bit rateXi is 10 times§ higher than the
cost of the corresponding memory access. Finally, we assume that the memory size of each node is 0.5 GB.
4.2. Experimental results
We valuate the following four load balancing solutions:
• Round-Robin (RR): the requests are dispatched to each node of the cluster in a round-robin fashion;
• LARD: initially, the first access to a file is assigned to the least loaded node in a cluster, while the
subsequent requests to the file are sent to the same, already assigned node. Two parameters are set to avoid unbalanced situations, e.g., when queue length in the assigned node for a new request is larger than a predefined parameter and there exists a node with queue length less than another predefined parameter, this new request is dispatched according to Join the Shortest Queue (JSQ) strategy;
• FlexSplit: see section 3.1; • FlexSplitLard: see section 3.2.
In the rest of this section, the performance of these four strategies is compared focusing on four metrics, i.e., arrival rates per node, dropping ratios, hit ratios, and available capacity.
Arrival rates
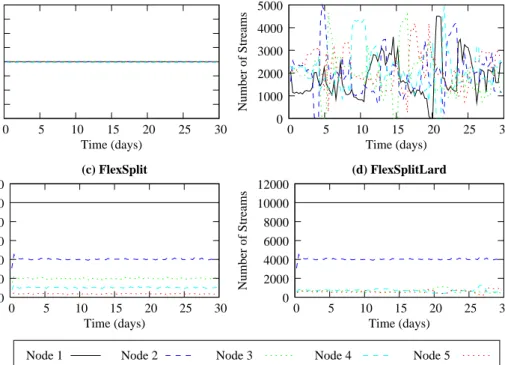
The primary target of a good load balancing strategy is to balance the work within the cluster. Figure 4 illustrates the number of streams arriving at each node in the 5-node cluster within one monitoring window, i.e., 10K requests. As expected, RR dispatches the requests in turn to each node so that every node receives 2000 requests in one monitoring window. LARD uses two parameters to load balance in the cluster, that aim to strike a balance between cache hits and load balancing. Too much bias to load balancing turns LARD to a Join the Shortest Queue (JSQ)-like load balancing policy, which has been proven not efficient for I/O intensive
workloads.16 In our experiments, we tune LARD parameters to reduce stream dropping ratios. Consequently
LARD does not balance load well as shown in Figure 4(b).
We turn now to FlexSplit and we first see that there is a clear imbalance on the number of streams that are sent to the 5 nodes (see Figure 4(c)). According to the policy, every request arrives at the first node where it may be partially served. Incomplete requests will go the second nodes, and so on. As a result, the number of streams arriving at node 1 is always 10K in one monitoring window, and this number decreases proportionally to the latter nodes. Under FlexSplitLard (see Figure 4(d)), the streams to the last three nodes are served under LARD so that the effect of decreased number of streams to the latter nodes is not present.
Figure 5 gives the total bytes of requests arriving at each node in every monitor window. For RR and LARD that serve one request in one node only, one can observe the same characteristics in the bytes arrival rate (i.e., total bytes streamed by the requests arriving at the node per second) as the streams arrival rate (comparing Figure 5(a)-(b) with Figure 4(a)-(b)). RR distributes the bytes of requests equally, but LARD does not balance them among nodes. In FlexSplit and FlexSplitLard, the number of bytes presents better load balancing than the number of streams. Figure 5(c) shows a smooth distribution of the bytes of incoming streams across nodes. As expected, the latter nodes have less work because of the higher weight assigned to the tail of the streams for both FlexSplit and FlexSplitLard. Figure 5(d) shows that under FlexSplitLard the last 3 nodes depict a relatively bursty behavior due to LARD.
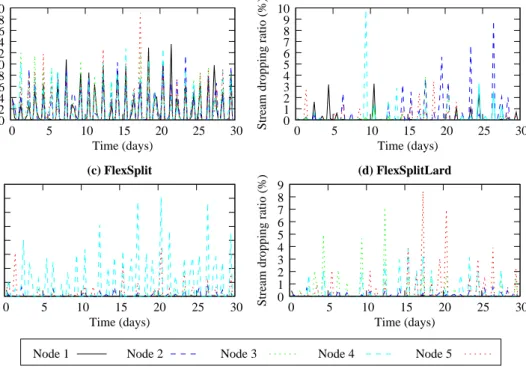
Dropping ratios
Commercial media servers are typically characterized by the number of concurrent streams a server can support without loosing a stream quality, i.e., until the real-time constraint of each stream is met. Thus, a streaming media server must ensure that sufficient resources are available to serve a request, ideally, for the
§In real systems, a media server throughput can 3 to 10 times higher when media streams are delivered from memory
versus from disk. Here we choose a cost ratio of 10 as it can better distinguish the difference among different load balancing policies.
1980 1985 1990 1995 2000 2005 2010 2015 2020 0 5 10 15 20 25 30 Number of Streams Time (days) (a) RR 0 1000 2000 3000 4000 5000 0 5 10 15 20 25 30 Number of Streams Time (days) (b) LARD 0 2000 4000 6000 8000 10000 12000 0 5 10 15 20 25 30 Number of Streams Time (days) (c) FlexSplit 0 2000 4000 6000 8000 10000 12000 0 5 10 15 20 25 30 Number of Streams Time (days) (d) FlexSplitLard
Node 1 Node 2 Node 3 Node 4 Node 5
Figure 4.Number of streams arriving at each node for every 10K requests across time.
20 40 60 80 100 120 140 160 180 200 0 5 10 15 20 25 30 Number of Bytes (MB) Time (days) (a) RR 0 50 100 150 200 250 300 0 5 10 15 20 25 30 Number of Bytes (MB) Time (days) (b) LARD 20 40 60 80 100 120 140 160 180 200 0 5 10 15 20 25 30 Number of Bytes (MB) Time (days) (d) FlexSplitLard 20 40 60 80 100 120 140 160 180 200 0 5 10 15 20 25 30 Number of Bytes (MB) Time (days) (c) FlexSplit
Node 1 Node 2 Node 3 Node 4 Node 5
Figure 5.Number of bytes arriving at each node for every 10K requests across time.
duration of the entire request. If not, the request should be rejected rather than allow it to consume resources that deliver little value to the end user, while degrading the QoS to all clients already receiving content. To this end, a new request will be dropped if by accepting it, it may lead the system to operate immediately in overload or if it brings the system in overload in the near future. Therefore, the dropping ratio becomes an important metric in evaluating load balancing in such systems. Table 2 provides the numbers of the rejected streams and the rejected bytes across each node and the entire cluster.
Policy Total Node 1 Node 2 Node 3 Node 4 Node 5 RR 22458 4280 4254 4633 4604 4687 LARD 2760 243 1108 187 817 405 Streams FlexSplit 1647 69 374 100 1025 79 FlexSplitLard 1189 69 374 227 252 267 RR 200 38 37 42 40 43 LARD 22.4 2 10 1.6 5.8 2.8 Bytes (GB) FlexSplit 48.8 0.9 6.8 2.4 35.6 3.1 FlexSplitLard 28.3 0.9 6.8 5.8 5.8 9.0
Table 2.Number of rejected streams/bytes in the 5-node media cluster
As expected, RR shows the worst performance. Overall it drops around 2.0% of the entire streams and 2.5% of the entire bytes given that the total number of streaming requests is 1,089,245 and the total number of bytes is 7.9TB. Its performance is similar across all nodes. The rejected numbers of both streams and bytes under LARD are only 1/10 of those under RR. FlexSplit drops 1/3 less number of streams compared with LARD, but twice as many of bytes. Note that by design it drops very little in the first node. Under FlexSplit the requests in the latter nodes usually have longer play durations due to larger request sizes. For example, the average number of bytes for each dropped stream in node 1 is 13MB, but it is 40MB in node 5. As a result, large number of request bytes might be dropped even if only a small number of streams are dropped in the last nodes. In this fashion, FlexSplit favors small jobs, which helps providing QoS in high load situation. FlexSplitLard has the best performance with respect to the dropping ratio metric. It has the exact same performance in the first 2 nodes as FlexSplit, but much better performance in the last 3 nodes. It only drops half the number of streams as LARD does, and a comparable number of bytes.
0 2 4 6 8 10 12 14 16 18 20 0 5 10 15 20 25 30
Stream dropping ratio (%)
Time (days) (a) RR 0 1 2 3 4 5 6 7 8 0 5 10 15 20 25 30
Stream dropping ratio (%)
Time (days) (c) FlexSplit 0 1 2 3 4 5 6 7 8 9 10 0 5 10 15 20 25 30
Stream dropping ratio (%)
Time (days) (b) LARD 0 1 2 3 4 5 6 7 8 9 0 5 10 15 20 25 30
Stream dropping ratio (%)
Time (days)
(d) FlexSplitLard
Node 1 Node 2 Node 3 Node 4 Node 5
Figure 6.Dropping ratios of streams for every 10K requests across time.
We now turn into the behavior of each node in the cluster. Dropping ratios of streams and bytes have similar shape. We only plot dropping ratios of streams here since each dropped stream reduces the server’s profit, no matter if it is short or long. Figure 6 illustrates the dropping ratios of streams across time. RR has the highest dropping ratios across time for all the nodes which can reach up to 20%. Under LARD, some spikes of
dropping ratios appear in the 2nd node and the 4th node and correspond to the high load in these nodes (see also Figure 4(b)). The highly total dropping ratio in node 4 under FlexSplit as shown in Table 2 can also be detected in Figure 6(c). This is because the relatively high arrival rate, i.e., both node 3 and node 4 see almost the same arrival rates but there is a lower memory hit ratio in node 4. Although node 5 has the lowest memory hit ratio (see Figure 7(c)), its lowest arrival rates help in improving performance. Figure 6(d) shows that the dropping ratios of the last 3 nodes under FlexSplitLard are similar. Some spikes are observed as in LARD but never above 9%.
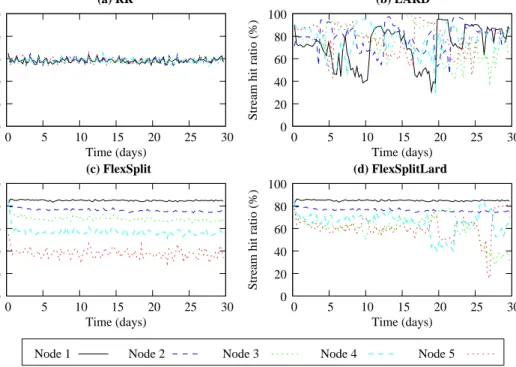
Memory hit ratios
(c) FlexSplit (d) FlexSplitLard (a) RR (b) LARD 0 20 40 60 80 100 0 5 10 15 20 25 30
Stream hit ratio (%)
Time (days) 0 20 40 60 80 100 0 5 10 15 20 25 30
Stream hit ratio (%)
Time (days) 0 20 40 60 80 100 0 5 10 15 20 25 30
Stream hit ratio (%)
Time (days) 0 20 40 60 80 100 0 5 10 15 20 25 30
Stream hit ratio (%)
Time (days)
Node 1 Node 2 Node 3 Node 4 Node 5
Figure 7.Average stream hit ratio for every 10K requests across time.
Figure 7 evaluates the performance of each policy considering the memory hit ratios of the streams within each monitoring window. RR has a stable stream hit ratios of 60% across time as shown in Figure 7(a). Figure 7(b) shows that the hit ratios under LARD are not stable. It may reach up to 95%, but then decrease down to 40% in one node only, behavior that is attributed to the transient nature of the workload and its temporal locality. Overall, LARD achieves hit ratios as high as 80% for all nodes. Hit ratios in FlexSplit are also stable but continuously reduced in latter nodes. The first node has the highest hit ratio of about 85%, which is even better than LARD. Hit ratios reduce to about 76%, 68%, 52% and 40% for nodes 2, 3, 4 and 5, respectively. FlexSplitLard has much better overall average memory hit ratios in the last three nodes compared to FlexSplit. The stable performance of FlexSplit presents an advantage over LARD since it results in more predictable performance. Such predictability benefits the system design for both capacity planning and QoS provisioning.
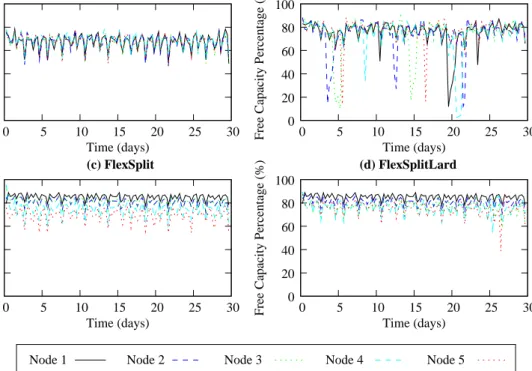
Available capacity
Media workload measurements of existing media services indicate a “peak-to-mean” workload variance of more than one order of magnitude. Our workload is defined by the 1-hour-long bins with load variation of up to 16 times between the “quiet” and “peak” load hours. It motivates us to consider an additional metric of available capacity in the media cluster over time. While the number of rejected streams reflects media cluster performance under peak load, the metric of available capacity over time aims to evaluate overall media cluster performance over the entire simulation run.
RR FlexSplit LARD FlexSplitLard 0 20 40 60 80 100 0 20 40 60 80 100 CDF (%)
Free Capacity Percentage (%)
Figure 8.CDF of time percentage of system available capacity.
(a) RR (b) LARD (c) FlexSplit (d) FlexSplitLard 0 20 40 60 80 100 0 5 10 15 20 25 30
Free Capacity Percentage (%)
Time (days) 0 20 40 60 80 100 0 5 10 15 20 25 30
Free Capacity Percentage (%
) Time (days) 0 20 40 60 80 100 0 5 10 15 20 25 30
Free Capacity Percentage (%)
Time (days) 0 20 40 60 80 100 0 5 10 15 20 25 30
Free Capacity Percentage (%)
Time (days)
Node 1 Node 2 Node 3 Node 4 Node 5
Figure 9. Average percentage of available capacity of each node over time.
The available capacity in the media cluster under different load balancing strategies is shown in Figure 8 and 9. Figure 8 gives the CDF of free capacity in the entire cluster. The x-axis is the ratio of the free capacity over the entire capacity in the cluster, and the y-axis presents the cdf of time that the system has certain free capacity. A point (x, y) in the figure means that for y% of the experiment time, the cluster has less than x% available capacity. Figure 9 shows that RR has least available capacity, LARD is better than RR, FlexSplit is better than LARD, and FlexSplitLard performs best. The improvement of FlexSplitLard compared with FlexSplit is small. More available capacity under FlexSplit and FlexSplitLard shows that these policies result in a media server with higher availability that can also adapt to workloads easier than LARD.
Figure 9 further illustrates the available capacity over time. This figure is similar to Figure 7 which indicates that the available capacity has a strong relation to the memory hit ratios. Again LARD has more bursty performance than the other policies, given that the difference of two adjacent monitoring windows for available capacity percentage never exceeds 30% under RR and FlexSplit. This value can reach 70% under LARD in day 5 and day 20.
5. FUTURE WORK
In this paper, we propose two new load balancing strategies, FlexSplit and FlexSplitLard, which monitor and adaptively balance the incoming workload in a media cluster, aiming at efficiently utilize the combined cluster memory while providing high performance to the end users. By comparing with two other popular strategies RR and LARD via a simulation model, we illustrate that these two new policies can achieve lower number of dropped streams as well as higher available capacity. In the future, we will further improve the adaptability of our policies by providing a more accurate cost function of the workload by improving the memory hit ratios in each node. Moreover, we will consider assigning subclusters to serve the same file prefix so that all the requests do not start at the same node. By balancing the requests within a subcluster, we can further improve memory hit ratios and overall system performance.
REFERENCES
1. V. Cardellini, E. Casalicchio, M. Colajanni, and P. S. Yu, “The state of the art in locally distributed
Web-server systems,”ACM Computing Surveys34, pp. 1–49, June 2002.
2. L. Cherkasova and M. Gupta, “Characterizing locality, evolution, and life span of accesses in enterprise
media server workloads,” inProc. ACM NOSSDAV 2002, May 2002.
3. D. Luperello, S. Mukherjee, and S. Paul, “Streaming media traffic: an empirical study,” inProc. of Web
Caching Workshop (WCW’02), June 2002.
4. M. Chesire, L. Wolman, G. M. Voelker, and H. M. Levy, “Measurement and analysis of a streaming-media
workload,” inUSITS, 2001.
5. W. Tang, Y. Fu, L. Cherkasova, and A. Vahdat, “Long-term streaming media server workload analysis and modeling,” Tech. Rep. Technical Report HPL-2003-23, HP Laboratories, Feb. 2003.
6. V.Pai, M.Aron, G.Banga, M.Svendsen, P.Drushel, W. Zwaenepoel, and E.Nahum, “Locality-aware request
distribution in cluster-based network servers,” in Proc. of the 8th Intl. Conf. on Architectural Support for
Programming Languages and Operating Systems (ASPLOS VIII), 1998.
7. Z. Ge, P. Ji, and P. Shenoy, “A demand adaptive and locality aware (dala) streaming media cluster
archi-tecture,” inProc. of ACM NOSSDAV 2002, 2002.
8. S. V. Anastasiadis, K. C. Sevcik, and M. Stumm, “Modular and efficient resource management in the exedra
media server,” in3rd USNIX Symposium on Internet Technologies and Systems, (San Francisco, California),
Mar. 2001.
9. W. Bolosky, J. Draves, R. Fitzgerald, G. Gibson, M. Jones, S. Levi, N. Myhrvold, and R. Rashid, “The
tiger video fileserver,” inNOSSDAV’96, Apr. 1996.
10. Y. Chae, K. Guo, M. Buddhikot, S. Suri, and E. Zegura, “Silo, rainbow, and caching token: Schemes for
scalable fault tolerant stream caching,”IEEE Journal on Selected Areas in Communications, Sept. 2002.
11. O. Sandsta, S. Langorgen, and R. Midtstraum, “Video server on an ATM connected cluster of workstations,” in Proceedings of the 17th International Conference of the Chilean Computer Science Society (SCCC ’97), pp. 207–217, Nov. 1997.
12. J. Almeida, J. Krueger, D. Eager, and M. Vernon, “Analysis of educational media server workloads,” in
Proc. of NOSSDAV 2001, June 2001.
13. S. Sen, J. Rexford, and D. Towsley, “Proxy prefix caching for multimedia streams,” inProc. of INFOCOM,
Mar. 1999.
14. L. Cherkasova and L. Staley, “Measuring the capacity of a streaming media server in a utility data center
environment,” inProc. of 10th ACM Multimedia, 2002.
15. L. Cherkasova, W. Tang, and A. Vahdat, “Mediaguard: a model-based framework for building streaming
media services,” inProc. of Multimedia Computing and Networking 2005 (MMCN’05), 2005.
16. Q. Zhang, A. Riska, W. Sun, E. Smirni, and G. Ciardo, “Workload-aware load balancing for clustered web
servers,”IEEE Transactions on Parallel and Distributed Systems (TPDS)16(3), pp. 219–233, Mar. 2005.
17. W. Tang, Y. Fu, L. Cherkasova, and A. Vahdat, “Medisyn: A synthetic streaming media service workload
generator,” inProc. of ACM NOSSDAV 2003, 2003.
18. S. Acharya, B. Smith, and P.Parnes, “Characterizing user access to videos on the world wide web,” inProc.