This PDF is a selection from an out-of-print volume from the National Bureau of
Economic Research
Volume Title: Annals of Economic and Social Measurement, Volume 5, number 1
Volume Author/Editor:
Sanford V. Berg, editor
Volume Publisher: NBER
Volume URL: http://www.nber.org/books/aesm76-1
Publication Date: 1976
Chapter Title: P
rogramming
S
oftware
N
otes:
I
nformation
S
ystems
for
P
ublic
S
ector
M
anagement
Chapter Author: William D. Haseman, Andrew B. Whinston
Chapter URL: http://www.nber.org/chapters/c10431
Annals of Economic and Social Meusure,nenz, 5/I, I 97ô
PROGRAMMING SOFTWARE NOTES
INFORMATION SYSTEMS FOR PUBLIC SECTOR MANAGEMENT*
BY WILLIAM D. HASEMAN AN!) ANDREW B. WIIINSTON
This paper presents a generalized framework for managing and analyzing large economic data bases. The data bases have the common properties of (a) a complex structure, (b) a need for editing, and (c) repeated operations. A generalized data management system is described which is then interfaced to a Query Language Processor. The data cycle is then discussed with its relationship to the data merging and conversion pro blem. The frantework is then applied to two different and specific studies. The conclusion of
the paper is this framework which separates the data mnanagernentfunctionsfropn the economic analysis functions. This division of labor provides far a more consistent and useful system.
1. INTR0DVCrI0N
During the last fifteen years, as the capabilities of computers have increased, we have witnessed a phenomenal growth in their use for policy analysis. A concur-rent, if not spectacular, growth has taken place in the business management field
to such an extent that the term Management Information Systems has been coined. The naming of the field is probably more of an indication of level of activity rather than the existence of an organized body of theory and practice. However, there has been an attempt by computer manufacturers and several
software vendors to make available to companies a variety of software packages
that would help in the development and operati
'f s"
systems. In fact, thisneed has developed a commercial market for what are referred to as File
Management Systems or data management systems. These systems are valuable inthat they both require the user to adapt certain formalization of the data
management process and provide already developed software needed to carry outmuch of the development of the information systems.
This paper will explore the problem of data management in the public
non-commercial sector of our economy. By attempting to formalize our approachto this problem, we can hope to understand the overlap with the problems of management information systems and of course, the differences. The ultimate value of a formal approach to this problem is that we may learn what aspects of
software development are specific to any application and what parts are common to the typical implementation. The ability to conceptually introduce this division
of labor should lead to the development of software which will expedite the
development of public data systems. This paper gives views both at the conceptual and software level.
We first present a general framework for an information system. This
framework underlines an implementation of a data management system
developed in the field of water pollution control. We will also show that our
* This work was supported in part by Grant Number GJ377-55 from the Office of Computing Activities of the National Science Foundation and Office of Water Resources Research.
139
r
Analyze r l)ata I)escriptn ni Language 1teracitcor batch mode) Query System C untrol F)ata I ariipu I at ion language l)tta l3aseL- - -
---t)tta sI aliageilic ill Ss tciii
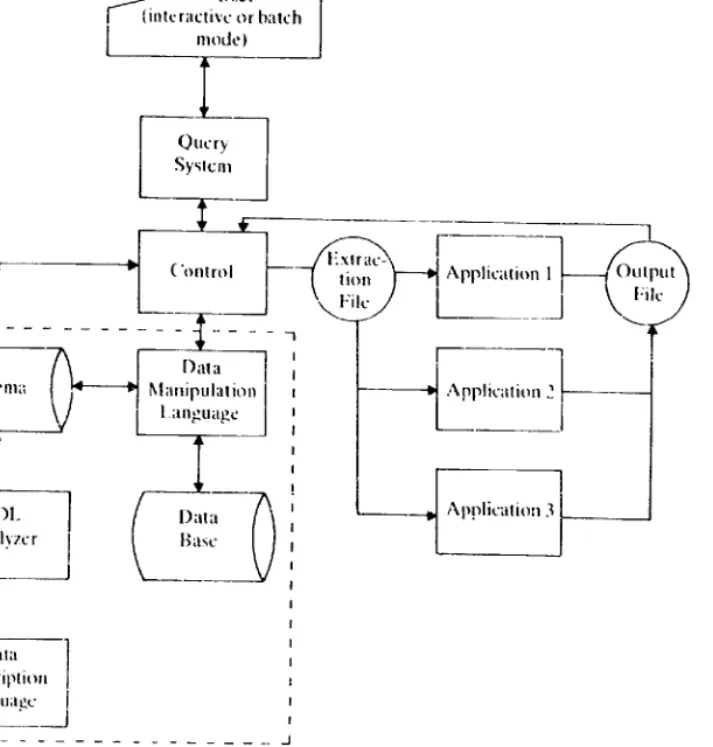
Figure 1 (PLAN System
framework is consistent with an extensive specific study of a different problem carried out by David, Gates. and Miller. [I].
Most of the studies of ttie nature underdiscussion begin with first determining
the ultimate goal of the study, and then proceeding to search for existing data which can be used to accomplish this goal. Rausser arid I-lowitt [21 presenteda
model which they developed for the stochastic control of environmental
exter-nalities, in which such data requirements were enormous. Although sonic projects have the luxury of collecting and verifyingthe specific data required for the study.
the majority of the studies rely on tapes of data collected from numerous and unrelated previous studies..1he tapes often present the researcher with
overlap-ping and inconsistent data and with
missing and unwanted data. Many largeprojects devote the majority of their effort in converting their initial data intoa
clean data base for their analysis. Ucforc looking at the problem of developing a clean data base, it is first necessary to present a background discussion of data
[
1
I Application I
Application
i\ptication 3
management systems and a general framework of a planning system we have developed around a data management system.
2. DATA MANAGEM ENT Sys'ni
The structure of the GPLAN-Data Management System (GPLAN/DMS) is
shown in Figure 1. Although only a brief discussion of this system will he included here, a more detailed discussion may be found in [3] and [41. TheGPLAN/DMS
system is based on the specifications of the 1971 CODASYL Data Base Task
Group (DBTG) report [5]. The data management system consists of the data base, a schema which is the logical description of the data base, and the data
nianipula-tion language (DML). The schema
is generated from the Data Description
Language (DDL) and contains a description of the record-types in the data base,
the item-types contained in those record-types, and the set relationships formed
by those record-types.
The user generates a schema by writing
the data description in the Data
Description Language, which is then processed by the DDL analyzer. An example DDL is shown in Figure 2, and the record occurrencesassociated with that DDL is shown at the bottom of the Figure. This DDL defines a simple water pollution data base which consists of three record-types and three sets. As can he seen, the first
record-type ('BASN') contains three item-types ('BSED', 'BSNA', E'), and can
be a member record in the set 'ALLB' and an owner record of the set 'RVIB'. The
DDL for the total Data Base is generated only once, and the system saves this description in the schema for future use by the Data Manipulation Language
(DML).
Since the DDL provides for a set structure relationship among the various
record types, the system can store any
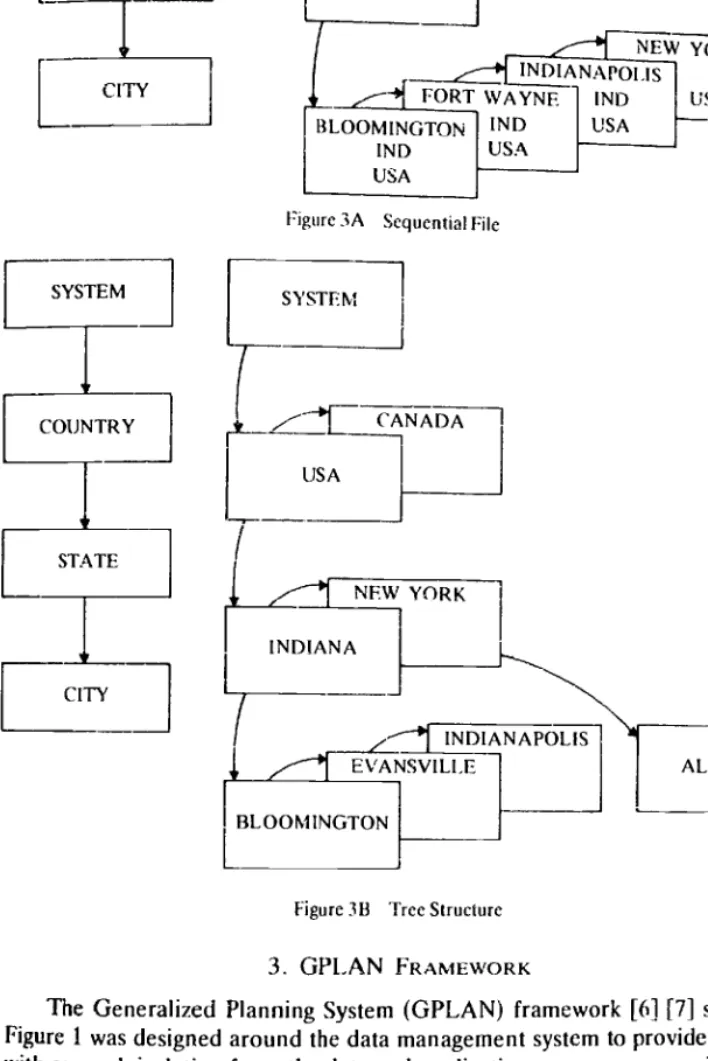
logical structure ranging from simple sequential files to the most complex of networks. The examples shown in Figure 3 demonstrate three of the many possible data structures which can be stored in thedata base. All of those examples assume that some economic data has been
collected and that this information will be keyed on CITY, STATE, and
COUNTRY.
The first example (3A) shows how the data could be stored as a sequential file.
Each record occurrence is stored in this single set and can only be reached by
sequentially searching through the set until the desired city is located. The second example (3B) demonstrates how the same data could be a structure in a tree-like
structure. To locate a particular
record occurrence, the user first selects theappropriate country, then the state, and thensearches for the city of interest. The third structure (3C) is a network structurein which the owner member relation-ship is considerably more complex. This structure provides the user with the freedom of moving in any direction, but forces him to be concerned with such
problems as looping. As can be seen by these three examples, the user can select
the appropriate data structure whichwill satisfy his data requirements.
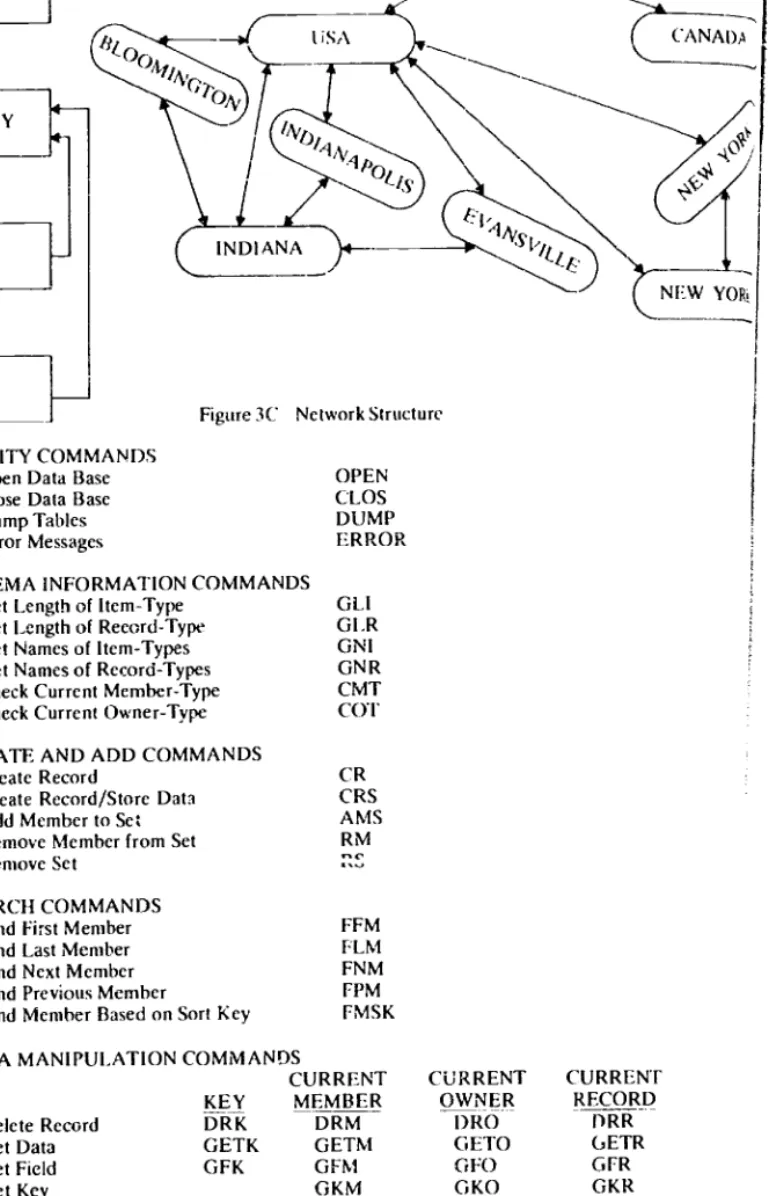
The Data Manipulation Language(DML) provides the user with the com-mands for manipulating records within the sct structure and for storing and fetching data from those records. The DMLconsists of 53 commands which are shown in Figure 4. These commands appear as subroutine calls in the users'
NAME RECORD BASN ITEM BSID ITEM BSNA ITEM E RECORD RIVR ITEM RVID ITEM RVNA RECORD RECH ITEM RCID ITEM RCHN ITEM DIST ITEM DGO ITEM NCON ITEM COO NAME SET ALLB OWNER SYST MEMBER BASN SET RVIB OWNER BASN MEMBER RIVR SET RCRV OWNER RIVR MEMBER RECH SYSTEM V BASN RIVR
I
RECH ALLB RVIB RCRV Figure 2 DDL Exampleprogram. The programming languages which can accommodate these DML calls
include FORTRAN, COBOL, PL/t, and assembly languages. Two examplesof
how the DML would look in a FORTRAN example are shown in Figure 5. These examples assume that the data base has the structure described in Figure 2,and as
can be seen by these examples, the user is required to generate considerable code in order to be able to use the complex data structures. The next section will discuss the GPLAN framework which eliminates this effort from the user, and provides for a query capability [or the data base.
142
TYPE SIZE DEPEND MAX COMMENT
BASIN
INTEG 1 1 BASIN ID
CHAR 20 1 BASIN NAME
REAL 1 1 MEAN ELEVATION
RIVER
INTEG I I RIVER ID
CHAR 20 I RIVER NAME
RIVER REACH
INTEG I I REACH ID
CHAR 20 1 REACH NAME
REAL 1 I LENGTH IN MILES
REAL I I DOGOAL
INTEG I I NUMBER MINERALS
REAL I NCON MINERAL GOALS
ORDER KEY COMMENTS
SORT BSNA ALL BASINS
SYSTEM RECORD
BASIN RECORD
SORT RVNA RIVERS IN BASIN
BASIN RECORD RIVER RECORD
SORT RCHN REACHES IN RIVER
RIVER RECORDS REACH RECORD
SYSTEM COUNTRY STATE
7
SYSTEM INDIANA BLOOMINGTON NEW YORK---- FO WAYNE 1NAPOiIND USA
BLOOMINGTON IND USA
IND USA
USA
Figure 3A Sequential File
CANADA
L_
USA
(
jNEW
YORKFigure 3B Tree Structure
3. GPLAN FRAMEWORK
The Generalized Planning System (GPLAN) framework [6] [71 shown in Figure 1 was designed around the data management system to provide the user
with as much isolation from the data and application programs as possible. The goal of the GPLAN system is to let the system handle the data problems, such as what format the data is in, and let the user concentrate on his goal of analyzing the data. With this in mind, the control program takes the request from the user in the
form of a query, converts this to the appropriate DML and program calls, and generates the desired response. The control program, which uses Artificial
Intelligence techniques [8], has access to a description of all the data in the data base, as well as a description of all functions or programs which operate on this data base. ALBANY CITY
(
INDIANAPOLIS EVANSVILLE SYSTEM SYSTEMI
CITYH
L
SYSlI'M COUNTRY STATEI
Cl 1Yj
IN DIANAFigure 3C Network Structure A. UTILITY COMMANDS
Open Data Base OPEN
Close Data Base CLOS
Dump Tables DUMP
Error Messages ERROR
B. SCHEMA INFORMATION COMMANDS
I) Get Length of Item-Type GLI
Get Length of Record-Type GL.R
Get Names of Item-Types GNI
Get Names of Record-Types GNR
Check Current Member-Type CMT
Check Current Owner-Type COT
C. CREATE AND ADD COMMANDS
Create Record CR
Create Record/Store Data CRS
Add Member to Se AMS
Remove Member from Set RM
Remove Set
D. SEARCH COMMANDS
I) Find First Member FFM
Find Last Member FLM
Find Next Member FNM
Find Previous Member FPM
Find Member Based on Sort Key FMSK
E. DATA MANIPULATION COMMANDS
CURRENT CURRENT CURRENT
KEY MEMBER OWNER RECORD
I) Delete Record DRK DRM DRO DRR
Get Data GETK GETM GETO (.,ETR
Get Field GFK GFM GFO GFR
4)GetKey GKM GKO GKR
5) Get Record Type GTK GTM GTO
Set Field SFK SFM SF0 SFR
Set Current Member SMK SMM SMO SMR
Set Current Owner SOK SOM SOD SOR
Set Current Record SRK SRM SRO
Figure 4 DMLComniands
SYSTEM
)
RK LIST FIND PLOT REGRESS CHANGE ADD DELETE RUN
List the desired data Find the desired data Plot the desired data Regress the desired data Change the desired data Add a new record occurrence Delete a record occurrence
Execute a users' program
C C
C PRINT ALL RIVER NAMES IN BASIN 'WHITE
C
INTEGER DATA (5)
CALL FMSK ('ALLB', 'WHITE', IER) CALL SOM ('ALLB', 'RVIW, IER) CALL FFM ('RVIB', IFR)
0 IF (IER. EQ. - I) GO 10 2(1
CALL GEM ('RVNA', RVIl3'. DATA. IER)
WRITE (6,100) DATA
CALL FNM ('RVIB'. IER)
GOTO to
20 CONTINUE
C
C PRINT RIVER NAMES, REACH NAMES. AND DUO
C FOR ALL REACHES WITh DUO I.F.SS THAN 10
C
INTEGER RVNAM (5), RCNAM (5)
CALL FFM ('ALLB'. IER)
10 IF(IFR. EQ. -1) GO TO 91)
CALL SOM ('ALLB'. RVIB', IER) CALL FFM ('RVIB', IER)
30 IF(IER. EQ.- 1) GO TO 80
CALL SOM ('RVIB', 'RCRV', IER) CALL FFM ('RCRV', IER)
50 IF(IER.EQ.- I) GO TO 70
CALL GFM ('DUO'. 'RCRV', DUO. IER) IF (DGO. GE. 10.0) GO 1060
CAI.I.GFM('RVNA', 'RVIB', RVNAM. IER) CALL GFM ('RCHN'. 'RCRV', RCNAM, IER) WRITE (6,200) RVNAM, RCNAM, DUO 60 CALL FNM ('RCRV', IER) COTO 51) 70 CALLFNM('RVIB'. IER) GO TO 30 80 CALLFNMCALLB'. IER) GOTO to 90 CONTINUE Figure 5 DML Example
The basic query language for the GPLAN framework consists of three parts: (COMMAN DX VARI ABLE clause)(CONDITION clause)
The COMMAND tells the query processor which action is to be taken on the data involved. The commands which are currently implemented include:
The variable clause describes the data items involved in the query and consists of
item-types and the following operators (+,
/,
, sin, cos, log, dc), For example:UST NAME WAGE * HOURS-WORKED
would list each NAME and the value of WAGE times HOURS-WORKED. The condition clause permits the user to selectively retrieve data from the data base. The condition clause includes all the operators in the variable clause plus the logical operators (=,
<, >,
. AND, OR, NOT). The following two example queries would produce the same results as the two examples of DML shown in Figure 5.LIST, RVNA FOR BSNA='WHITE'
LIST RVNA, RCHN, DGO FOR DGO< 10
As can be seen, the query language can eliminate a lot of programming effort
which would normally he invested in writing DML.
As the query language is developed further, the user will become even less
involved with which Data Manipulation programs thatare actually being used to
generate the desired results. When the control program determines that a
particular module is required to answer a question, it will generate the appropriateinput file for that program from the data base. Using this structure, the user will not have to rewrite his existing programs and does not have to learn how to use the DML commands. This also means that if the data base was to he restructured, no
changes would be required for any of the users' program or For the control
program. This restructuring capability is important for the discussion which
follows.Before looking at how the GPLAN system can be useful in large scale
economic data bases, it should be emphasized again that the GPLAN framework is a generalized software structure built around a conventional data management
system for the purposes of minimizing the users' efforts in the area of data
manipulation. It should be noted that for most projects, even the data
manage-ment system would be a substantial improvemanage-ment over the current state of the art
in this area of setting up large scale economic data bases.
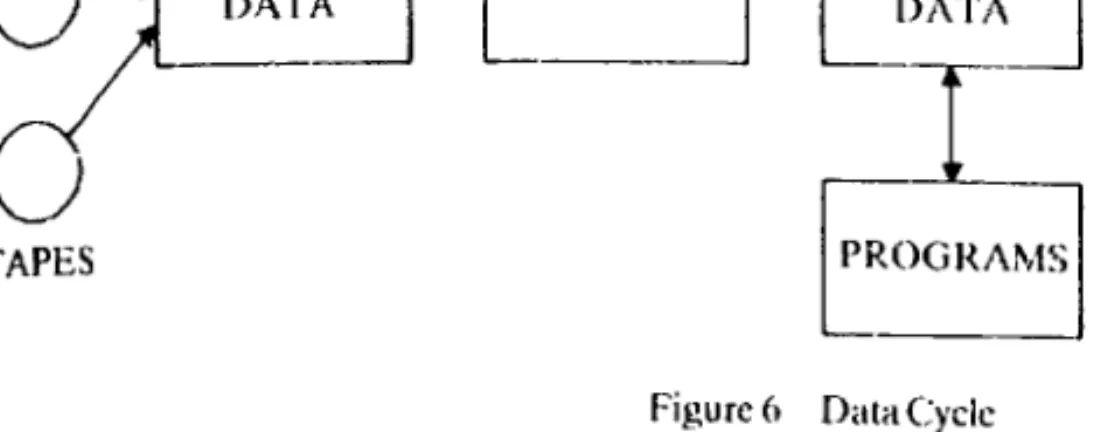
4. DATA CYCLE
The data cycle for a particular economic data study could be viewed as shown in Figure6.The data is initially collected and stored either on cards or most likely on a tape. This data will be referred to as the "raw data," because before this data
can be of benefit to the user, it must go through a Filter system which cleans, verifies, and aggregates the data. Once the data is passed through this filter, it is
considered "clean data" and then can be analyzed by the various programs
involved. After a p'riod of time, the data may become out of date and it is then
passed through another filter to be stored in the archives, which is generally a tape. This information should be saved, since it might have to be reloaded back into the
r
TAPES
RAW
I)ATA
-4
ii I:FFRPROGRAMS
Figure 6 Data Cycte
Before looking at the appropriate data structures for each phase in the data
cycle, some discussion will he devoted to the processes which are involved in the two "filter" boxes. The first filter should perform the following:
Verify existing data using either known hounds, or by comparing
equival-ent data from two sources, or by comparing the data to known relation-ships among other data items.
Replace missing data whenever possible from alternate sources or from some estimation procedure such as regression.
Aggregate data whenever required.
Provide a mapping of this modified "raw data" into the "clean data"
structure.Several studies have been directed towards solving the problems in a, b, and c; for example, see Alter[91,Marsden [1 OJ, and Ruggles [I 1]. In the framework,
we are proposing these "filters" would merely be application programs which
would be executed by the user through the query language. The data management system itself can be used to help detect missing and erroneous data since the user
could specify a range for each data value. The question of a mapping will be performed by the control program, once the two data structures ("raw" and
"clean") are defined. This process will be discussed in more detail in the next section.
The second filter is used to further aggregate the data for storage in the archives. The structure of the archive data should he such that it can easily be
reloaded back into the data base for further studies. The problem of data
verification should be resolved by the time the data is ready for the archives.5. DATA STRUCTURES
With the background of the data management system, the GPLAN structure, and the data cycle, the question to be addressed is how to structure the data base for any given application. The first concept in describing our approach to solving this problem is that since that data management system can support a vast number of data structures, then all phases of the data cycle can be viewed as being in the
same data base. By using this conceptual viewpoint, the control program will 147
pOSSeSS the complete description of all data known to the system in all phases of
the data cycle. The actual device or devices which store the data are not critical
sinceroutines can be wiitteii to access those which arc not readily available in the direct access data base. Each section of the data base or file will be represented by
its Data Description Language which will he stored in the schema for the entire data base.
The second concept is that all routines discussed in the filter section are
viewed as being the same as application programs, and therefore, their description
is stored in the data base along with the various models to he used in the study.
This provides the control program with a complete description of all the programs in the system as well as all the data known to the system. included in this group of
programs would be generalized data manipulation routines such as plotting,
regressions, histograms, and statistics.
The only missing link in this process is the data which results from the various analysis to he performed. It would only seem logical that this data also he stored in
the data base so that it will he available for other future analysis as well as for
storing it in the archives.
The various progranis are viewed by the control program as merely being functions which move data from one section of the data base to another. The
logica! structure for each of these sections of the data base should be determined
by the queries requested by the user, which in turn, requires the use of one or several of the application programs available. Using this conceptual structure, as the GPLAN system currently does, the various sections of the data base will expand and contract dynamically as the requests from the user will change from time to time.
This adaptive type of data structure will be transparent to the user and will provide the maximum amount of flexibility for the control program to schedule
the execution of the various functions while hopefully trying to minimize the use
of resources. As time goes on, and the user adds more and more application
programs to the system, the capabilities of the control program will increase, and the user will he required to perform even less of the remedial data handling tasks.
6. WATER
PolluTioN
EXAMPLEThe GPLAN system is currently being used in the area of water pollution control for the Indiana Stream Pollution Control Board. One of the particular problems solved using this system was the determination of a waste treatment program which would satisfy Section 303 of the 1972 Water Quality Act for the
Grand Calumet River Basin in Indiana. The specific problem required developing
a sewage treatment program which would meet the specified water quality
standards while at the same time requiring the minimal investment in additional facilities. The solution required data from four different sources, and the use of
five models written by the user. The data was collected and stored in a hierarchical
data structure which is similar to the structure shown in Figure 2.
The models developed for the study were the following application pro.
Cost Analysis
DeternhinatJOfl of Rivcr Parameters River Simulation Program
Nonlinear OptimiLation Routine Report Generation
These models were interfaced to the GPLAN system through the control program
so that theycould be requested by the user through the Query Language. The user
also possessed the capability of requesting specific queries of data base as
described in Section 3. This GPLAN framework provided the capability of getting this system up and working with a minimal amount of effort. The generalized data management system also provided the user with considerable data manipulation and editing capability which would most likely he absent from a specific data base.7. Ecor.oiic DATA EXAMPLE
An indepth study, described in Linkage and Retrievalof Microeconomjc Data by David, Gates, and Miller [1] is concerned with data collected for the Wisconsin
Assets and Income Studies (WAIS). The data collected was from the following
sources:
Master Tax Record File
Property income File
Social Security Benefit File Social Security Earnings File
Personal Interview Survey and Assets Diary
Identification File State Tax Pool
The study first presents an excellent discussion of the data, its characteristics, and its structure. The book then takes a look at a specific data structure which involves a linked structure of records. After the data structure is defined, a series of error
detection and correction techniques are discussed as they relate to the specific data structure. Each of the analysis programs which are used with the data base
are designed to handle the specific linked data structure developed by the authors. The last chapter of the study briefly discusses the similarities of their system to a Management Information System.
The real problem with this particular study and with many economic studies was that the authors attempted to mix the design of an information system with the study of economic data. The result was a specialized system which possesses very little flexibility and adaptability to future studies. The work this study provided, as far as the economic study was concerned, was quite contributive, however the data capabilities are fairly primitive when compared to a generalized data managenient system. Many of the programs developed for merging data and for error checking were designed for the specific structure and will be of little use in future studies. This problem could have been avoided had these programs been interfaced with a generalized data management system.
In order to illustrate this point, we can look at one of the
specific data structures discussed in the text. The logical structure as shown in Figure7, is fromINDIVIDUAL K
ER TYPE A:
ID
BIRTH DATE
FTC.
T:ix Record t)ata EE
1951 -ER TYPE B: Annual Earnings Records ER Type C Quarter Earnings
ER Type D. Covered Earning Summary. Integrating Year Record Information
Figure 7 Logicof Tax and Earnings Records Data Structure
page 91 of the text, and is the logical structure of the Tax and Earning Records
data. The study proposed trying to represent this structure by having several
sequential files which would contain pointers in one file which would correspond to a related record in another file. It is not clear from the study how much of this interrelationship by pointers was actually implemented, because of the obvious
difficulty with the required bookkeeping.
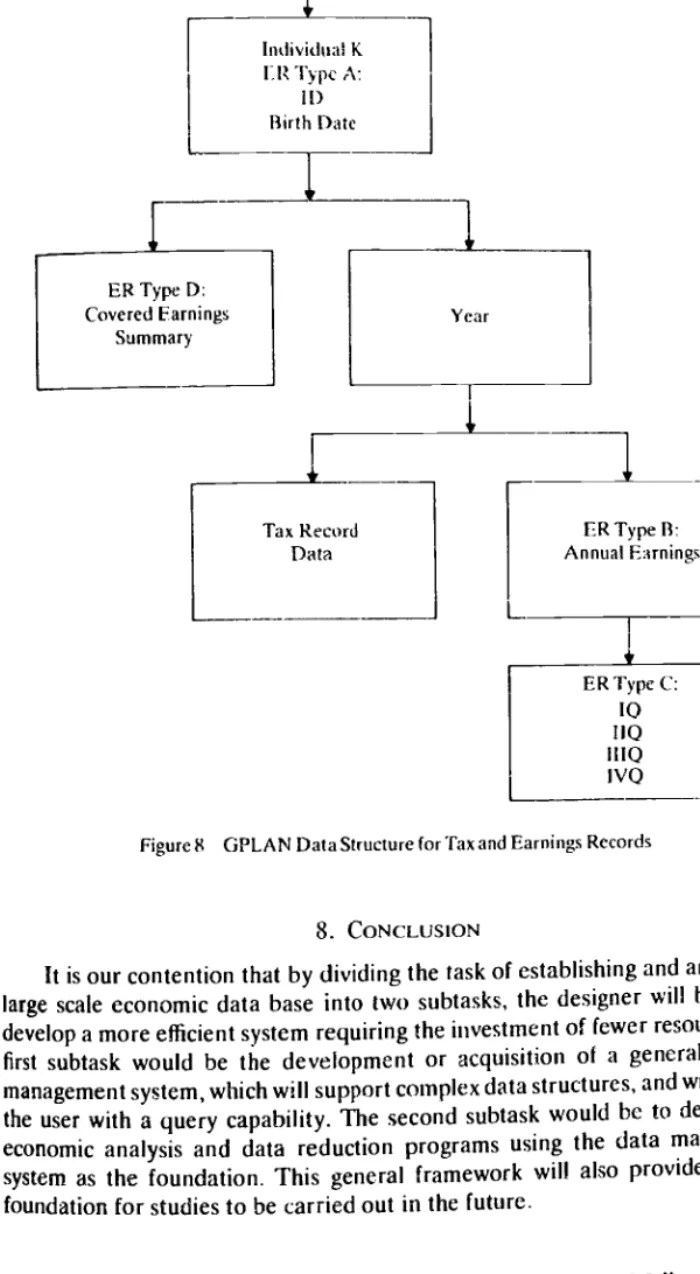
This problem of using pointers to interrelate data could all be handled by a generalized data management system, and the user would not have to keep track of the linkages himself. This particular structure could easily be realized using the GPLAN/DMS with the actual data structure as shown in Figure 8. If each of the other nine files discussed in the study were represented in a logical structure as shown in Figure 8, then the entire data could he stored in one logically consistent data base, and the user would be able to define all the interrelationships which actually existed between all the data. This would also provide greater flexibility for accessing the data for the future economic studies.
1) AssetsRecords
Tax Record Data
1952
ERType B: No Annual Earnings
No Tax Record
1953 110
l)
I- ERType ER Type B: Annual Earnings iitc
ivo
QuarterEarningsER TypeD: Covered Earnings Summary tr lfldiVidtId l( ER i'ypc A: II) Birth Date Tax Record Data
-i
Year ER Type C: I0 110 1110 IvoFigure 8 OPLAN Data Structure for Tax and Earnings Records
8. CONCLUSION
It is our contention that by dividing the task of establishingand analyzing a large scale economic data base into two subtasks, the designerwill be able to develop a more efficient system requiring the investment of fewer resources.The
first subtask would be the development or acquisition of a generalized data
management system, which will support complex data structures, and will provide the user with a query capability. The second subtask would be to develop the
economic analysis and data reduction programs using the data management system as the foundation. This general framework will also provide a strong
foundation for studies to be carried out in the future.
Carnegie -Mellon University Purdue University V
ER Type B: Annual Earnings
B I It I t()( RAPtlY
David, M. If., \V. A. Gates and R. F. Miller, linkage and Retrieval of tshcroeonomic l)ara, Lexington Hooks. 1974.
Rausser. G. C. and R. Howilt. ''Stochastic Control of Environmental Externalities'', i tuilc of Econouiit' and Social Measurements, Spring, 1975.
Uaseman, W. [),, A. Z. Liehernan, J. F. Nunamaker, and A. B. Whiitston, ''Generalizegi Planning Systent/i)a:a Management System (GPLAN/DMS(, Users Manual," Kranncrt Graduate School of Industrial Administration, t)cccinher, 1973.
1-laseman, W. Ii, J. F. Nunariiakcr, and A. B. Whinston, 'The CODASYL 1)11Th ReporI as an Extension to FORTRAN", Management Da,a,ncnics, October, l975.
CODASYL Committee, ThecODASYL DBTGReport, 1972.
Cash, J. 1., R. H. Ilonc7ek, W. D. Haseman, C. W. Holsapple. and A. B. Whinston, "Generalized Planning System/Query System (OS), Users Manual", Krannert Graduate School of industrial Administration.
Bonczck, R. 11., W. D. Ilasenmn, and A. 13. \Whjnstoii, ''Structure of a Query Language for a Network Database", July. 1975.
Flaseman, W. I). and A. B. Whinston, "Problems Solving in 1)ata Management''. Proceedings of Fourth lnte,unzjwia! Joint ('onlereuice on Artificial Intelligence, 'l'bilisi. Gcorgia, USSR. Sep-tember, 1975.
Alter, H. F., "Creation of a Systematic Data Set by 1.inking Records of the ('anadian Survey of Consumer Finances with the Family Expenditures Survey 1970", Annals of Economic and Social Measurement, Vol. 312, 1974.
Marsdcn, J. R., I). F. Pingry, and A. II. Whinston, "large Scale Data Analysis'Fhe ldcntifica tion of Outliers", Krannert Graduate School of Industrial Administration, June, 1974. Ruggles, N. and R., "A Strategy for Merging and Matching Micro.data Sets", Annals o[ Economic and Social Measuremcnt, Vol. 312, 1974.
receivedOctober 1974 revisedSeptember1975