Lajos Juhász
Institute of Corporate Economics Faculty of Economics
NET PRESENT VALUE VERSUS
INTERNAL RATE OF RETURN
University of West Hungarylajosjuhasz@ktk.nyme.hu ABSTRACT. The economic professional literature which deals with investment decisions can be characterised in general that the net present value shows objective picture for the decision maker while the internal rate of return – not even mentioning other „competitors” – have numerous mistakes therefore its expressiveness is limited. The net present value – determined by the minimally expected yield (calculated interest rate) – shows that how amount of wealth growth have been accumulated by the investment during its duration, but it does not inform about the real profitability of capital investment. However the investment’s internal rate of return informs the decision maker that how works the real yield of long capital investment. As every investment economic method, the adaptation of internal rate of return could also have barriers. The barriers usually derive that the method is adapted in such ’model conditions’ where it is impossible to provide reliable information.
This paper analyses that which method gives more relevant information for the manager either of two most often used investment methods.
Received: March, 2011
1st Revision: April, 2011
Accepted: July, 2011
JEL Classification: M21,
G11, G17, D24, D81 Keywordsdecisions, financial forecasting and simulation, production; cost; : business economics, portfolio choice; investment capital, total factor, and multifactor productivity; capacity, criteria for decision-making under risk and uncertainty
Introduction
The results based on the calculations using the net present value and the inner rate of return are often competing in the technical literature of investment-profitability calculations. Decisions are usually made based on excess profits above the rate of return requirements calculated by the net present value principle, especially in cases showing the dominance of financial approach (Brealey-Myers, 1992).
However, in reality – since profitability approaches got priority – the situation is that pieces of information that were calculated based on the inner rate of return or the net present value can be used for making decisions about investments and they complement each other well. The net present value determined by using the calculative rate of interest (capital profit sacrifice cost) – the minimum required yield, the value of which can be derived from the market – shows the amount of the increase in assets that was created by the investment during
Lajos Juhász, Net Present Value Versus Internal Rate of Return, Economics & Sociology, Vol. 4, No 1, 2011, pp. 46-53.
its life – span of use, but does not give any information about the actual profitability of the capital investment.
On the other hand, the inner rate of interest supplies the decision maker with information about the way the real yield of the long-term engrossed capital is created (Illés, 2008).
Like every investment-profitability method, the application of the inner rate of return can also have its limits. However, the limits usually originate from the fact that the method is applied in such model conditions which cannot give any reliable information.
1. Comparison of applied methods
According to the technical literature, the limits mostly occur in three areas (Illés I-né, 2002):
a) The ranking of investment proposals of diverse sizes, excluding each other mutually; b) The evaluation investments that have non-conventional cash-flows;
c) The adjudication of investments excluding each-other mutually and having time-differing structured cash-flows.
We carry out the analysis of problematic areas with the help of numerable data. Example a)
A producer can choose from two investments and there is a significant – two and a half fold – difference between the starting capital investments. The minimum required profit need of the investments is 12%. The useful life-span is 4 years. The first investment version can be realised by a 50 million HUF capital engrossment and results in an average net yield of 21.2 million HUF every year.
The second investment version needs a 125 million HUF capital investment and results in the realisation of an average net yield of 48.3 million HUF every year.
Evaluate the investment variations excluding each-other mutually based on the inner rate of return and the net present value.
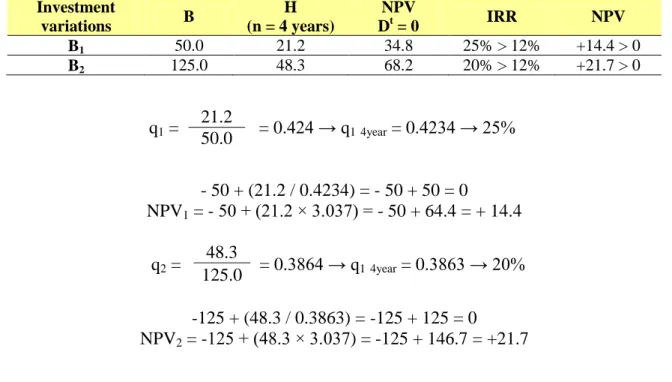
Table 1. Comparisons of investment versions
Unit: million HUF
Investment variations B H (n = 4 years) NPV Dt = 0 IRR NPV B1 50.0 21.2 34.8 25% > 12% +14.4 > 0 B2 125.0 48.3 68.2 20% > 12% +21.7 > 0 q1 = 21.2 = 0.424 → q14year = 0.4234 → 25% 50.0 - 50 + (21.2 / 0.4234) = - 50 + 50 = 0 NPV1 = - 50 + (21.2 × 3.037) = - 50 + 64.4 = + 14.4 q2 = 48.3 = 0.3864 → q14year = 0.3863 → 20% 125.0 -125 + (48.3 / 0.3863) = -125 + 125 = 0 NPV2 = -125 + (48.3 × 3.037) = -125 + 146.7 = +21.7
Both investment variations can be considered profitable based on the inner rate of return as well as based on the net present value. However, it is interesting that the first version is more favourable based on the inner rate of return while the second variation is more favourable based on the net present value. In this case the different results of the two methods can be explained by the significant difference in the cash-flows of the two investment versions (Incidentally we have to note that between the investment versions excluding each other mutually there are hardly any big differences in size in practice so the decision maker rarely faces this problem).
The technical literature suggests in similar cases that we should make a decision based on the absolute value of the net present value since the inner rate of interest is insensitive to the dimension of investments so the relative efficiency (rate) can mislead the investor. Before making a decision, we delineate the values of the NPV and the inner rate of return characteristic for the two investment versions in a frame of reference (Diagram 1).
Diagram 1. Comparisons of investment versions
The Fisher-intersection shows the discount rate in the frame of reference at which the two investment alternatives have a similar consideration based on the sum of the net present values. This is the so-called “neutral discount rate” which is 16.5% in the present case.
In order to see clearly and to make a good decision we have to analyse the net present values of the investment alternatives at discount rates of 12, 16.5 and 19%.
Table 2. Analysis of investment versions in case of diverse rates of discount
Unit: million HUF
Investment alternative NPV (12%) NPV on 1 HUF capital (HUF) NPV (16.5%) NPV (19%) IRR B1 +14.4 0.29 -50+(21.2×2.77049) +8.7 -50+(21.2×2.639) +6.0 25% B2 +21.7 0.17 -125+(48.3×2.77049) +8.8 -125+(48.3×2.639) +2.5 20% NPV (million HUF) 100 75 50 25 10 16,5 20 30 Discount rate(%) Fischer-intersection B1 B2
At4 year , 16.5%= 1 - 1 = 6.06061 – 3.29012 = 2.77049 0.165 0.165(1.165)4 At4 year, 19%= 2.639
We can determine from the results of the calculations that at a calculative rate of interest lower than the “neutral discount rate” determined by the Fischer-intersection investment version B2 shows a higher NPV. This capital demanding topic realises 7.3 million
HUF more excess profit, not because it is more efficient but because its starting capital engrossment is much higher. If we consider the net present value on 1 HUF of capital, version B1 looks more favourable. The average profitability on capital is 5% higher which also shows
an advantage of alternative B1.
The NPV principle considers the two investment alternatives equal in the Fischer-intersection. However, it is obvious that version B1 is more favourable. On the one hand, its
specific NPV is higher; on the other hand, the creation of the same excess profit at a capital engrossment of 40 % lower level is an incomparably better result. In case of a minimum yield need greater than the neutral discount rate (19%) the advantage of version B1 is reflected in
the NPV.
We can draw the conclusion from the above-mentioned data that the absolute value of the net present value can be misleading in making economic decisions. On the one hand, it is because the NPV cannot be independent from the value of the capital engrossment – the comparison of the investment variations is impossible without a common denominator, on the other hand, the amount of the excess profit created is undeterminable without the knowledge of the useful life-span.
In summary we can say that we should not make investment decisions based on the absolute value of the net present value suggested widely in the technical literature but we should take into consideration the tendencies happening in the economic environment, the relations of the neutral discount rate and the calculative rate of interest, the entrepreneurial and bank requirements about profitability and the value of the capital engrossment and its duration.
Example b)
We know from the relevant professional literature that the results of dynamic investment-profitability calculations are not reliable in the case of non-typical, that is not conventional, cash-flows.
In the case of a typical investment there is only one internal rate of interest. If the cash-flows change signs several times during the useful life-span of the investment, more IRR values are created while the NPV is zero. This problem makes the work of the decision making financial expert more difficult since the known IRR values cannot be compared with the profit need of the company in many cases. Some experts suggest using the net present value principle to solve this problem.
The starting cash-flow of an investment is 1.6 million HUF. We can calculate with 10 million HUF net yields in the first year and with -10 million HUF net yields in the second year. Can an investment that gives a huge yield in the long run but causes great costs in a longer time period be acceptable from an economic perspective? (The calculative rate of interest of the business enterprise is 20%).
10
- 10 = 1.6 / x2 1 + IRR = x IRR = x - 1 x x2
10 x – 10 = 1.6x2 1.6x2 – 10x + 10 = 0 x1 = 10+6 = 5 → 400% 3.2 x1,2 = 10+ √ 100-64 = 10+√ 36 3.2 3.2 x2 = 10-6 = 1.25 → 25% 3.2
From an economic perspective, the rate of 400 % is unreal. However, an IRR value of 25% is imaginable. NPV400 = - 1.6 + 10 - 10 = -1.6 + 2 – 0.4 = 0 5 25 NPV25 = - 1.6 + 10 - 10 = -1.6 + 8 – 6.4 = 0 1.25 1.5625
At the inner rates of return (25%, 400%) the NPV turned out to be zero.
Calculate the NPV at average risk rate with the help of the calculative rate of interest.
NPV20 = -1.6 +
10
- 10 = -1.6 + 8.3 – 6.9= - 0.2 M Ft 1.20 1.44
Calculate the NPV in the case of a very risky capital engrossment if the calculative rate of interest is 30%.
NPV30 = -1.6 +
10
- 10 = -1.6 + 7.7 – 5.9 = + 0.2 M Ft 1.3 1.69
We get a very surprising net present value at the given calculative rates of interest. At a calculated asset need of 20% including the smaller risk offset, according to the net present value principle, the investment has to be rejected since the NPV is negative.
If we can engross our capital permanently at a very high risk rate – the calculative rate of interest is 30%, the NPV is positive so the investment can be considered profitable. It is not hard to see reason that the above-mentioned investment must not be realised at a calculative rate of interest of 30%. We can establish, using the data we got, that neither the inner rate of return nor the net present value calculations help the economic discernment in case of non-typical investments.
Example c)
From the aspect of investment-profitability calculations the situation in which the investments excluding each other mutually can be characterised by significantly different structures of cash-flow in time can be seen as a problematic area. According to the suggestions in the technical literature we have to make investment decisions using the net present value principle.
An entrepreneur has to choose from two investment alternatives. The investments concerned exclude each other mutually but have significantly diverse structures of cash-flow in time. The calculative rate of interest is 12%.
Table 3. Cash flows of investment versions
Unit: thousand HUF
Years B1 B2 0 -25,000 -25,000 1 18,000 1,500 2 13,000 2,540 3 3,000 15,500 4 1,815 27,000
Which investment variation should the entrepreneur realise? Make your decision based on the NPV and the IRR values.
By way of introduction, we have to mention that in the case of investments carried out for the same reason, it is very rare that an investor should face two cash-flows moving in the opposite direction in their tendencies. The above-mentioned case will hardly ever happen in practice so it only has a theoretical importance.
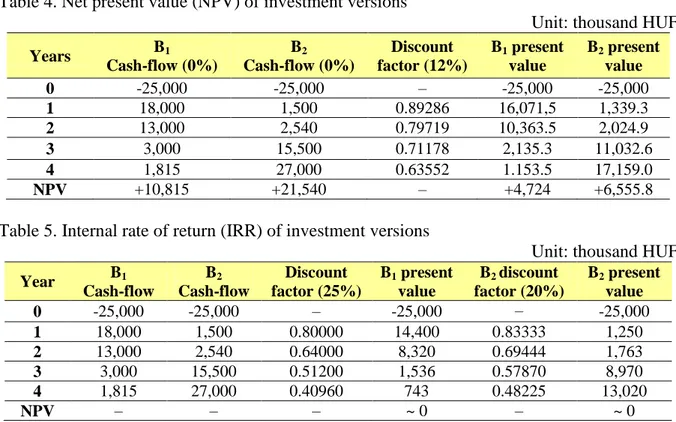
Table 4. Net present value (NPV) of investment versions
Unit: thousand HUF
Years B1 Cash-flow (0%) B2 Cash-flow (0%) Discount factor (12%) B1 present value B2 present value 0 -25,000 -25,000 – -25,000 -25,000 1 18,000 1,500 0.89286 16,071,5 1,339.3 2 13,000 2,540 0.79719 10,363.5 2,024.9 3 3,000 15,500 0.71178 2,135.3 11,032.6 4 1,815 27,000 0.63552 1.153.5 17,159.0 NPV +10,815 +21,540 – +4,724 +6,555.8
Table 5. Internal rate of return (IRR) of investment versions
Unit: thousand HUF
Year B1 Cash-flow B2 Cash-flow Discount factor (25%) B1 present value B2 discount factor (20%) B2 present value 0 -25,000 -25,000 – -25,000 – -25,000 1 18,000 1,500 0.80000 14,400 0.83333 1,250 2 13,000 2,540 0.64000 8,320 0.69444 1,763 3 3,000 15,500 0.51200 1,536 0.57870 8,970 4 1,815 27,000 0.40960 743 0.48225 13,020 NPV – – – ~ 0 – ~ 0
As we can see from the results, version B2 can be considered more favourable based
on the NPV while version B1 is more favourable based on the inner rate of return (Tables 4
and 5).
In order to compare the two versions, let us analyse the value of the “neutral discount rate”.
Diagram 2. NPV and IRR values of investment versions
The Fischer-intersection shows that at a discount rate of approximately 17% the two investment versions produce a nearly equal net present value.
Table 6. Comparing the results of investment versions
Investment versions NPV (thousand HUF) (12%) NPV on 1 HUF capital (HUF) NPV (thousand HUF) (17%) IRR B1 +4,724.0 0.19 +2.73 25% B2 +6,555.8 0.26 +2.23 20%
If the calculative rate of interest of 12% reflects the offset of the risks in connection with the investment very well, the realisation of version B2 in more feasible since the net
yields created during usage mean greater asset increase and their re-engrossment at 12% can be provided with great certainty.
If the risk of investment is growing because of the economic environment – this, of course, comes along with the increase in the value of the calculative rate of interest, we have to prefer version B1 since the back-flow and the re-engrossment of the greater net yields near
the date of activation is more favourable, even at a yield rate above the calculative rate of interest.
Conclusions
The main conclusions that can be drawn after the analysis of the above-mentioned problematic areas:
The results of the decision made based on the absolute amount of NPV can differ according to the values of the calculative rate of interest.
The decision made based on the NPV can be misleading because, on the one hand, the net present value cannot be independent from the value of the capital engrossment; on 10 17 20 30 Discount rate (%) Fischer-intersection B1 B2 NPV (million HUF) 25 20 15 10 5
the other hand, the excess profit above the rate of return need cannot be interpreted without taking the useful life-span into consideration.
The determination of the so-called “neutral discount rate” is inevitable in order to make a relevant decision.
In summary we can determine that the investment-profitability decisions need the knowledge of the NPV expressing the measure of asset growth during the useful life-span as well as the knowledge of the IRR value reflecting profitability on capital. The two pieces of information together guarantee the making of relevant decisions.
References
Brealey-Myers (1992), Modern vállalati pénzügyek 1 (Modern Corporate Finance 1). Panem Kft., Budapest.
Illés I-né (2002), Társaságok pénzügyei (Finances of Companies), Saldo, Budapest. Chikán, A. (2008), Vállalatgazdaságtan (Company Economics), Aula Kiadó, Budapest. Illés, M. (2008), Vezetői gazdaságtan (Managerial Economics), Kossuth Kiadó, Budapest.