______________________________________________________________________
January 13, 2021
The Honorable Gavin Newsom
Governor, State of California
State Capitol
Sacramento, CA 95814
Dear Governor Newsom:
In response to your August 17, 2020 letter, the California Independent System Operator
(CAISO), California Public Utilities Commission (CPUC), and California Energy
Commission (CEC) are pleased to provide you the attached Final Root Cause Analysis
(Final Analysis) of the two rotating outages in the CAISO footprint on August 14 and 15,
2020. This Final Analysis builds on the Preliminary Root Cause Analysis report
published on October 6, 2020 and provides updates on the progress made on a number
of the recommendations identified in the preliminary analysis. It also incorporates data
that was not available when the preliminary analysis was developed, information from
the Labor Day weekend heat wave and updated analysis of resource performance.
We recognize our shared responsibility for the power outages many Californians
unnecessarily endured. The findings of the Final Analysis underscore this shared
responsibility and give greater definition to actions that can be taken to avoid or
minimize the impacts to those we serve.
The Final Analysis confirms there was no single root cause of the August outages, but
rather, finds that the three major causal factors contributing to the outages were related
to extreme weather conditions, resource adequacy and planning processes, and market
practices. Although this combination of factors led to an extraordinary situation, our
responsibility and commitment going forward is to be better prepared for extreme
climate change-induced weather events and other operational challenges facing our
evolving power system.
The Final Analysis provides recommendations for immediate, near and longer-term
improvements to our resource planning, procurement, and market practices, many of
which are underway. These actions are intended to ensure that California’s transition to
a reliable, clean, and affordable energy system is sustained and accelerated. This is an
imperative – for our citizens, communities, economy, and environment. Implementation
of these recommendations will involve processes within state agencies and the CAISO,
partnership with the state Legislature, and collaboration and input from stakeholders
within California and across the western United States.
The Honorable Gavin Newsom January 13, 2021
Page 2 of 2
This Final Analysis has served as an important step in learning from the events of
August 14 and 15, as well as a clear reminder of the importance of effective
communication and coordination.
We remain committed to meeting California’s clean energy and climate goals and value
your personal engagement on these issues and your unequivocal commitment and
leadership on addressing climate change.
Regards,
Elliot Mainzer
President and Chief Executive Officer
California Independent System Operator
Marybel Batjer
President
California Public Utilities Commission
David Hochschild
Chair
i
Table of Contents
Executive Summary ... 1
ES.1 Current Actions to Prepare for Summer 2021 ... 1
ES.2 Three Major Factors that Led to Rotating Outages ... 3
ES.3 Summary of Performance of Different Types of Resources ... 5
ES.4 Analyses Conducted Since the Preliminary Analysis ... 7
ES.5 Conclusion ... 8
1 Introduction ... 9
2 Background ... 10
2.1 Resource Adequacy Process in the CAISO BAA... 10
2.2 CEC’s Role in Forecasting and Allocating Resource Adequacy Obligations 12 2.3 CPUC’s Role in Allocating RA Obligations to Jurisdictional LSEs ... 14
2.3.1 Timeline for RA Process, Obligations, and Penalties ... 15
2.4 CAISO’s Role in Ensuring RA Capacity is Operational ... 17
3 Mid-August Event Overview ... 19
3.1 Weather and Demand Conditions During Mid-August ... 19
3.2 CAISO Reliability Requirements and Communications During mid-August Event 22 3.3 Sequence of Events of CAISO Actions ... 26
3.3.1 Before August 14 ... 26
3.3.2 August 14 ... 26
3.3.3 August 15 ... 29
3.3.4 August 16 through 19 ... 32
3.4 Number of Customers Affected by Rotating Outages ... 34
3.5 September 6 and 7 ... 36
4 Understanding of Various Factors That Contributed to Rotating Outages on August 14 and 15 ... 38
4.1 The Climate Change-Induced Extreme Heat Wave Across the Western United States Resulted in Demand for Electricity Exceeding Existing Electricity Resource Adequacy (RA) and Planning Targets ... 39
ii
4.2 In Transitioning to a Reliable, Clean, and Affordable Resource Mix, Resource Planning Targets Have Not Kept Pace to Ensure Sufficient Resources That Can Be Relied Upon to Meet Demand in the Early Evening Hours. This Made
Balancing Demand and Supply More Challenging During the Extreme Heat Wave .. 40
4.2.1 Planning Reserve Margin Was Exceeded on August 14 ... 42
4.2.2 Critical Grid Needs Extend Beyond the Peak Hour ... 43
4.2.3 Supply, Market Awards, and Actual Energy Production by Resource Type 45 4.2.3.1 Natural Gas Fleet ... 47
4.2.3.2 Imports ... 48
4.2.3.3 Hydro ... 49
4.2.3.4 Solar and Wind ... 49
4.2.3.5 Demand response... 50
4.2.3.6 Combined Resources ... 57
4.3 Some Practices in the Day-Ahead Energy Market Exacerbated the Supply Challenges Under Highly Stressed Conditions ... 61
4.3.1 Demand Should Be Appropriately Scheduled in the Day-Ahead Time frame 61 4.3.2 Convergence Bidding Masked Tight Supply Conditions ... 62
4.3.3 Residual Unit Commitment Process Changes Were Needed ... 63
5 Actions Taken During August 16 Through 19 to Mitigate Projected Supply Shortfalls 65 5.1 Detailed Description of Actions Taken ... 66
5.1.1 Awareness Campaign and Appeal for Conservation ... 66
5.1.2 Demand Reduction Actions ... 67
5.1.3 Increase Access to Supply-Side Resources... 68
5.1.4 CAISO Market Actions ... 69
6 Recommendations ... 70
Appendix A: CEC Load Forecasts for Summer 2020 ... 76
Appendix B: Technical Discussion on Supply Conditions Based on Current Resource Planning Targets and Energy Market Practices ... 80
B.2 Detailed Analysis on Supply Conditions Based on Current Resource Planning Targets ... 81
B.2.1 Planning Reserve Margin ... 83
iii
B.2.3 Overview of Supply and RA Resources Shown to the CAISO ... 86
B.2.3.1 Supply-Side RA Shown Capacity, Bids, Awards, and Energy Production 90 B.2.3.2 Demand Response Analysis for Credits and Shown RA ... 100
B.2.3.3 Combined Resources ... 109
B.3 Energy Market Practices Exacerbated the Supply Challenges Under Highly Stressed Conditions ... 113
B.3.1 Demand Should Be Appropriately Scheduled in the Day-Ahead Time frame 113 B.3.2 Convergence Bidding Masked Tight Supply Conditions ... 124
B.3.3 Residual Unit Commitment Process Changes ... 128
B.3.4 Energy Imbalance Market ... 130
List of Tables
Table 2.1: RA 2020 LSE Forecast Timeline ... 14Table 3.1: CPUC-Jurisdictional Customers Affected by August 14 Rotating Outages ... 35
Table 3.2: CPUC Jurisdictional Customers Affected by August 15 Rotating Outages ... 35
Table 4.1: August 2020 RA Obligation, Shown RA, RMR, and Credits ... 41
Table 4.2: August and September 2020 Demand Response Credits and Shown RA ... 51
Table 4.3: Comparison of Demand Response Performance During August Stage 3 Events ... 56
Table 4.4: Comparison of Under- and Over-Scheduling of Load on August 14 and 15 (Under-Scheduling Reflected as Negative Number) ... 62
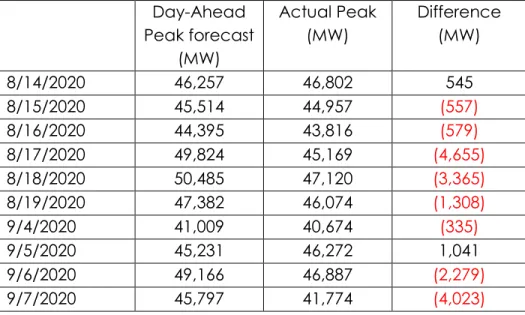
Table 5.1: Day-Ahead Peak Forecast vs. Actual Peak During Heat Event (Updated) ... 66
Table A.1: Summary of 2020 LSE RA Forecasts ... 76
Table A.2: LSEs in the CAISO Footprint – Summer 2020 ... 77
Table B.1: August 2020 RA Obligation, Shown RA, RMR, and Credits ... 82
Table B.2: August and September 2020 Demand Response Credited and Shown RA . 101 Table B.3: Comparison of Demand Response Performance During August Stage 3 Events ... 108
Table B.4: Comparison of Under- and Over-Scheduling of Load on August 14 and 15 (Under-Scheduling Reflected as Negative Number) ... 118
iv
List of Figures
Figure ES.1: July, August, and September Temperatures 1985 - 2020 ... 4
Figure 3.1: National Weather Service Sacramento Graphic for August 14 ... 19
Figure 3.2: National Weather Service Weather Prediction Center Graphic for August 15 ... 20
Figure 3.3: National Weather Service Weather Prediction Center Graphic for August 18 ... 21
Figure 3.4: 2017 -2019 Summer Net Imports at Time of Daily Peaks Above 41,000 MW .... 22
Figure 3.5: Wind and Solar Generation Profiles for August 14 and 15 ... 31
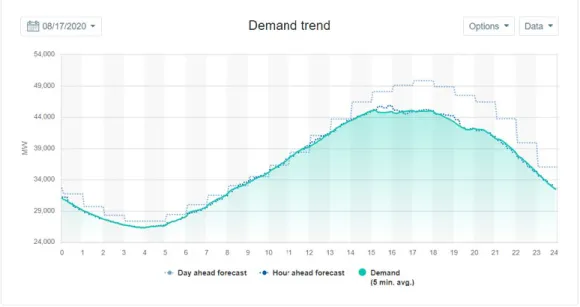
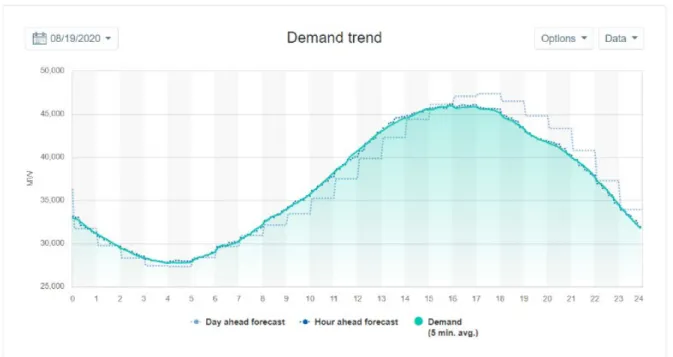
Figure 3.6: Comparison of Day-Ahead Forecast and Actual Demand for August 17 ... 33
Figure 3.7: Comparison of Day-Ahead Forecast and Actual Demand for August 18 ... 33
Figure 3.8: Comparison of Day-Ahead Forecast and Actual Demand for August 19 ... 34
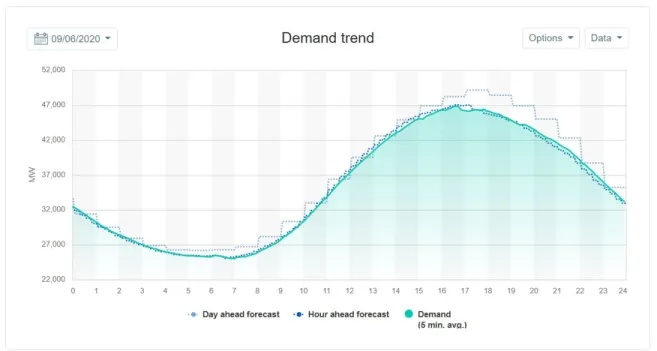
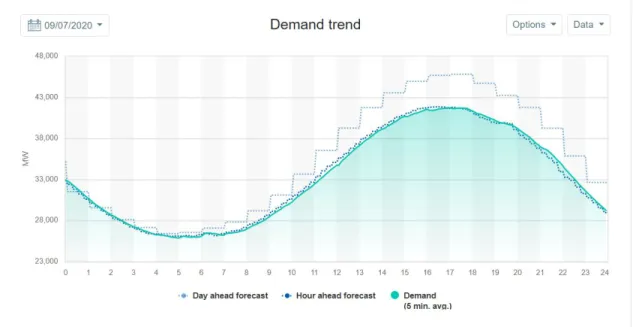
Figure 3.9: Comparison of Day-Ahead Forecast and Actual Demand for September 6 36 Figure 3.10: Comparison of Day-Ahead Forecast and Actual Demand for September 7 ... 37
Figure 4.1: July, August, and September Temperatures 1985 - 2020 ... 39
Figure 4.2: August 2020 PRM and Actual Operational Need During Peak (Updated) ... 43
Figure 4.3: Demand and Net Demand for August 14 and 15 ... 45
Figure 4.4: August 14 Net Demand Peak (6:51 p.m.) August 2020 Shown RA and RMR, Real-time Awards, and Actual Energy Production (corrected) ... 46
Figure 4.5: Credited IOU Reliability Demand Response Resource Real-Time Availability, Dispatch, and Performance ... 52
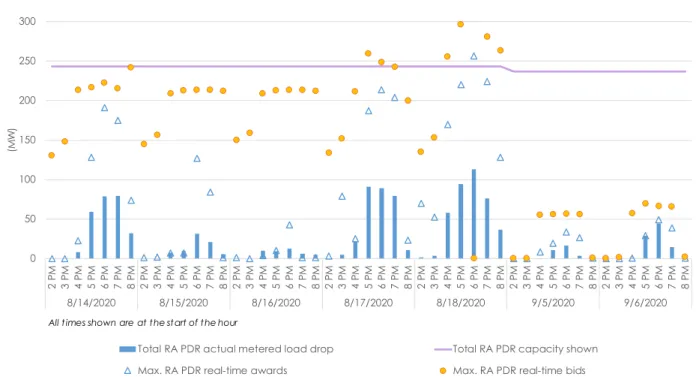
Figure 4.6: Credited IOU and Non-IOU Proxy Demand Response Day-Ahead Bids and Awards ... 53
Figure 4.7: Credited IOU and Non-IOU Proxy Demand Response Real-Time Bids, Awards, and Performance ... 54
Figure 4.8: Non-IOU Proxy Demand Response Shown as RA Day-Ahead Bids and Awards ... 54
Figure 4.9: Non-IOU Proxy Demand Response Shown as RA Real-Time Bids, Awards, and Performance ... 55
Figure 4.10: August 2020 Shown RA and RMR Allocation vs. August 14 and 15 Actual Energy Production (Assumes All Wind and Solar Counts as RA Capacity) ... 58
Figure 4.11: August 14 Illustrative Battery Storage Performance ... 60
Figure 4.12: August 15 Illustrative Battery Storage Performance ... 60
Figure 4.13: Net Imports During August 13-15 ... 64
Figure B.1: August 2020 PRM and Actual Operational Need During Peak (Updated)... 84
Figure B.2: Demand and Net Demand for August 14 and 15 ... 86
Figure B.3: RA Outage Snapshot for August 14 and 15 ... 87
v
Figure B.5: August 14 Net Demand Peak (6:51 p.m.) Unused RA Capacity by Resource Type ... 89 Figure B.6: August 15 Peak (5:37 p.m.) Unused RA Capacity by Resource Type ... 89 Figure B.7: August 15 Net Demand Peak (6:26 p.m.) Unused RA Capacity by Resource Type ... 90 Figure B.8: August 14 Peak (4:56 p.m.) – Day-Ahead Bids vs. August 2020 Shown RA and RMR ... 92 Figure B.9: August 14 Net Load Peak (6:51 p.m.) – Day-Ahead Bids vs. August 2020 Shown RA and RMR ... 93 Figure B.10: August 15 Peak (5:37 p.m.) – Day-Ahead Bids vs. August 2020 Shown RA and RMR ... 93 Figure B.11: August 15 Net Demand Peak (6:26 p.m.) – Day-Ahead Bids vs. August 2020 Shown RA and RMR ... 94 Figure B.12: August 14 Peak (4:56 p.m.) – Day-Ahead Awards vs. August 2020 Shown RA and RMR ... 95 Figure B.13: August 14 Net Demand Peak (6:51 p.m.) – Day-Ahead Awards vs. August 2020 Shown RA and RMR ... 95 Figure B.14: August 15 Peak (5:37 p.m.) – Day-Ahead Awards vs. August 2020 Shown RA and RMR ... 96 Figure B.15: August 15 Net Demand Peak (6:26 p.m.) – Day-Ahead Awards vs. August 2020 Shown RA and RMR ... 96 Figure B.16: August 14 Peak (4:56 p.m.) – Real-Time Awards and Actual Energy
Production vs. August 2020 Shown RA and RMR (Updated) ... 98 Figure B.17: August 14 Net Demand Peak (6:51 p.m.) – Real-Time Awards and Actual Energy Production vs. August 2020 Shown RA and RMR (Updated) ... 98 Figure B.18: August 15 Peak (5:37 p.m.) – Real-Time Awards and Actual Energy
Production vs. August 2020 Shown RA and RMR (Updated) ... 99 Figure B.19: August 15 Net Demand Peak (6:26 p.m.) – Real-Time Awards and Actual Energy Production vs. August 2020 Shown RA and RMR (Updated) ... 99 Figure B.20: Credited IOU Reliability Demand Response Resource Day-Ahead Bids and Awards ... 102 Figure B.21: Credited IOU Reliability Demand Response Resource Real-Time Availability, Dispatch, and Performance ... 103 Figure B.22: Credited IOU and Non-IOU Proxy Demand Response Day-Ahead Bids and Awards ... 105 Figure B.23: Credited IOU and Non-IOU Proxy Demand Response Real-Time Bids,
Awards, and Performance ... 106 Figure B.24: Non-IOU Proxy Demand Response Shown as RA Day-Ahead Bids and
Awards ... 106 Figure B.25: Non-IOU Proxy Demand Response Shown as RA Real-Time Bids, Awards, and Performance ... 107
vi
Figure B.26: August 2020 Shown RA and RMR Capacity vs. August 14 and 15 Actual
Energy Production (Assumes all Wind and Solar Counts as RA Supply) ... 110
Figure B.27: August 14 Illustrative Battery Storage Performance ... 112
Figure B.28: August 15 Illustrative Battery Storage Performance ... 112
Figure B.29: Day-Ahead Under- and Over-Scheduling by CPUC-Jurisdictional IOUs, CCAs, and ESPs (MW) ... 115
Figure B.30: Day-Ahead Under- and Over-Scheduling by Non-CPUC-Jurisdictional and Other Load Serving Entities (MW) ... 115
Figure B.31: Day-Ahead Under- and Over-Scheduling for CAISO Footprint (MW)... 116
Figure B.32: Day-Ahead Under- and Over-Scheduling by CPUC-Jurisdictional IOUs, CCAs, and ESPs (as % of actual) ... 117
Figure B.33: Day-Ahead Under- and Over-Scheduling by Non-CPUC-Jurisdictional and Other Load Serving Entities (as % of actual) ... 117
Figure B.34: Day-Ahead Under- and Over-Scheduling for CAISO Footprint (as % of actual) ... 118
Figure B.35: Comparison of Day-Ahead Non-RA Cleared Supply vs. Total Day-Ahead Scheduled Exports ... 121
Figure B.36: Total Day-Ahead Scheduled Exports by Category ... 122
Figure B.37: Day-Ahead and Real-Time Imports and Exports During August 13-15... 123
Figure B.38: Net Imports During August 13-15 ... 124
Figure B.39: Illustrative Example of Impact of Under-Scheduled Load Under Supply Scarcity ... 125
Figure B.40: Illustrative Example of Impact of Under-Scheduled Load Under Supply Sufficiency ... 126
Figure B.41: Illustrative Example of Impact of Convergence Bidding ... 127
Figure B.42: CAISO EIM Real-Time Transfers as Compared to Flexible Ramping Sufficiency Cap... 131
vii
GLOSSARY OF ACRONYMS
ACRONYM DEFINITION
AAEE Additional Achievable Energy Efficiency
AB Assembly Bill
A/S Ancillary Services
AWE Alerts, Warnings, and Emergencies
BA Balancing Authority
BAA Balancing Authority Area
BPM Business Practice Manual
CAISO California Independent System Operator Corporation
CARB California Air Resources Board
CCA Community Choice Aggregator
CDWR California Department of Water and Power
CEC California Energy Commission
CHP Combined Heat and Power
COI California Oregon Intertie
CPM Capacity Procurement Mechanism
CPUC California Public Utilities Commission DMM CAISO Department of Market Monitoring
EIM Energy Imbalance Market
ELCC Effective Load Carrying Capability
ESP Energy Service Provider
FERC Federal Energy Regulatory Commission
GHG Greenhouse Gas
HASP Hour-Ahead Scheduling Process
IEPR Integrated Energy Policy Report
IFM Integrated Forward Market
IOU Investor Owned Utility
IRP Integrated Resource Planning
JASC Joint Agency Steering Committee
LADWP Los Angeles Department of Water and Power
LMS Load Management Standards
LOLE Loss of Load Expectation
LRA Local Regulatory Authority
LSE Load Serving Entity
MW Megawatt
MWD Metropolitan Water District
NCPA Northern California Power Agency
viii
ACRONYM DEFINITION
NOB Nevada Oregon Border
NQC Net Qualifying Capacity
NWS National Weather Service
PDCI Pacific DC Intertie
PDR Proxy Demand Resource
PGE Portland General Electric
PG&E Pacific Gas and Electric
PIME Price Inconsistency Market Enhancements
POU Publicly Owned Utility
PRM Planning Reserve Margin
QC Qualifying Capacity
RA Resource Adequacy
RAAIM Resource Adequacy Availability Incentive Mechanism RDRR Reliability Demand Response Resource
RMO Restricted Maintenance Operations
RMR Reliability Must Run
RUC Residual Unit Commitment
SB Senate Bill
SCE Southern California Edison
SDG&E San Diego Gas & Electric SMUD Sacramento Municipal Utility District
TAC Transmission Access Charge
TOU Time of Use
WAPA Western Area Power Administration
1
Executive Summary
On August 14 and 15, 2020, the California Independent System Operator Corporation (CAISO) was forced to institute rotating electricity outages in California in the midst of a West-wide extreme heat wave. Following these emergency events, Governor Gavin Newsom requested that, after taking actions to minimize further outages, the CAISO, the California Public Utilities Commission (CPUC), and the California Energy Commission (CEC) report on the root causes of the events leading to the August outages.
The CAISO, CPUC, and CEC produced a Preliminary Root Cause Analysis (Preliminary Analysis) on October 6, 2020, and have since continued their analysis to confirm and supplement their findings. This Final Root Cause Analysis (Final Analysis) incorporates additional data analyses that were not available when the Preliminary Analysis was published, but does not substantively change earlier findings and confirms that the three major causal factors contributing to the August outages were related to extreme weather conditions, resource adequacy and planning processes, and market
practices. In summary, these factors were the following:
1. The climate change-induced extreme heat wave across the western United States resulted in demand for electricity exceeding existing electricity resource adequacy (RA) and planning targets.
2. In transitioning to a reliable, clean, and affordable resource mix, resource planning targets have not kept pace to ensure sufficient resources that can be relied upon to meet demand in the early evening hours. This made balancing demand and supply more challenging during the extreme heat wave.
3. Some practices in the day-ahead energy market exacerbated the supply challenges under highly stressed conditions.
Although August 14 and 15 are the primary focus of this Final Analysis because the rotating outages occurred during those days, August 17 through 19 were projected to have much higher supply shortfalls. If not for the leadership of the Governor’s office to mobilize a statewide mitigation effort and significant consumer conservation, California was also at risk of further rotating outages on those days.
ES.1 Current Actions to Prepare for Summer 2021
The CAISO, CPUC, and CEC have already taken several actions and are continuing their efforts to prepare California for extreme heat waves next summer without having to resort to rotating outages. These actions include the following:
2
1) The CPUC opened an Emergency Reliability rulemaking (R.20-11-003) to procure additional resources to meet California’s electricity demand in summer 2021. Through this proceeding, the CPUC has already directed the state’s three large investor-owned utilities to seek contracts for additional supply-side capacity and has requested proposals for additional demand-side resources that can be available during the net demand peak period (i.e., the hours past the gross peak when solar production is very low or zero) for summer 2021 and summer 2022. The CPUC and parties to the proceeding, including the CAISO, will continue to evaluate proposals and procurement targets for both supply-side and demand-side resources.
2) The CAISO is continuing to perform analysis supporting an increase to the CPUC’s RA program procurement targets. Based on the analysis to date, the CAISO recommends that the targets apply to both the gross peak and the critical hour of the net demand peak period during the months of June through October 2021.
3) The CAISO is expediting a stakeholder process to consider market rule and practice changes by June 2021 that will ensure the CAISO’s market
mechanisms accurately reflect the actual balance of supply and demand during stressed operating conditions. This initiative will consider changes that incentivize accurate scheduling in the day-ahead market, appropriate prioritization of export schedules, and evaluate performance incentives and penalties for the RA fleet. The CAISO is also working with stakeholders to ensure the efficient and reliable operation of battery storage resources given the significant amount of new storage that will be on the system next summer and beyond. Through a stakeholder process, the CAISO will pursue changes to its planned outage rules.
4) The CPUC is tracking progress on generation and battery storage projects that are currently under construction in California to ensure there are no CPUC-related regulatory barriers that would prevent them from being completed by their targeted online dates. The CAISO will continue to work with developers to address interconnection issues as they arise.
5) The CAISO and CEC will coordinate with non-CPUC-jurisdictional entities to encourage additional necessary procurement by such entities.
6) The CEC is conducting probabilistic studies that evaluate the loss of load expectation on the California system to determine the amount of capacity that needs to be installed to meet the desired service reliability targets. 7) The CAISO, CPUC, and CEC are planning to enhance the efficacy of Flex
Alerts to maximize consumer conservation and other demand side efforts during extreme heat events.
3
8) Preparations by the CAISO, CPUC, and CEC are underway to improve
advance coordination for contingencies, including communication protocols and development of a contingency plan. The contingency plan will draw from actions taken statewide under the leadership of the Governor's Office to mitigate the anticipated shortfall from August 17 through 19, 2020.
In the mid-term, for 2022 through 2025, the CAISO, CPUC, and CEC will continue to work toward: (1) planning and operational improvements for the performance of different resource types (such as batteries, imports, demand response, and so forth); (2)
improvements to accelerate the deployment and integration of demand side
resources; and (3) consideration of generation and transmission buildouts to evaluate options and constraints under the SB 100 scenarios. This planning will also account for the pending retirements of some existing natural gas units and the Diablo Canyon nuclear power plant.
For the longer term, 2025 and beyond, the CAISO, CPUC, and CEC are working closely together and with other regional stakeholders to establish a modernized, integrated approach to forecasting, resource planning and RA targets. The enhanced
collaboration and alignment are to more fully anticipate events like last summer’s climate change-induced extreme heat wave and better plan and account for the transitioning electricity resource mix necessary to meet clean energy goals. This is a statewide concern that requires assessing resource sufficiency and reliability for all of California. As such, building on the CEC’s statewide statutory responsibilities, the CAISO, CPUC, and CEC will define and develop necessary assessments as part of the
Integrated Energy Policy Report (IEPR), to create improved understanding into statewide, and WECC-wide resource sufficiency.
To provide complete transparency into the various summer 2021 preparedness efforts underway, the CAISO, CPUC, and CEC will continue to report monthly to the California State Legislature as requested by the Chair of the Assembly Committee on Utilities and Energy, Chris Holden. In addition, the CAISO is holding monthly open stakeholder calls to discuss progress toward ensuring its readiness for next summer’s high heat events. Information and updates on these efforts can be found at:
http://www.caiso.com/about/Pages/News/SummerReadiness.aspx
https://www.cpuc.ca.gov/summerreadiness/
ES.2 Three Major Factors that Led to Rotating Outages
1. The climate change-induced extreme heat wave across the western United States resulted in demand for electricity exceeding existing electricity resource adequacy (RA) and planning targets
4
Taking into account 35 years of weather data, the extreme heat wave experienced in August was a 1-in-30 year weather event in California. In addition, this climate change-induced extreme heat wave extended across the western United States. The resulting demand for electricity exceeded the existing electricity resource planning targets and resources in neighboring areas were also strained. As Figure ES.1 below shows this demand was the result of a historic West-wide heat wave.
Figure ES.1: July, August, and September Temperatures 1985 - 2020
Source: CEC Weather Data/CEC Analysis
2. In transitioning to a reliable, clean, and affordable resource mix, resource planning targets have not kept pace to ensure sufficient resources that can be relied upon to meet demand in the early evening hours. This made balancing demand and supply more challenging during the extreme heat wave.
The rotating outages both occurred after the period of gross peak demand, during the “net demand peak,” which is the peak of demand net of solar and wind generation
resources. With today’s new resource mix, behind-the-meter and front-of-meter (utility-scale) solar generation declines in the late afternoon at a faster rate than demand decreases. This is because air conditioning and other load previously being served by solar comes back on the bulk electric system. These changes in the resource mix and the timing of the net peak have increased the challenge of maintaining system reliability, and this challenge is amplified during an extreme heat wave.
Since 2016, the CAISO, CPUC, and CEC have worked to examine the impacts of significant renewable penetration on the grid. By performing modeling that simulates each hour of the day, not just the gross peak, the RA program has adjusted for this change in resource mix by identifying reliability problems now seen later in the day
5
during the net demand peak. However, additional work is needed to ensure that sufficient resources are available to serve load during the net peak period and other potential periods of system strain.
3. Some practices in the day-ahead energy market exacerbated the supply challenges under highly stressed conditions.
A subset of energy market practices contributed to the inability to obtain or prioritize energy to serve CAISO load in the day-ahead market that could have otherwise relieved the strained conditions on the CAISO grid on August 14 and 15. The practices which obscured the tight physical supply conditions included under-scheduling of demand in the day-ahead market by load serving entities or their scheduling
coordinators, and convergence bidding, a form of financial energy trading used to converge day-ahead and real-time pricing. In addition, the CAISO implemented a market enhancement in prior years. In combination with real-time scheduling priority rules, this enhancement inadvertently caused the CAISO’s day-ahead Residual Unit Commitment process to fail to detect and respond to the obscuring effects of under-scheduling and convergence bidding during August’s stressed operating conditions. Although the CAISO is now actively developing solutions to these market design issues, most of the day-ahead supply challenges encountered were addressed in the real-time market as a result of additional cleared market imports, energy imbalance market transfers and other emergency purchases.
ES.3 Summary of Performance of Different Types of Resources
Since the Preliminary Analysis was published, the CAISO, CPUC and CEC completed their analysis of how specific resource types performed during the August and
September extreme heat waves. The additional analysis and potential improvements are provided below for each resource type.
• Natural gas – Under very high temperatures, ambient derates are not uncommon for the natural gas fleet, and high temperatures reduce the
efficiency of these resources. The CEC hosted a workshop to explore potential technology options for increasing the efficiency and flexibility of the existing natural gas power plant fleet to help meet near-term electric system reliability and the longer-term transition to renewable and zero-carbon resources.1
Subsequently, the CPUC issued a ruling intended to get the most out the existing
1 See:
https://www.energy.ca.gov/event/workshop/2020-12/morning-session-technology-improvements-and-process-modifications-lead and
https://www.energy.ca.gov/event/workshop/2020-12/afternoon-session-finance-and-governance-lead-commissioner-workshop
6
gas fleet in its recently opened procurement rulemaking focused on summer 2021 resources.2 All reasonable efforts should be made to increase the
efficiency of the existing fleet.
• Imports – In total, import bids received in the day-ahead market were between 40 to 50% higher than imports under RA obligations, which indicates that the CAISO was relying on imports that did not have a contract based obligation to offer into the market. In addition to the rule changes the CPUC made to the RA program with regard to imports for RA year 2021, the CPUC may consider
additional changes to current import requirements.
• Hydro and pumped storage – RA hydro resources provided above their RA amounts and various hydro resources across the state managed their pumping and usage schedules to improve grid reliability. There should be increased coordination by communicating as early as possible the need for additional energy or active pump management ahead of stressed grid conditions and leverage existing plans for efficiency upgrades to improve electric reliability.
• Solar and wind – The CPUC has improved the methods for estimating the reliability megawatt (MW) value of solar and wind over the years, but the
reliability value of intermittent resources is still over-estimated during the net peak hour. Improvements to the RA program should account for time-dependent capabilities of intermittent resources.
• Demand response – While a significant portion of emergency demand response programs (reliability demand response resources or RDRR) provided load
reductions when emergencies were called, the total amount did not approach the amount of demand response credited against RA requirements and shown as RA to the CAISO. Some, but not all of this difference, is the result of the credited amounts including a “gross up” that the CPUC applies to demand response resources consisting of approximately 10% for avoiding transmission and distribution losses, and 15% for avoided planning reserve margin procurement for customers who agree to drop load in grid emergencies. Additional analysis and stakeholder engagement are needed to understand the discrepancy between credited and shown RA amounts, the amount of resources bid into the day-ahead and real-time markets, and performance of dispatched demand response.
• Battery storage – During the mid-August events and in early September, there were approximately 200 MW of RA battery storage resources in the CAISO market. It is difficult to draw specific conclusions about fleet performance from such a small sample size. The CAISO will continue to track and understand the
7
collective behavior of the battery storage fleet and work with storage providers to effectively incentivize and align storage charge and discharge behavior with the reliability needs of the system.
ES.4 Analyses Conducted Since the Preliminary Analysis
As mentioned, this final root cause analysis incorporates additional data analysis that was not available when the preliminary root cause analysis was published. Specifically, the following updates were made:
• Additional information and discussion of the Labor Day weekend extreme heat wave
• Updated temperature analysis (Section 4)
• Updated information on gas fleet resource forced outages during the extreme heat wave (Section 4)
• Discussion on performance of resources credited against RA requirements by CPUC and non-CPUC jurisdictional entities (Section 4 and Appendix B)
• Updated analysis of performance of demand response resources based on available settlement quality metered data (Section 4 and Appendix B)
• Updated analysis of load under-scheduling based on available settlement quality metered data and a survey of load scheduling entities, with
recommendations (Section 4 and Appendix B)
• Updated recommendations on communications to utility distribution companies to ensure appropriate load reduction response during future critical reliability events and grid needs (Section 3)
• Discussion of performance of resources during the extreme heat wave (Section 4 and Appendix B)
• Update to discussion and Figures 4.2 and B.1 for actual metered load drop from demand response resources
• Additional analysis on net import position during August 14 and 15 (Appendix B)
• Corrections and clarifications:
o Figures 4.4, B.16, B.17, B.18, and B.19 were all corrected because of a copy-and-paste error that repeated day-ahead awards data for each of these charts comparing real-time awards data. This change does not affect the shown RA amounts or actual generation data.
8
o The cause of a major transmission line outage in the Pacific Northwest was a storm in May 2020. The line remained derated through the mid-August extreme heat wave.
o Table 5.1 was amended with the correct forecast and peak numbers, and additional September dates were added.
In addition, since the publication of Preliminary Analysis, on November 24, 2020, the CAISO’s Department of Market Monitoring (DMM) released its independent review of system conditions and performance of the CAISO’s day-ahead and real-time markets from mid-August to September 7, 2020, and some of the findings in the DMM report are incorporated into this Final Analysis.3 Notably, the DMM concurred with many of the
key findings and recommendations of the Preliminary Analysis and confirmed that there was no single root cause but a series of factors that contributed to the emergencies. The DMM also confirmed that “[c]ontrary to some suggestions in the media, DMM has found no evidence that market results on these days were the result of market
manipulation.”4 ES.5 Conclusion
This Final Analysis provides a comprehensive look at the causes of the rotating outages on August 14 and 15, assesses how resources performed during those periods, and sets forth important recommendations and actions that are being addressed by the CAISO, CPUC and CEC. All three organizations have committed to working expeditiously and collaboratively, with the valuable input and engagement of critical partners and
stakeholders, to position California for success in reliably meeting its climate and energy goals.
3 Department of Market Monitoring, California ISO, Report on system and market conditions,
issues and performance: August and September 2020, November 24, 2020. Available at:
http://www.caiso.com/Documents/ReportonMarketConditionsIssuesandPerformanceAugustand September2020-Nov242020.pdf
4 Department of Market Monitoring, California ISO, Report on system and market conditions,
9
1
Introduction
On August 17, 2020 Governor Gavin Newsom sent a letter to the California Independent System Operator (CAISO), the California Public Utilities Commission (CPUC), and the California Energy Commission (CEC) after the CAISO balancing authority area (BAA) experienced two rotating outages on August 14 and 15 during a West-wide extreme heat wave.5 In the letter, Governor Newsom requested immediate
actions to minimize rotating outages as the extreme heat wave continued, and a comprehensive review of existing forecasting methods and resource adequacy requirements. The Governor also requested that the CAISO complete an after-action report to identify root causes of the events.
The CAISO, CPUC, and CEC responded to Governor Newsom in a letter dated August 19, 2020, with immediate actions for the next five days and a commitment to an after-action report.6 This Final Root Cause Analysis (Final Analysis) responds to that
commitment and reflects the collective efforts of the CAISO, CPUC, and CEC. The information provided in this Final Analysis reflects the best available assessment at this time.
5 See Office of the Governor, Letter from Gavin Newsom to Marybel Batjer, Stephen Berberich,
and David Hochschild, August 17, 2020, https://www.gov.ca.gov/wp-content/uploads/2020/08/8.17.20-Letter-to-CAISO-PUC-and-CEC.pdf.
6 See CPUC, CAISO, and CEC, Letter from Marybel Batjer, Stephen Berberich, and David
Hochschild to Governor Gavin Newsom, August 19, 2020,
https://www.cpuc.ca.gov/uploadedFiles/CPUCWebsite/Content/News_Room/NewsUpdates/20 20/Joint%20Response%20to%20Governor%20Newsom%20Letter%20August192020.pdf.
10
2
Background
The CAISO is the Balancing Authority that oversees the reliability of approximately 80% of California’s electricity demand and a small portion of Nevada. The remaining 20% is served by publicly owned utilities such as the Los Angeles Department of Water and Power (LADWP) and Sacramento Municipal Utility District (SMUD), which operate separate transmission and distribution systems. However, there are some California publicly-owned utilities in the CAISO’s BAA and some investor-owned utilities that do not. The CAISO manages the high-voltage transmission system and operates wholesale electricity markets for entities within its system and across a wider western footprint via an Energy Imbalance Market (EIM). The CAISO performs its functions under a tariff approved by the Federal Energy Regulatory Commission (FERC) and reliability
standards set by the Western Electricity Coordinating Council (WECC) and the North American Electric Reliability Corporation (NERC).
Utilities and other electric service providers operate within a hybrid retail market. Within the hybrid retail market, there are a variety of utilities, some of which fall under the direct authority of the CPUC, others that are subject to some CPUC jurisdiction but also have statutory authority to control some procurement and rate setting decisions, and other public or tribal entities that operate wholly independently of the CPUC or other state regulatory bodies for procurement and rate setting.
2.1 Resource Adequacy Process in the CAISO BAA
Following the California Electricity Crisis in 2000–2001, the Legislature enacted Assembly Bill (AB) 380 (Núñez, Chapter 367, Statutes of 2005), which required the CPUC, in
consultation with the CAISO, to establish resource adequacy (RA) requirements for CPUC jurisdictional load serving entities (LSEs). The RA program primarily ensures there are enough resources with contractual obligations to ensure the safe and reliable operation of the grid in real time providing sufficient resources to the CAISO when and where needed. The RA program also encourages through incentivizes the siting and construction of new resources needed for future grid reliability.
Broadly speaking, the CPUC sets and enforces the RA rules for its jurisdictional LSEs and the community choice aggregators and electric service providers within the
jurisdictional LSE’s footprint, including establishing the electricity demand forecast basis and planning reserve margin (PRM) that sets the monthly obligations. CPUC
jurisdictional LSEs must procure sufficient resources to meet these obligations based on the resource counting rules established by the CPUC. The CEC develops the electricity demand forecasts used by the CPUC and provided to the CAISO. Non-CPUC
jurisdictional LSEs in the CAISO footprint can set their own RA rules regarding resource procurement requirements including the PRM and capacity counting rules or default to
11
the CAISO’s requirements. RA capacity from CPUC and non-CPUC jurisdictional LSEs are shown to the CAISO every month and annually based on operational and market rules established by the CAISO. The CAISO enforces these rules to ensure it can reliably operate the wholesale electricity market.
The CPUC and the CAISO require LSEs to acquire three types of (RA) products: System, Local, and Flexible. Although Local and Flexible RA play important roles in assuring reliability, the August 14 through 19 events implicated primarily system resource needs, and, therefore, system RA requirements. This Final Root Cause Analysis focuses on issues associated with system RA.
Separate from the RA programs, California has established a long-term planning
process, known as the Integrated Resource Planning (IRP) process, through statutes and CPUC decisions. Under IRP, the CPUC models what portfolio of electric resources are needed to meet California’s Greenhouse Gas (GHG) reduction goals while maintaining reliability at the lowest reasonable costs. The IRP models for resource needs in the three- to 10-year time horizons. If the IRP identifies a need for new resources, the CPUC can direct LSEs to procure new resources to meet those needs.
The RA and IRP programs work in coordination. The RA program is designed to ensure that the resources needed to meet California’s electricity demand are under contract and obligated to provide electricity when needed. The IRP program ensures that new resources are built and available to the shorter-term RA program when needed to meet demand and to ensure the total resource mix is optimum to meet the three goals of clean energy, reliability, and cost effectiveness.
The RA rules are set to ensure that LSEs have resources under contract to meet average peak demand (a “1-in-2 year” peak demand) plus a 15% planning reserve margin (PRM) to allow 6% in Western Electricity Coordinating Council (WECC)-required grid operating contingency reserves, and a 9% contingency to account for plant outages and higher-than-average peak demand. The demand forecasts are adopted by the CEC as part of its Integrated Energy Policy Report (IEPR) process. To develop CPUC RA obligations, the adopted IEPR forecast may be adjusted for load-modifying demand response, as determined by the CPUC.
Like RA, IRP modeling is also based on the CEC’s adopted 1-in-2 demand forecast plus a 15% PRM. In addition, the CPUC conducts reliability modeling based on a 1-in-10 Loss of Load Expectation (LOLE) standard, which is more conservative than the 1-in-2
12
2.2 CEC’s Role in Forecasting and Allocating Resource Adequacy Obligations
The CEC develops and adopts long-term electricity and natural gas demand forecasts every two years as part of the IEPR process. The CEC develops and adopts new
forecasts in odd-numbered years, with updates in the intervening years. The inputs, assumptions and methods used to develop these forecasts are presented and discussed publicly at various IEPR workshops throughout each year.
Since 2013, the CEC, the CPUC, and the CAISO have engaged in collaborative discussions around developing the IEPR demand forecast and its use in each organization’s respective planning processes. Through the Joint Agency Steering Committee (JASC), the three organizations have agreed to use a “single forecast set” consisting of baseline forecasts of annual and hourly energy demand, specific weather variants of annual peak demand, and scenarios for additional achievable energy efficiency (AAEE).7 For 2020, the CEC used the 1-in-2 Mid-Mid Managed Case Monthly
Coincident Peak Demands (mid-case sales and mid-case AAEE), adopted in January 2019. This was the most recently adopted forecast at when the RA process for 2020 began in early 2019 and follows the single forecast set agreement.
Using the adopted CAISO transmission access charge (TAC) area forecast as a basis, the CEC then determines the individual LSE coincident peak forecasts that are the basis for each LSE’s RA obligations. In California, each TAC area is the equivalent to the IOU footprint. The CEC adjusts each LSE’s load forecast for system coincidence by month. The RA system requirement is based on this coincident peak load.
This process is implemented differently for CPUC-jurisdictional LSEs, which include Investor-Owned Utilities (IOUs), Community Choice Aggregators (CCAs), and Energy Service Providers (ESPs), and non-CPUC-jurisdictional LSEs. These non-CPUC jurisdictional LSEs are primarily publicly owned utilities (POUs), but also include entities such as the California Department of Water Resources, the Western Area Power Administration (WAPA) and tribal utilities, each of which is its own local regulatory authority (LRA).8
For CPUC-jurisdictional LSEs, the CEC develops the reference total forecast and LSE-specific coincidence adjusted forecasts. To determine the reference forecast, CEC
7 The 2018 single forecast set—which informed the determination of LSE requirements for 2020
system RA—also included additional achievable scenarios around PV adoption induced by the 2019 Title 24 building standards update. Following adoption of the standards in 2019, the impact from these systems has been embedded in the baseline demand forecasts.
8 As of 2020, there are 70 LSEs in the CAISO, of which 33 are non-CPUC jurisdictional. In total, the
non-CPUC jurisdictional entities serve about 9% of CAISO load. See Appendix A, Table A2 for details.
13
staff disaggregates the Southern California Edison (SCE) and Pacific Gas and Electric (PG&E) transmission area peaks to CPUC- and non-CPUC-jurisdictional load based on the CEC forecast of the annual IOU service area peak demand (CEC Form 1.5b) and analysis of LSE hourly loads and year-ahead forecasts. The CPUC-jurisdictional total, adjusted for load-modifying demand response programs, serves as the reference forecast for the CPUC RA forecast process. CEC staff then reviews and adjusts CPUC LSE submitted forecasts consistent with CPUC rules. The final step in this process is applying a pro-rata adjustment to ensure the sum of the CPUC-jurisdictional forecasts is within 1% of the reference forecast.
The CEC develops a preliminary year-ahead forecast for the aggregate of Non-CPUC jurisdictional entity load as part of the CPUC reference forecast.
Non-CPUC-jurisdictional entities then submit their own preliminary year-ahead forecasts of non-coincident monthly peak demands and hourly load data in April of each year. CEC staff determines the coincidence adjustment factors, and the resulting coincident peak forecast plus each non-CPUC-jurisdictional entity’s PRM (which most set equivalent to the CAISO’s default 15% PRM) determines the entity’s RA obligation. Non-CPUC-jurisdictional entities, as their own LRA, may revise their non-coincident peak forecast before the final year-ahead or month-ahead RA showings to CAISO. The
CEC-determined coincidence factors are applied to the new noncoincident peak forecast. For the final year-ahead RA showings to the CAISO, the non-CPUC-jurisdictional
collective August 2020 coincident peak load was 4,170 MW, 3.7% lower than the CEC’s preliminary estimate of 4,330 MW. For the August 2020 month-ahead showing, CPUC-jurisdictional forecasts increased to 4,169 MW. The CEC then transmits both non-coincident and non-coincident forecasts to the CAISO to ensure that congestion revenue rights allocations, based on non-coincident forecasts, are consistent with RA forecasts. The CEC transmits preliminary forecasts for all LSEs for the month of the annual peak (currently September) to CAISO by July 1. The load share ratios of the preliminary coincident forecasts are used to allocate local capacity requirements.
In August, CPUC LSEs may update their year-ahead forecast only for load migration. The CEC applies the same adjustment and pro-rata methodology to determine their final year-ahead forecasts. The CEC may also receive updated forecasts from POUs. The final coincident peak forecasts for all LSEs are transmitted to the CAISO in October to validate year-ahead RA compliance obligation showings. Throughout the year, LSEs may also update month-ahead forecasts. Coincident and non-coincident forecasts are transmitted to the CAISO each month. Non-coincident forecasts are the basis for allocations of congestion revenue rights. Table 2.1 summarizes this process.
14
Table 2.1: RA 2020 LSE Forecast Timeline
January 2019 Adopted 2018 IEPR Update TAC Area Monthly peak demand forecast
February – May All LSEs submit preliminary forecasts of 2021 monthly peak demand and 2018 hourly loads.
CEC develops jurisdictional split.
July 2019 Preliminary forecasts to LSEs; September load ratio shares to CAISO for local capacity allocation
August 2019 CPUC LSEs submit revised forecasts, updated only for load migration.
September 2019 CEC issues adjusted CPUC LSE forecasts, which must sum to within 1% of reference forecast.
POUs may update non-coincident peak forecasts October 2019 Year-ahead showing to CAISO
November 2019 - November 2020
LSEs may submit revised non-coincident peak
forecasts to CEC before the month-ahead showing.
2.3 CPUC’s Role in Allocating RA Obligations to Jurisdictional LSEs
Under state and federal rules, the CPUC is empowered to set the RA requirements for its jurisdictional LSEs, which include the IOUs, CCAs, and ESPs. Collectively, these
jurisdictional entities represent 90% of the load within the CAISO service territory. Monthly and annual system RA requirements are derived from load forecasts that LSEs submit to the CPUC and CEC annually. Following the annual forecast submission, the CEC makes a series of adjustments to the LSE load forecasts to ensure that individual forecasts are reasonable and aggregated to within one percent of the CEC forecast. These adjusted forecasts are the basis for year-ahead RA compliance obligations. Throughout the compliance year, LSEs must also submit monthly load forecasts to the CEC that account for load migration. These monthly forecasts are used to calculate monthly RA requirements.
In October of each year, CPUC jurisdictional LSEs must submit filings to the CPUC’s Energy Division demonstrating that they have procured 90% of their system RA obligations for the five summer months (May–September) of the following year. Following this year-ahead showing, the RA program requires that LSEs demonstrate procurement of 100% of their system RA requirements on a month-ahead basis. To determine the capacity of each resource eligible to be counted toward meeting the CPUC’s RA requirement, the CPUC develops Qualifying Capacity (QC) values
15
based on what the resource can produce during periods of peak electricity demand. The CPUC-adopted QC counting conventions vary by resource type:
• The QC value of dispatchable resources, such as natural gas and
hydroelectric (hydro) generators, are based on the maximum output of the generator when operating at full capacity—known as the Pmax.
• Resources that must run based on external operating constraints, such as geothermal resources, receive QC values based on historical production. • Combined heat and power (CHP) and biomass resources that can bid into
the day-ahead market, but are not fully dispatchable, receive QC values based on historical MW amount bid or self-scheduled into the day-ahead market.
• Wind and solar QC values are based on a statistical model looking at the contribution of these resources to addressing loss of load events. This method is known as the effective load carrying capability (ELCC). This modeling has reduced the amount of qualifying capacity these resources receive by approximately 80% (that is, a solar or wind resource that can produce 100 MW at the maximum output level is assumed to produce only about 20 MW for meeting the CPUC’s RA program).9
• Demand Response QC values are set based on historical performance. The resultant QC value does not consider potential transmission system constraints that could limit the amount of generation that is deliverable to the grid to serve load. Consequently, the CAISO conducts a deliverability test to determine the Net Qualifying Capacity (NQC) value, which may be less than the QC value determined by the CPUC. RA resources must pass the deliverability test as the NQC value is what is ultimately used to determine RA capacity.
2.3.1 Timeline for RA Process, Obligations, and Penalties
System RA is based on a one-year cycle where procurement is set for one year
forward.10 In the year ahead (Y-1), the CEC adjusts each LSE‘s 1-in-2 demand forecast
according to the process described above. The LSE’s RA obligation is its forecast plus the PRM established by the CPUC or applicable LRA. Each CPUC jurisdictional LSE must then file an RA resource plan with the CPUC on October 31 of each year that shows the
9 CPUC, D.19-06-026, Decision Adopting Local Capacity Obligations for 2020-2022, Adopting
Flexible Capacity Obligations for 2020, and Refining the Resource Adequacy Program, June 27, 2019, available at:
https://docs.cpuc.ca.gov/PublishedDocs/Published/G000/M309/K463/309463502.PDF
16
LSE has at least 90% of its RA obligations under contract for the five summer months of the following year. If a jurisdictional LSE submits an RA plan with the CPUC that does not meet its full obligations, the LSE can be fined by the CPUC.
The CEC staff uploads into the CAISO RA capacity validation system all the approved load forecasts for each CPUC-jurisdictional and non-jurisdictional LSE for each month of the year-ahead obligation. Credits to an LSE’s obligation permitted by the LRA, may result in a lower amount of total RA shown by the LSE scheduling coordinator to the CAISO. Credits generally represent demand response programs and other programs that reduce load at peak times. These credits are not included in the forecasts
transmitted by the CEC. The composition of credited amounts are generally not visible to the CAISO, and resources that are accounted for in the credits do not submit bids consistent with a must offer obligation and are not subject to availability penalties or incentives, or substitution requirements as described below.11 Lastly, the CAISO will
allocate the capacity of reliability must-run (RMR) backstop resources to offset LSE obligations, also described below.
Finally, RA submissions are provided to the CAISO as required for CPUC- and non-CPUC-jurisdictional LSEs via a designated scheduling coordinator. To participate in the CAISO market, an entity (whether representing an LSE, generation supplier, or other) must be a certified scheduling coordinator or retain the services of a certified scheduling
coordinator to act on its behalf.12 For the year-ahead RA obligation, scheduling
coordinators for suppliers of RA capacity are required to submit a matching supply plan to the CAISO. The CAISO then combines the supply plans to determine if there are enough resources under contract to meet the planning requirements.
11 Since credited capacity is not subject to CAISO RA market rules, on August 27, 2020, the
CAISO submitted proposed edits to its Business Practice Manual (BPM) for Reliability
Requirements to stop the practice of crediting and to require all RA resources to be explicitly shown on the RA supply plans. Several stakeholders objected to the change and appealed the decision. On December 9, 2020, the CAISO BPM Appeals Committee decided to hold any changes in abeyance until August 1, 2021, to work constructively and collaboratively with stakeholders to attempt to resolve the stakeholders’ and Appeals Committee’s concerns. The CAISO will evaluate by August 1, 2021 whether the CAISO’s expressed concerns about resource crediting have been addressed. See Business Practice Manual Proposed Revision Request 1280: https://bpmcm.caiso.com/Pages/ViewPRR.aspx?PRRID=1280&IsDlg=0 and
http://www.caiso.com/Documents/ExecutiveAppealsCommitteeDecision-PRR1280-Dec092020.pdf
12 Scheduling coordinators can directly bid or self-schedule resources as well as handle the
settlements process. See
17
All LSEs must also submit month-ahead RA plans 45 days before the start of each month showing that they have 100% of their system RA requirement under contract. The CPUC once again verifies the month-ahead supply plans and can fine LSEs that do not
comply with its RA requirements. The CAISO also receives supply plans in the month-ahead time frame from the designated scheduling coordinators similar to the year-ahead time frame.
Under CAISO rules, if there are not enough resources on the supply plans, the CAISO can procure additional backstop capacity on its own to meet the planning
requirements. To address supply plan deficiencies, the CAISO can procure additional resources through its capacity procurement mechanism (CPM). The CAISO procures CPM capacity through a competitive solicitation process. The CPM allows the CAISO to procure backstop capacity if LSEs are deficient in meeting their RA requirements or when RA capacity cannot meet an unforeseen, immediate, or impending reliability need.
In addition, the CAISO can procure backstop capacity through its RMR mechanism. The RMR mechanism authorizes the CAISO to procure retiring or mothballing generating units needed to ensure compliance with applicable reliability criteria. Once so
designated, participation as an RMR unit is mandatory.
2.4 CAISO’s Role in Ensuring RA Capacity is Operational
Resources providing system RA capacity generally have a “must-offer” obligation, which means they must submit either an economic bid or self-schedule to the CAISO day-ahead market for every hour of the day.13 The CAISO tariff provides limited
exceptions to this 24x7 obligation for resources that are registered with the CAISO as “Use-Limited Resources,” “Conditionally Available Resources,” and “Run-of-River Resources.” Moreover, wind and solar resources providing RA capacity must bid consistent with the associated because the variability of these resources would not reflect full availability 24x7.
Resources providing RA capacity whose registered start-up times allow them to be started within the real-time market time horizon, referred to in the CAISO tariff as “Short Start Units” and “Medium Start Units,” have a must-offer obligation to the real-time market regardless of the respective day-ahead market award. Resources with longer registered start times, referred to in the CAISO tariff as “Long Start Units” and “Extremely Long-Start Resources,” have no real-time market bidding obligation if they did not receive a day-ahead market award for a given trading hour. This is because if they are
18
not already online, the lead time for a dispatch from the real-time market is too short for these resources to respond.
The CAISO has two main mechanisms to ensure that resources providing RA capacity meet the must-offer obligation. First, the CAISO submits cost-based bids on behalf of resources providing generic RA capacity that do not meet the respective RA must-offer obligation. The generated bid helps ensure the CAISO market has access to energy from an RA resource even when that RA resource fails to bid as required. Second, through the RA Availability Incentive Mechanism (RAAIM), the CAISO assesses non-availability charges and provides non-availability incentive payments to generic and flexible RA resources based on whether their performance falls below or above, respectively, defined performance thresholds. The CAISO tariff exempts certain resource types from bid generation and RAAIM. The exemptions from bid generation, RAAIM, and the 24x7 generic RA must-offer obligation are not necessarily paired; a resource type can be exempt from one but still face the other two. Lastly, credited amounts do not have any RA market obligations because the underlying resources are not always visible to the CAISO and were not provided explicitly on the RA supply plans. Credited resources are accounted for as non-RA throughout this analysis.
Pursuant to section 34.11 of its tariff, the CAISO may issue exceptional dispatches (i.e., manual dispatches by CAISO operators outside the CAISO’s automated dispatch process) to resources to address reliability issues. The CAISO may issue a manual exceptional dispatch for resources in addition to or instead of resources with a day-ahead schedule during a System Emergency or to prevent a situation that threatens System Reliability and cannot otherwise be addressed.
19
3
Mid-August Event Overview
3.1 Weather and Demand Conditions During Mid-August
During August 14 through 19, California experienced statewide extreme heat with temperatures 10-20 degrees above normal. As Figure 3.1 below shows, this extreme heat affected 32 million California residents.
Figure 3.1: National Weather Service Sacramento Graphic for August 14
Source: https://twitter.com/NWSSacramento
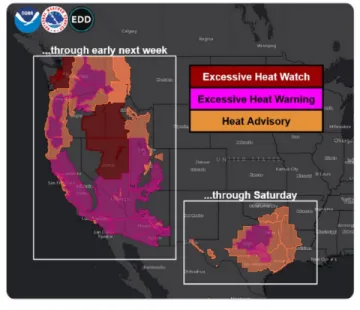
In total, 80 million people fell within an excess heat watch or warning as shown in Figure 3.2 below from the National Weather Service (NWS).
20
Figure 3.2: National Weather Service Weather Prediction Center Graphic for August 15
Source: https://twitter.com/NWSWPC/status/1294589703254167557
The rest of the West also experienced record or near-record highs with forecasts
ranging between five and 20 degrees above normal, with the warmest temperatures in the Southwest (Las Vegas and Phoenix) as well as the Coastal Pacific Northwest
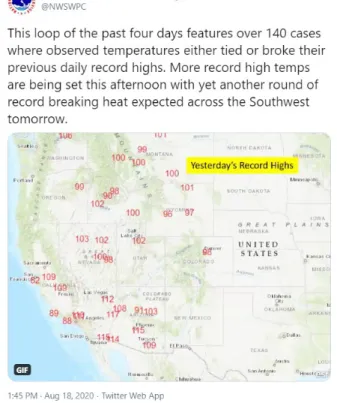
(Portland and Seattle). Figure 3.3 below documents the continuing extreme heat wave on August 18 into August 19.
21
Figure 3.3: National Weather Service Weather Prediction Center Graphic for August 18
Source: https://twitter.com/NWSWPC/status/1295824180638670848
This rare West-wide extreme heat wave affected demand for and supply of generation. Typically, high day-time temperatures are offset by cool and dry evening conditions. However, the multi-day extreme heat wave meant that there was limited overnight cooling, so air conditioners continued to run well into the evening and the next day. The CAISO also conducted a backcast analysis isolating the impacts of shelter-in-place and work-from-home conditions due to COVID-19.14 The backcast analysis found that
while load was lower in the spring months, during July, as air conditioning use increased, the CAISO observed minimal to no load reductions compared to pre-COVID-19
conditions.
In terms of supply, the extreme heat wave negatively impacted conventional
generation (such as thermal resources fueled by natural gas), which typically operates less efficiently during temperature extremes. Even for solar generation, high clouds caused by a storm covering large parts of California and smoke from active fires during these events reduced large-scale grid-connected solar and behind-the-meter solar generation on some days, leading to increased variability. Lastly, California hydro
14 See CAISO analysis:
22
conditions for summer 2020 were below normal. The statewide snow water content for the California mountain regions peaked at 63% of average on April 7, 2020.
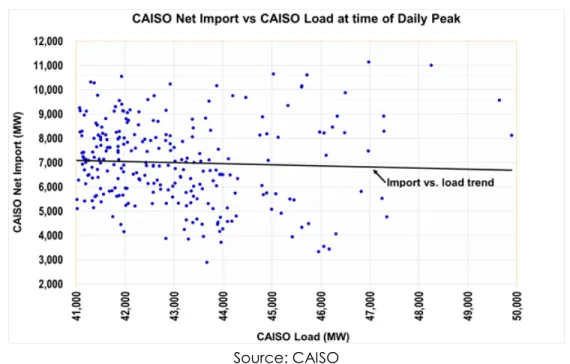
The CAISO Balancing Authority Area (BAA) traditionally relies on electricity imports on peak demand days, meaning that while electricity trading occurs with the rest of the West, on net, the CAISO imports more than it exports. During the extreme heat wave, given the similarly extreme conditions in some parts of the West, the usual flow of net imports into the CAISO was drastically reduced. The CAISO was also limited in its ability to access energy from the Northwest due to a derate at an intertie in the northern part of the system. Figure 3.4 below shows the historical trend of net imports into the CAISO footprint from 2017 through 2019 at the daily peak hour when demand is at or above 41,000 MW.15 On average the import trend is about 6,000 MW to 7,000 MW of net
imports, but this trend can vary widely and generally decreases as the CAISO load increases.
Figure 3.4: 2017 -2019 Summer Net Imports at Time of Daily Peaks Above 41,000 MW
Source: CAISO
3.2 CAISO Reliability Requirements and Communications During mid-August Event
This section provides an overview of relevant CAISO reliability requirements and related operations-based communications, as well as more general communications channels, used during the mid-August event.
15 Demand of 41,000 MW is 90 percent of the forecast of the CAISO 2020 1-in-2 peak demand of
23
The CAISO operates the wholesale electricity markets and is the Balancing Authority (BA) for 80% of California and a small portion of Nevada (CAISO-Controlled Grid). The CAISO operates to standards set by the North American Electric Reliability
Corporation16 (NERC) and the Western Electricity Coordinating Council17 (WECC)
regional variations as approved by the Federal Energy Regulatory Commission (FERC). Violations of WECC and NERC standards can result in FERC fines of up to $1 million per day.18
Specifically, under standard BAL-002-319 (NERC requirement) and BAL-002-WECC-2a20
(WECC regional variance), the CAISO as the BA is required to have contingency reserves.21 Contingency reserves are designated resources that can be dispatched to
address unplanned events on the system such as a loss of significant generation,
sudden unplanned outage of a transmission facility, sudden loss of an import, and other grid reliability balancing needs.22 Contingency reserves are maintained to ensure the
grid can respond quickly in case the CAISO loses a major element on the grid such as the Diablo Canyon Power Plant (Diablo Canyon) or the Pacific DC Intertie (PDCI) transmission line. The NERC and WECC standards specifically require the grid operators to identify the most severe single contingency that could destabilize the BAA and cause cascading outages throughout the western interconnected grid if that resource is lost. For the CAISO, the most severe single contingency tends to be either Diablo Canyon or the PDCI.
Generally, the CAISO is required to carry reserves equal to 6% of the load, consistent with WECC contingency requirements that operating reserves be equal to the greater of (1) the most severe single contingency or (2) the sum of three percent of hourly integrated load plus three percent of hourly integrated generation.23 Under normal
conditions, the CAISO uses two types of generating resources to meet this requirement: spinning and non-spinning reserves. Spinning reserves are generating resources that are running (i.e., “spinning”) and can quickly and automatically provide energy in case of a contingency. Non-spinning reserves are resources, which may include demand 16https://www.nerc.com 17https://www.wecc.org 18 See https://www.ferc.gov/enforcement-legal/enforcement/civil-penalties 19https://www.nerc.com/pa/Stand/Reliability%20Standards/BAL-002-3.pdf 20 https://www.nerc.com/_layouts/15/PrintStandard.aspx?standardnumber=BAL-002-WECC-2a&title=Contingency%20Reserve&jurisdiction=United%20States
21 Also referred to as operating reserves or ancillary services. This discussion does not include
regulation up and down services.
22https://www.nerc.com/pa/Stand/Glossary%20of%20Terms/Glossary_of_Terms.pdf
23 See
24
response, that are available to respond within 10 minutes but are not running pre-contingency. Under extraordinary conditions, it is possible for the CAISO to designate load that is not specifically designated as demand response resources and that can be curtailed within 10 minutes as non-spinning reserves, if the resources normally used are not available. Although the CAISO can curtail load to meet its reserve requirements, it can do so only for non-spinning reserves. Continuing to operate while lacking sufficient spinning reserves runs the risk that if an actual contingency were to occur, such as the loss of Diablo Canyon or PDCI, the CAISO BAA would lack the automatic response capability needed to stabilize the grid, leading to uncontrolled load shed that could potentially destabilize the greater western grid.
The CAISO’s operational actions are communicated largely through Restricted Maintenance Operations (RMO), and Alerts, Warnings, and Emergencies (AWE) per Operating Procedure 4420.24 Each is explained briefly below:
• Restricted Maintenance Operations request generators and transmission operators to postpone any planned outages for routine equipment maintenance and avoid actions that may jeopardize generator or
transmission availability or both, thereby ensuring all grid assets are available for use.
• Alert is issued by 3 p.m. the day before anticipated contingency reserve deficiencies. The CAISO may require additional resources to avoid an emergency the following day.
• Warning indicates that grid operators anticipate using contingency reserves. Activates demand response programs (voluntary load reduction) to
decrease overall demand.
• Stage 1 Emergency is declared by the CAISO when contingency reserve shortfalls exist or are forecast to occur. Strong need for conservation. • Stage 2 Emergency is declared by the CAISO when all mitigating actions
have been taken and the CAISO is no longer able to provide for its expected energy requirements. Requires CAISO intervention in the market, such as ordering power plants online.
• Stage 3 Emergency is declared by the CAISO when unable to meet minimum contingency reserve requirements, and load interruption is imminent or in progress. Notice issued to utilities of potential electricity interruptions through firm load shedding.
25
In addition to these operational communication tools, the CAISO relies on Flex Alerts to broadly communicate with consumers to appeal for voluntary energy conservation when demand for power could outstrip supply. Starting in 2016, the administration of the Flex Alert program was entirely transferred from the IOUs to the CAISO without a paid media component.25 However, between 2016 and 2019, the CPUC allocated up
to $5 million per year to support paid Flex Alert advertising, as funded and administered by the Southern California Gas Company, because of the Aliso Canyon natural gas leak.26 The funded Flex Alert advertising focused on custom