14
Does Financial Integration Exist in ECOWAS? Matthew Oladapo Gidigbi1*, Benedict Akanegbu2 1Modibbo Adama University of Technology, Nigeria
2Nile University of Nigeria, Nigeria [email protected], [email protected]
Abstract: Free movement of goods, capital, and persons have been the long-term strategic goals of the Economic Community of West Africa States (ECOWAS) since its establishment. Notwithstanding, financial integration has become more important in deepening political integration in the region than ever. Assessing how far the Regional Economic Community (REC) has achieved her objective of free movement of capital among the member states. Therefore, this study investigated the existence of financial integration in ECOWAS by employing savings-investment equality, popularly known as Feldstein-Horioka Criterion; a panel data for all the 15 member states was fitted into the specified model. The study found that there is the existence of financial integration in the REC, and that language inhibits financial integration and that the coefficient of language dummy stands at -4.8 percent. However, it found that language inhibition of the financial integration in the REC will gradually disappear over time, as the interactive coefficient of language and time stands at -0.12 percent. This study concludes that a level of financial integration is in existence in the REC. Therefore, the REC is prepared for monetary unification assuming that there will be more substantial trade among the member states.
Keywords: Model with Panel Data, Financial Integration, Regional Economic Activity, Capital, ECOWAS
1. Introduction
Savings and investment are prominent variables of interest to the economists due to their utmost relevance in enhancing economic growth and development. Little wonder that researchers (independent inclusive) and policymakers show a keen interest in the study of savings and investment. Simply, saving is the excess of income over consumption. It is noted as well that expenditure on investment is financed through saving; both variables play a key role in financial integration under economic integration process. In a very simplistic term, economic integration creates an openness to encourage factor-price equalization. Economic integration is of various degrees or types: Trade Integration, Customs Union, Factor Integration, Policy Integration and Total Integration. Prominent among the various objectives of economic integration are a reduction of the external vulnerability of the participants; the resultant enlarged market and lower unit cost, which stimulate demand and consumption and finally lead to increased investments and economic growth; polarization effect and job creation. As a matter of fact, it is economic integration scope that brought about Economic Community of West Africa States (ECOWAS), a multi-objectives organization. It aims at the abolition of obstacles to free movement of persons, services, and capital between member states among other objectives1
(ECOWAS, 1976).Free movement of capital is one of the ‘free movements’ that the community permits. As such this has been part of the objectives of the community, there is need to assess the financial integration in the region thereby determining the extent at which the available capital has been moving in the region. The question now is whether ECOWAS for the past four decades has been able to achieve her overall objective of accelerated and sustainable economic development of the member states; and the creation of homogeneous society, leading to the unity of the countries of West Africa for the sole aim of eliminating all types of obstacles to the free movement of goods, capital and persons?2 Focusing on the movement of the
investible funds; has the organization been able to mobilise investible fund effectively within the Regional Economic Community (REC)? Knowing that each member states has expended a lot of financial resource in keeping up with the membership of the organization, in which case members expect economic benefits in whatever form, in return to justify their contribution to every side. This is a fact that needs answer with a sustained momentum. Recently, one of the member countries at her national parliament initiated discussion on the likelihood of pulling out of the REC. However, the discussion was doused for the fact that it may inhibit
1 See Chapter 1; Article 2 Sub-section 2b of ECOWAS TREATY.
15
the unity of the region. Though, this study is not holistic about the contribution of the REC to the economic growth and development of the member states, and how this has translated to the indigent population of the member states. Nevertheless, it worth investigating, as this study only limits to the level of financial integration in the REC. The extent of financial integration would serve as a pointer towards possible monetary union, and fairness of the trade. Ultimately, as a measurement of the REC’s free movement of the capital objective. Unfortunately, very few referral studies point in this direction. This study points out the extent of financial integration concerning investible funds in terms of physical capital mobility, which could equally serve as a measure of financial integration to the REC, and scholars that have an interest in the study of RECs. Also, on what should be the decision of the REC with respect to customs tariff and a commercial policy towards third countries?3
2. Literature Review
ECOWAS as REC is economically integrated in the sense that the REC has diminishing trade barriers, allows for free movement of the factors of production and having considerable tariffs. However, monetary union in the REC has not been achieved. According to one of the reports published by International Labour Organization, there is an abiding hope if not an expectation that economic integration will promote growth in its entirety and provides the means of escaping poverty (Robert, 2004, p. 4). The emergence of higher levels of integration in a society, which is a means to the higher level of organization in the sense of converting many small geographical units into one large unit has been highlighted to result in growth rates surge to new and high levels (Spengler, 1949). Meanwhile, Balassa (1961) identified some areas in which economic welfare will be affected, in an instance of integration. The areas4 are a change in the quantity of commodities
produced; a change in the degree of discrimination between domestic and foreign goods; a redistribution of income between the nationals of different countries; and income redistribution within individual countries. The treaty that established ECOWAS was signed in the year 1975 and the organization came into being in the year 1978. Fifteen countries in the continent made up the organization (ECOWAS, 1976). There is a readiness on the part of the Community to integrate trade. This development leads the REC into the establishment of Business Information System (Ecobiz), and ECOWAS Common Trade Policy which is supported by both the German Cooperation (GTZ) and World Trade Organization (ECOWAS, 2012). Notwithstanding, the consequences of integration depends on the satisfaction of some preconditions as stated as follows (Agbonkhese & Adekola, 2014):
Substantiality of trade incidence: percentage of total trade among members should be greater than what is obtainable with a non-member.
Competitiveness of the productive structure of member countries: this would enable efficient producers to capture a larger market, and further stressed cooperation of trade among member countries.
The extent of income, geographical and demographic structures: the larger these factors, the more possibility of expanding market and productivity.
Integration of two or more markets is usually an ability to obtain the law of one price (Kenen, 1976). Regional integration is the process of removing hurdles to open economy, that the multiple units which are trying to make a unit may enjoy law of one price as a means of market equalization. The law of one price is not an imposition of constitutional law but as a result of the interplay of demand and supply of capital in case of financial integration. However, member states would have rules and regulations guiding capital movement from one country to another in the region but not a stringent law that would restrict the movement in the actual sense. According to Lombaerde and Van Langenhove (2006:9), ‘regional integration is the process of complex social transformations characterized by the intensification of relations between independent sovereign states.’ Regional integration is the way of converting different units with autonomy in a particular area or within the same strata of geographical location into a unit. The coming of the multiple units into a unit does not imply lost autonomy in the area of common interest but the common administration of common
3 See Chapter 1; Article 2 Sub-section 2c of ECOWAS TREATY.
4 Balassa (1961) explains the precedent to these points as related to Welfare Economics, under the sub-heading of economic integration and welfare (See it to enjoy the explanation for grounded insight).
16
laws in the REC would hold. The regional integration is a process usually from one stage into another. It could exist as any or all of the following: diplomacy, security, culture, policy, and politics as well.
Mostly, regional integration focuses more on trade and economy, as largely observed in regional communities’ treaties. The development had prompted studies on the impact of regional integration. Ideally, it is clear that exchange of physical goods and services are not the only commodities involved in regional integration but physical capital as well. Kleimeier and Sander (2000) as cited in Fratianni (2006) provides evidence that financial integration is primarily a regional phenomenon as found in the analysis of six core EU countries. The study found that physical capital mobility is higher within the regions of the same country than among countries. The free mobility of physical capital within the region is true for financial capital, but financial capital is more mobile than the physical capital (Fratianni, 2006). Fratinnia (2006) observed that national borders add three types of potential friction: formal trade barriers in the form of tariff and non-tariff protection, informal trade barriers, and exchange rates. However, it is noted that financial integration goes beyond the level of high capital mobility, even though, macroeconomic literature may deem capital mobility as international financial integration (Fratianni, 2006). But, it is noted that high capital mobility is not a sufficient condition for international financial integration, though, it is a necessary condition. According to Kenen (1976) that the argument was a revelation of Logue, Salant, and Sweeney when they observed that coordinated movements in interest rates can occur without capital movements and may prevent the need for such movements. Although, the line of argument of Logue, Salant, and Sweeney was not based on any systematic study of data but on observation of covariance of interest rates (Kenen, 1976). Fratinnia (2006) furthers that it takes more than removing restrictions to the flows of capital and foreign exchange transactions to achieve financial integration. Meanwhile, some of these barriers would be broken with the introduction of the regional economic community.
Therefore, the facilitation of financial integration becomes pragmatic in the regional economic community. To buttress this, Asian Development Bank (2013) and Khan et al. (2013) asserts that there are threshold conditions necessary for integration and these are; well-developed financial markets, high-quality institutions, good governance, sound macroeconomic policies, and trade integration. Meanwhile, trade integration is cardinal for this study because the existence of trade in the integration without precluding financial movement necessitate this study, as a point of emphasis. Financial integration can be achieved through regional integration agreement (Alhindi et al., 2013). This is possible through the elimination of cross-border restriction of financial openness. It is equally noted in the macroeconomics that financial integration could also come through the existence of foreign banks in the domestic economy and/or vice versa. ECOWAS has interlinking of banking institutions in member states. See the figure on the geographical distribution of pan-African banking as cited in Sy (2014).
17
However, financial integration is not without some benefits. According to Agenor (2003), financial integration could be beneficial in domestic smoothing consumption; supplementing domestic investment towards economic growth; enhancing macroeconomic discipline, and increasing banking system efficiency and financial stability. As such investment can be financed more cheaply in a developing country with a high return on domestic capital by borrowing from abroad than out of domestic saving alone. As well, investors from other countries can earn a higher return on their saving by investing in the developing/emerging market than they could domestically. Thus both countries involve benefit from the opportunity to smooth disturbances and diversify away from their risks. Despite the benefits of financial integration, there are barriers to it. According to Kenen (1976), the following could serve as barriers to integration:
Items list of capital controls has implication for the balance of payments or monetary reasons. That is, the government of any country may not allow individuals to hold a claim on foreigners, or some kind of claims or claims dominated in foreign currencies, perhaps, due to a shortage of hard currencies in the custody of a country. Most third world countries experience this when it becomes difficult for them to maintain the promising monetary policy. In Nigeria, a number of items have been banned, so that, an individual cannot lay claim to them in any way because of hard currencies involved in their respective transactions. Among the forty items banned in Nigeria for benefitting from official forex, the window is Eurobond/purchasing of shares.
Also, Ghana who is the 9th largest trade partner to Nigeria equally made a move and banned some
importations from Nigeria and some other countries. Both countries are a member of ECOWAS, and some others are affected (Nnabugwu, 2016).Dollarization of ECOWAS member countries asserted maximum impact on financial integration in the REC because the inflow of the United States of America Dollars (USD) into the REC depends on their supplies (mainly, primary or raw materials) to other countries. Therefore, scarcity of USD leads to the high exchange rate, which discourages trade and financial integration. Inhibiting specialized financial institutions such as pension funds and insurance companies in holding claims dominated in foreign currencies. A Larger share of the pension funds is to be invested domestically in the case of Nigeria. A similar situation might be applicable in other member states because generally African countries are bewildered with inadequate investible funds. Tax structure: the levies imposed on transactions and claims dominated in foreign currencies are usually on the high side, especially, before the popularization of online banking and other universal means of money transfer without involving the third party (financial institution) directly. Also, the imposition of income taxes as it happened in Eastern countries – Western countries of the world, in which the Eastern government imposes an income tax on all interest incomes earned by its own residents (Kenen, 1976).
Effect of Apex bank overview functions on commercial banks market dealings. Since Apex bank cannot control its total liabilities but reacts to prevent the exchange rate depreciation. A number of actions in achieving this will finally pave way for capital outflows (See kenen, 1976:27). This study adopts Harrod-Domar economic growth-model. The two variables of interest are key in explanations of the classic economic growth theories, of which one will be reviewed. From the Harrod-Domar Growth Model perspective, every economy must save a certain proportion of its national income, if only to take care of the wear and tear (depreciation) of its productive assets. However, the model pointed to the fact that new investment is imperative, and if this is actually important, then saving to spur new investment is as well important (Todaro & Smith, 2011). According to Todaro and Smith (2011) Harrod-Domar views the simple model thus:
Saving (S) is some proportion, s, of national income (Y) such that we have the simple equation
𝑆 = 𝑠𝑌 (1)
Net investment (I) is defined as the change in the capital stock, K, and can be represented by ∆K such that
𝐼 = ∆𝐾 (2)
But because the total capital stock, K, bears a direct relationship to total national income or output, Y, as expressed by the capital-output ratio, k, it follows that
𝐾
𝑌 = 𝑘 (3)
Or, finally,
∆𝐾 = 𝑘∆𝑌
Finally, net national savings, S, equal net investment, I, we can write this equality as
18
Equation 4 shows equality of saving to investment. It is expected that excess saving in any member countries will find its way to the country where it is needed for investment. The transnational trade would actually help in facilitating this, because of its financial involvement. The onerous task of critical strategies and logical policies implementation with respect to the integration would help in avoiding the error of inappropriateness in the integration as pointed out by Balassa (1961).Economic integration aims at increasing trade between states of economic unions towards Gross Domestic Products (GDP) of its members as well as better welfare for the citizens.
Saving-Investment Correlations: Feldstein and Horioka [FH] (1980) correlate saving and investment to measure the extent of capital mobility; the study used cross-section data to regress the specified model below:
𝐼 𝑌 𝑖 = 𝛼 + 𝛽 𝑆 𝑌 𝑖
Having the ratio of investment to income on the left-hand side of the equation and the ratio of saving to income on the right-hand side of the equation. The beta sign in the equation measures correlation degree between the two main variables in the equation. They are of the opinion that with the perfect capital mobility in the international market, saving and investment would be uncorrelated that is the coefficient of beta will equal to zero (0). If a beta-coefficient close to or equal to one would imply a low degree of capital mobility. In the opinion of FH, if domestic saving were added to a world saving pool and domestic investment competed for funds in that same world saving pool, there would be no correlation between a nation’s saving rate and its rate of investment (Feldstein & Bacchetta, 'National saving and international investment.' In national saving and economic performance, 1991). Some extant literature, which had studied one or more variables as it relates to this study are: Agudelo and Davidson (2006) measure changes in the degree of regionalization and globalization for the G7 countries (Canada, France, Germany, Italy, Japan, the UK, and the U.S.) between 1980 and 1997 using gravity equation. The study found that on average the group G7 traded 58 percent more with the similar-language countries than with dissimilar-language countries and that the common language effect reduces by 0.98 percent on yearly basis. Also, that distance decrease trade by 45.5 percent among other findings.
Fratianni (2006) studies effects of borders on integration using a linear form of gravity equation, and pooling of 97,803 observations. The study found that population growth retards bilateral trade flows. More so, trading costs, proxied by distance, and common land borders raise the total variation of independent variables on the dependent variable. Also, that country with common currency trade more than countries with common-border but without a common currency. Among some other findings, the study found countries with border sharing trade 79 percent more than other countries. Agudelo, Benitez, and Davidson (2006) work on evidence of increasing regionalization of international trade among 10 South American countries, ranging from 1980 to 2001 annualized data. The study adopted gravity equation and linearized the same to estimate the timing effects. The study found a positive effect between common language and trade. Also, that common language increases trade over time in the region, among other findings. Fratianni and Kang, (2006) investigate the effect of terrorism on bilateral trade flows. However, the study included some control variables which are of interest to this study as well. The study employed gravity equation. They found that common language still has a positive effect on trade in the face of terrorism, disasters, and institutional quality, and even when financial crises were included. Gidigbi (2016) investigates the impact of savings and investment on economic growth in Africa, using annualized data of 35 years period ranging from 1980 – 2014, and a cross-sectional feature of 30. The study adopted Panel EGLS method ranging from pooled, fixed and random effects to estimate the impact. The study found that capital is mobile on the African continent, and found saving-investment coefficient to be 0.36 for the continent. It concluded by advocating for more mobilization of savings in the continent.
3. Methodology
Basically, integration is measured by averages of differences between market prices and other more sophisticated indexes of convergence or dispersion (Kenen, 1976).Cheung, Chinn, and Fujii (2007) and, Baele, Ferrando, Hordahi, Krylova, and Monnet (2004) review the economic integration measurement and classified the measures into two broad categories thus: quantity-based measures and price-based measures. Trade and
19
financial market integration, output comovement, the Feldstein-Horioka criterion, and correlation of national consumption are the quantity-based measures. Among all the methods stated, this study prefers to use saving-investment correlation, which is referred to as the Feldstein-Horioka criterion. Even though, some scholars established that equality of saving-investment is necessary but it is not a sufficient condition for financial integration. Thereby, saving-investment equality only measures physical capital mobility. Meanwhile, the necessary conditions for test of financial integration base on the law of one price, the covered interest rate parity (CIRP) (Fratianni, 2006)
𝑖 − 𝑖∗− 𝑓𝑝 = 𝑖 − 𝑖∗ + 𝑖∗𝑜− 𝑖∗ + 𝑖𝑜− 𝑖∗𝑜− 𝑓𝑝
Where:
i = yield on domestic assets;
i* = yield on the comparable foreign asset;
fp = forward premium of the foreign currency (spot and forward rates are measured as units of domestic currency per unit of foreign currency); and
‘‘o’’ = offshore location. FH Criterion modelled thus:
𝐼 𝑌 𝑖 = 𝛼 + 𝛽 𝑆 𝑌 𝑖
It is expected that 𝛽=0 because it is expected that a shock to saving will only affect current account balance, and leave investment unchanged in a small open economy. But in a larger economy, opposite side is expected. More so, since a country can neither permanently lend nor borrow, the equality of slope is expected to be zero.
For physical capital, the relevant law of one price is real interest rate parity, which can be expressed as follows (Fratianni, 2006)
𝑟 − 𝑟∗= 𝑖 − 𝑖∗− 𝑓𝑝 + 𝑓𝑝 − ∆𝑒 + ∆𝑒 − 𝜋 − 𝜋∗ = 0
Where:
r = the ex-ante real rate of interest;
∆𝑒 = the expected depreciation of the home currency; and
𝜋 =the expected rate of inflation.
The real interest rate parity failed when it was put to test, and the development supported FH Criterion (Fratianni, 2006). This study used FH Criterion for the assessment, since, the expected zero value of the slope did not hold.
Model Specification: This study used saving-investment model (FH Criterion) to measure the financial integration in the community (ECOWAS) as rightly put forward in Cheung, Chinn, and Fujii (2007). The model specification followed the work of Feldstein and Horioka (1980), and Feldstein and Bacchetta, (1991).
𝐺𝐷𝐼 𝐺𝐷𝑃 𝑖,𝑡 = 𝛿0+ 𝛿1 𝐺𝐷𝑆 𝐺𝐷𝑃 𝑖,𝑡+ 𝜗𝑖,𝑡 (1) 𝐺𝐷𝐼 𝐺𝐷𝑃 𝑖,𝑡 = 𝛿0+ 𝛿1 𝐺𝐷𝑆 𝐺𝐷𝑃 𝑖,𝑡+ 𝛿2𝐷𝐶𝑜𝑚𝐿𝑎𝑛𝑔𝑖,𝑡+ 𝜗𝑖,𝑡 (2) 𝐺𝐷𝐼 𝐺𝐷𝑃 𝑖,𝑡 = 𝛿0+ 𝛿1 𝐺𝐷𝑆 𝐺𝐷𝑃 𝑖,𝑡+ 𝛿2𝑇𝐷𝑢𝑚𝑖,𝑡+ 𝜗𝑖,𝑡 (3) 𝐺𝐷𝐼 𝐺𝐷𝑃 𝑖,𝑡 = 𝛿0+ 𝛿1 𝐺𝐷𝑆 𝐺𝐷𝑃 𝑖,𝑡+ 𝛿2 𝐷𝐶𝑜𝑚𝐿𝑎𝑛𝑔 ∗𝑇𝐷𝑢𝑚 𝑖,𝑡+ 𝜗𝑖,𝑡 (4) 𝐺𝐷𝐼 𝐺𝐷𝑃 𝑖,𝑡= 𝛿0+ 𝛿1 𝐺𝐷𝑆 𝐺𝐷𝑃 𝑖,𝑡+ 𝛿2𝐷𝐶𝑜𝑚𝐿𝑎𝑛𝑔𝑖,𝑡+ 𝛿3𝑇𝐷𝑢𝑚𝑖,𝑡+ 𝜗𝑖,𝑡 (5) Where: 𝐺𝐷𝐼 = 𝐺𝑟𝑜𝑠𝑠 𝐷𝑜𝑚𝑒𝑠𝑡𝑖𝑐 𝐼𝑛𝑣𝑒𝑠𝑡𝑚𝑒𝑛𝑡 𝐺𝐷𝑆 = 𝐺𝑟𝑜𝑠𝑠 𝐷𝑜𝑚𝑒𝑠𝑡𝑖𝑐 𝑆𝑎𝑣𝑖𝑛𝑔𝑠 𝐺𝐷𝑃 = 𝐺𝑟𝑜𝑠𝑠 𝐷𝑜𝑚𝑒𝑠𝑡𝑖𝑐 𝑃𝑟𝑜𝑑𝑢𝑐𝑡𝑠 𝐷𝐶𝑜𝑚𝐿𝑎𝑛𝑔∗𝑇𝐷𝑢𝑚 = 𝐼𝑛𝑡𝑒𝑟𝑎𝑐𝑡𝑖𝑜𝑛 𝑜𝑓 𝑐𝑜𝑚𝑚𝑜𝑛 𝑙𝑎𝑛𝑔𝑢𝑎𝑔𝑒 𝑎𝑛𝑑 𝑡𝑖𝑚𝑒 𝑣𝑎𝑟𝑖𝑎𝑏𝑙𝑒 𝐷𝐶𝑜𝑚𝐿𝑎𝑛𝑔 = 𝐷𝑢𝑚𝑚𝑦 𝑜𝑓 𝑂𝑓𝑓𝑖𝑐𝑖𝑎𝑙 𝐿𝑎𝑛𝑔𝑢𝑎𝑔𝑒: 𝐸𝑛𝑔𝑙𝑖𝑠 = 1; 𝑎𝑛𝑑 𝑜𝑡𝑒𝑟𝑤𝑖𝑠𝑒 = 0 𝑇𝐷𝑢𝑚 = 𝑇𝑖𝑚𝑒 𝑉𝑎𝑟𝑖𝑎𝑏𝑙𝑒, 𝑠𝑡𝑎𝑟𝑡𝑠 𝑐𝑜𝑢𝑛𝑡𝑖𝑛𝑔 𝑓𝑟𝑜𝑚 𝑡𝑒 𝑦𝑒𝑎𝑟 𝑜𝑓 𝑐𝑟𝑒𝑎𝑡𝑖𝑜𝑛, 5 𝑓𝑜𝑟 1980 𝑎𝑛𝑑 𝑠𝑜 𝑜𝑛 𝜗 = 𝐸𝑟𝑟𝑜𝑟 𝑡𝑒𝑟𝑚. 𝑡 = 𝑡𝑖𝑚𝑒 𝑡𝑟𝑒𝑛𝑑 𝑖𝑑𝑒𝑛𝑡𝑖𝑓𝑖𝑒𝑟 = 1, 2, … , 35 . 𝑖 = 𝑐𝑟𝑜𝑠𝑠𝑠𝑒𝑐𝑡𝑖𝑜𝑛𝑎𝑙𝑑𝑖𝑚𝑒𝑛𝑠𝑖𝑜𝑛𝑖𝑑𝑒𝑛𝑡𝑖𝑓𝑖𝑒𝑟 = 1, 2, … , 15 .
A priori expectations: All the slopes in the model are expected to exhibit positive relationship, that is, they are all expected to be factors of financial integration in the community.
20
The study used Levin, Lin and Chu’s panel unit root test specification (Levin, Lin, & Chu, 2002) to test for the unit root property of the concerned variables:
∆𝑋𝑖,𝑡 = 𝑎𝑖+ 𝜌𝑋𝑖,t−1+ 𝛿𝑚∆𝑋𝑖,𝑡−m 𝑛
m=1
+ 𝛾𝑖𝑡 + 𝜃𝑡+ 𝑢𝑖,𝑡
Whereby the null hypothesis of this test according to Asteriou and Hall, (2007) is:
𝐻𝑜: 𝜌 = 0 𝐻𝑜: 𝜌 < 0
The expectation about the variables used prior to the estimation as stated in the models was that it should be -1≤ ρ ≤ 1 in order to disprove the issue of non-stationary/random walk/unit root as it might be called; because the existence of unit root in the test would signify autoregressive model.
4. Results and Discussion
The descriptive statistics as shown in Table 1 reveal the status of the variables used in the analysis. The mean values of 0.153416 and 0.094561 are very close to the centre values which are 0.156481 and 0.080325 for the ratio of gross domestic investment and gross domestic product, and gross domestic savings and gross domestic product respectively. The dis-investing and dis-saving in some years, in some countries almost had the effect of statistical lies on the outputs. Even though the average value of the investment is greater than that of savings but savings at some points was higher than investment and the minimum value resides in investment. This is not out of range because it is reasonable to dis-save than to dis-invest. Deviation value of the investment is lower than that of saving. The broad essence of Skewness and kurtosis statistics are captured in Jarque-Bera statistic. Both investment and savings Jarque-Bera statistics of 11.4625 and 4422.896 respectively, and its probability values of 0.003243 and 0 respectively suggest the non-normal distribution of data. There is the tendency of committing type I or II error in working with t and/or F-tests if these data were not corrected (See Table 1 for all the statistic values as concerned).Although, it is assumed that the data used were approximately normally distributed in accordance with the Central Limit Theorem (CLT) since the observation is greater than 30. Notwithstanding, weight is applied in the panel regression analysis, as a means of correcting for the normality issue.
Table 1: Descriptive Statistics
Variable Mean Median Max Min Std. Dev. Skewness Kurtosis Jarque-Bera Prob. Obs.
𝐺𝐷𝐼 𝐺𝐷𝑃 𝑖𝑡 0.1534 0.1564 0.4839 -0.0242 0.0953 0.3346 3.2756 11.4625 0.003243 525
𝐺𝐷𝑆 𝐺𝐷𝑃 𝑖𝑡 0.0945 0.0803 0.9079 -0.2210 0.1105 2.4401 16.3556 4422.89 0 525
Source: Authors’ Computation using EViews 8.
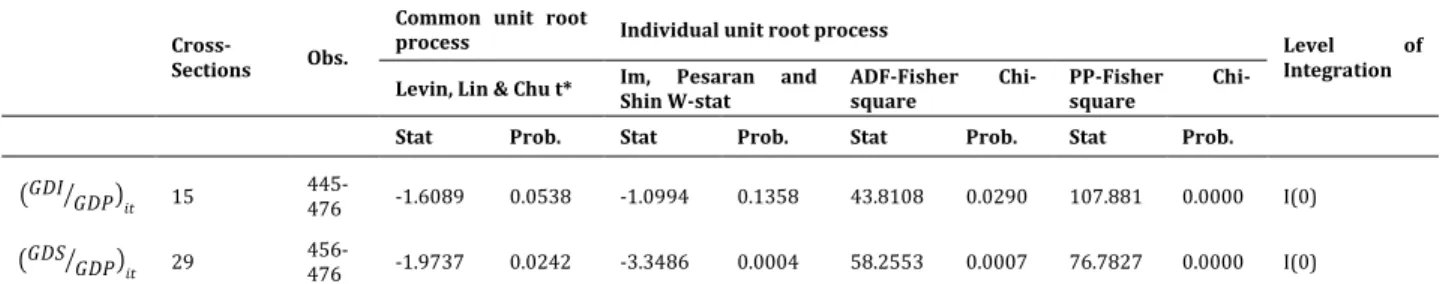
The panel unit-root tests carried out show that both variables are stationary at level. Common unit root process by Levin Lin and Chu t* with statistics -1.60897 and -1.97375, with probability values of 0.0538 and 0.0242 for both investment and savings respectively, indicate the stationarity of the series. Although, Im, Pesaran and Shin W-stat with a probability value of 0.1358 for the statistical value of -1.09947 for investment shows that it is not stationary. But with other two individual unit root process statistics of ADF-Fisher Chi-square and PP-Fisher Chi-Chi-square proving otherwise, together with the outcome of common unit root process discussed earlier on for the variable, it is believed that it is stationary at level.
Table 2: Unit-Root Tests Cross-
Sections Obs.
Common unit root
process Individual unit root process Level of Integration Levin, Lin & Chu t* Im, Pesaran and Shin W-stat ADF-Fisher square Chi- PP-Fisher square
Chi-Stat Prob. Stat Prob. Stat Prob. Stat Prob.
𝐺𝐷𝐼 𝐺𝐷𝑃𝑖𝑡 15 445- 476 -1.6089 0.0538 -1.0994 0.1358 43.8108 0.0290 107.881 0.0000 I(0) 𝐺𝐷𝑆 𝐺𝐷𝑃𝑖𝑡 29 456-476 -1.9737 0.0242 -3.3486 0.0004 58.2553 0.0007 76.7827 0.0000 I(0)
21
This study does not report estimations based on pooled regression and effects pooled regression. Since the descriptive statistic outputs suggest applying of weight to correct for the possible case of heteroscedasticity, and weight does not go with fixed effect regression most times as a result of a technical issue which cannot but affect the way data was planned for the study. More so, the output from Estimated Generalized Least Squares (EGLS) usually better than that of random effects. In addition, since the unit-root tests for the two variables certified that they are both stationary at level; this study thereby proceeded to report of Panel Regression Estimations. Estimation results for all the specified models are reported in Table 3. All the estimations were based on Panel EGLS with cross-sectional SUR weight because data were stacked to make up its cross-sectional features. The output from Model 1, which is the based model shows that capital is mobile within the regional economic community (REC). Even though, the capital movement is high a bit compared to what is obtained in most developed economies of the world (Feldstein & Bacchetta, 1991). On average, this finding rarely differs from what was obtained for Africa as a continent in Gidigbi (2016). The independent coefficient of 0.3486 implies that only 34.86 percent was not actually mobile within the REC. The F-statistic of 559.16 with probability value less than one shows that the model is jointly significant at 1 percent significance level. More so, the regressor accounts for 51.67 percent variation in the regressand. Model 2 is an improved model 1. Dummy of a common language was introduced to compliment the independent variable here. The common language reckoned with was the state official language. DComLang is equal to exponential (-0.050016) – 1 or -4.87 percent. This implies that common language decreases financial integration in the REC by 4.87 percent. However, this finding is contrary to the finding of Agudelo and Davidson (2006). The English Language is a common language for few member states, and the majority of states in the REC do not have the English Language as their official/working language. In this case, saving-investment retention increased to 37.90 percent, that is, the interplay of language as a negative impact factor further discourage integration in the REC. All coefficients discussed here are statistically significant at 1 percent significance level. The model was jointly significant at 1 percent significance level as shown by the F-statistic value of 385.0718 with probability value less than one.
Model 3 is a further improvement on Model 1, by introducing a time variable, which starts counting from REC active date. Time variable coefficient of 0.001638 equal to exponential (0.001638)-1 or 0.16 percent. Year of existence has a positive effect on the financial integration in the community. It aids financial integration in the community by 0.16 percent. This is statistically relevant at 1 percent significance level. Saving-investment retention decreased to 33.89 percent as well, this is statistically significant at 1 percent significance level as well. The explanatory variables in the model account for 57.59 percent of the total variation in the dependent variable. The model was jointly significant at 1 percent significance level as the F-statistic stands at 354.4211 with probability value less than one.
Model 4 still a further improvement on Model 1 by introducing interactive variable between dummy of common language and time variable. The interactive coefficient indicates that inhibition of common language towards financial integration diminishes over years. The interactive coefficient, which is equal to exponential (-0.001247) -1 =-0.12 percent. This finding was statistically significant at 1 percent significance level. The common language which stood at 4.87 in model 2, now with the interaction of time variable; it reduces to 0.12 percent. This implies that as the REC will continue to work harmoniously towards her ultimate goals as stated in her article, there is a good tendency that language would no longer inhibit her integration, from financial wise to other aspects of integration as targeted by the REC. The model’s explanatory variables account for 54.71 percent of the total variation in the dependent variable. More so, the F-statistic of 315.3426 and its probability value less than one indicates the joint significance of the variables in the model. Model 5 is an improved model, and precisely in model 2. Even though, all the models built on model 1. Still, the coefficient of English language as a common language equals exponential (-0.049716) – 1 or -4.85 percent, and this inhibit the financial integration in the REC. This is statistically significant at 1 percent significance level. The coefficient of time variable equals exponential (0.001604) – 1 or 0.16 percent. This shows that REC’s years of existence further financial integration by 0.16 percent. The coefficient, which is statistically significant at 1 percent as well. The explanatory variable in the model explained for 64.61 percent of total variation of the dependent variable. Also, the F-statistic of 317.1387 and its probability value less than one indicates the joint significance of the variables in the model.
22
Table 3: Model EstimationsMethod: Panel EGLS with Dependent Variable: 𝑮𝑫𝑰 𝑮𝑫𝑷
𝒊𝒕
Variable Model 1 Model 2 Model 3 Model 4 Model 5
C 0.121781*** 0.135396*** 0.086708*** 0.128560*** 0.100980*** (0.002255) (0.002044) (0.004261) (0.002160) (0.003713) [53.99978] [66.24625] [20.35125] [59.52673] [27.19316] 𝐺𝐷𝑆 𝐺𝐷𝑃 𝑖𝑡 0.348669*** 0.379019*** 0.338926*** 0.373576*** 0.369470*** (0.014735) (0.014811) (0.014666) (0.015006) (0.014583) [23.66231] [25.59074] [23.10955] [24.89483] [25.33500] 𝐷𝐶𝑜𝑚𝐿𝑎𝑛𝑔 --- -0.050016*** --- --- -0.049716*** (0.003455) (0.003444) [-14.47647] [-14.43466] 𝑇𝐷𝑢𝑚 --- 0.001638*** --- 0.001604*** (0.000176) (0.000151) [9.281782] [10.61526] 𝐷𝐶𝑜𝑚𝐿𝑎𝑛𝑔∗𝑇𝐷𝑢𝑚 --- -0.001247*** --- (0.000152) [-8.188283] Weighted Statistics R-squared 0.516707 0.596020 0.575900 0.547144 0.646160 Adjusted R2 0.515783 0.594472 0.574275 0.545409 0.644122 F-statistic 559.1601*** 385.0718*** 354.4211*** 315.3426*** 317.1387*** DW Stat 1.193379 1.238391 1.195809 1.210042 1.233701 Unweighted Statistics R-squared 0.174699 0.236116 0.204040 0.198080 0.264265 Durbin-Watson stat 0.510289 0.536477 0.521754 0.521269 0.547509 Observations 525 525 525 525 525
Source: Authors’ Computation using Eviews 8.
NB: The value in the bracket is Standard Error, and the t-statistic value is in the parenthesis. *** Indicates that the p-value is statistically significant at 1 percent significance level. ** Indicates that the p-value is statistically significant at 5 percent significance level. * Indicates that the p-value is statistically significant at 10 percent significance level. 5. Conclusion
The study concludes that financial integration exists in the REC. As a result of the free flow of capital within the community. Even though, the pointer as observed in the specified Model 1 for this study shows that the level of financial openness in the REC is almost the same with what was observed for Africa. Therefore, there is need to carry out a comparative study on the financial openness in the REC and the Africa as a continent, in order to ascertain whether there is the difference between the two. More so, the language in the REC inhibit financial openness as 8 member states are French speakers, 2 member states are Portuguese speakers, and 5 member-states speak the English language. However, financial openness inhibition by language diminishes over time. Language inhibition will totally become extinct as time goes on due to penetration of financial institution into member states, and rapid financial innovations currently experiencing in the REC and Africa in general. Also, computer ergonomics that facilitate usage of user preferred language, especially for the financial institution will further aid financial openness in the community since language serves as a
23
barrier.Low trade substantiality still inhibit financial integration, as most member states still have substantial trade with the developed and superpower countries. Therefore, there is need to speed up all common tariff policy by the REC towards trade substantiality among member states. Further, the existence of trade diversion would aid financial openness the more. The existence of financial openness would further the course of monetary union in the community but there is a need for more industrialization in order to enhance trade diversion for the absolute benefit of the integration to come up. As a point of emphasis, there is the existence of financial integration in the REC, and the REC has a basis for the introduction of the monetary union if so wish, but more can still be done in improving on the level of the existing financial integration. Trade diversion and common tariff policy should be among the cardinal focus of the REC. Also, member state should not withdrawal, so as to enjoy the long-run benefit of the REC. Objectively; it would be scholarly reasonable, if some other listed methods of testing for financial integration can be implemented to compare the results.
References
Agbonkhese, A. O. & Adekola, A. G. (2014). Regional economic integration in developing countries: A case study of Nigeria; A member of ECOWAS. European Scientific Journal, 10(19), 359 - 374.
Agenor, P. R. (2003). Benefits and costs of international financial integration. Oxford, United Kingdom: Blackwell Publishing Ltd.
Agudelo, D. & Davidson, L. S. (2006). The gravity of globalization. Research in Global Strategic Management,
12, 79-103.
Agudelo, D., Benitez, G. J. & Davidson, L. S. (2006). A South American perspective: Regional versus global trade patterns. Research in Global Strategic Management, 12, 105-130.
Asian Development Bank. (2013). The road to ASEAN financial integration: A combined study on assessing the financial landscape and formulating milestones for monetary and financial integration in ASEAN. Mandaluyong: Asian Development Bank.
Asteriou, D. & Hall, S. G. (2007). Applied Econometrics: A modern approach (Revised Edition ed.). New York: Palgrave Macmillan.
Baele, L., Ferrando, A., Hordahi, P., Krylova, E. & Monnet, C. (2004). Measuring financial integration in the Euro Area. Occasional Paper Series, 14, 1-98.
Balassa, B. (1961). The theory of Economic Integration: Greenwood Publishing Group.
Brown, V. W. (1982). Economic Community of West African States (ECOWAS). International Science & Technology Institute, Inc., Washington, D. C.
Cheung, Y. W., Chinn, M. D. & Fujii, E. (2007). The economic integration of greater China: Real and financial linkages and the prospects for currency union. Aberdeen: Hong Kong University Press.
ECOWAS. (2012). 2012 Annual Report Integration and Political Stability in West Africa. Abuja: ECOWAS. ECOWAS. (1976). Treaty of the Economic Community of West African States (ECOWAS). United Nations -
Treaty Series, 1010 (1-14843), 17 - 41.
Engle, R. F. & Granger, C. W. (1987). Co-integration and error correction: Representation, estimation, and testing. Econometrica, 55, 251 - 276.
Feldstein, M. & Bacchetta, P. (1991). 'National saving and international investment.' In national saving and economic performance. In B. D. Bernheim, & J. B. Shoven (Ed.), NBER project report (pp. 201 - 226). Chicago: University of Chicago Press.
Feldstein, M. & Horioka, C. (1980). Domestic Saving and International Capital Flows. The Economic Journal,
90(358), 314 - 329.
Fratianni, M. (2006). Borders and Integration. (M. Fratianni, Ed.) Research in Global Strategic Management,
12, 11 -38.
Fratianni, M. & Kang, H. (2006). International terrorism, international trade, and borders. Research in Global Strategic Management, 12, 203-223.
Gidigbi, M. O. (2016). Assessement of the impact of savings and investment on economic growth in some selected African countries. Modibbo Adama University of Technology, Economics Department. Yola: Unpublished.
Guillaume Gaulier, S. J. & Unal-Kesenci, D. (2006). Explaining regionalisation via relative trade intensities. In S. J. Guillaume Gaulier, D. Unal-Kesenci, & P. D. Lombaerde (Ed.), Assessment and measurement of regional integration (pp. 86-106). New York, USA: Routledge.
24
Kenen, P. B. (1976). Capital mobility and financial integration: A survey. Princeton Studies in International Finance, 39, 1-92.
Khan, F., Muneer, S. & Ahmad, A. M. (2013). Relationship between stock prices and economic variables: Sectoral analysis. Actual Problems of Economics, 5, 544-553
Kleimeier, S. & Sander, H. (2000). Regionalisation versus globalisation in European financial market integration: Evidence from co-integration analyses. Journal of Banking and Finance, 24, 1005 - 1043. Levin, A., Lin, C. & Chu, C. (2002). Unit root tests in panel data: Asymptotic and finite-sample properties.
Journal of Econometrics, 108, 1 - 24.
Lombaerde, P. D. & Van Langenhove, L. (2006). Indicators of regional integration: conceptual and methodological aspects. In P. D. Lombaerde, & P. D. Lombaerde (Ed.), Assessment and Measurement of Regional Integration (pp. 9 - 41). Abingdon, United Kingdom: Routledge, Taylor & Francis Group. Nnabugwu, F. (2016). Ghana bans goods from Nigeria, other countries. Retrieved from Vanguard News:
http://www.vanguardngr.com/2016/02/ghana-bans-goods-from-nigeria-other-countries/
Pedroni, P. (1999). Critical values for cointegration tests in heterogeneous panels with multiple regressors.
Oxford Bulletin of Economics and Statistics, 61, 653 - 670.
Pedroni, P. (2004). Panel cointegration: Asymptotic and finite sample properties of pooled time series tests with an application to the PPP hypothesis. Econometric Theory, 20, 653 - 670.
Robert, R. (2004). The social dimension of regional integration in ECOWAS. International Labour Office, Policy Integration. Geneva: International Labour Organization.
Spengler, J. J. (1949). Theories of Socioeconomic Growth. In U. -N. Bureau, Problems in the Study of Economic Growth (pp. 45 - 114). NBER.
Sy, A. (2014). Four instruments to strengthen financial integration in Sub-Saharan Africa. Working Paper in Development Policies, 108, 1-18.
Todaro, M. P. & Smith, S. C. (2011). Economic Development. Harlow-Essex, England: Pearson Education Limited.
25
APPENDIXModel 1
Dependent Variable: GDI_GDP
Method: Panel EGLS (Cross-section SUR) Date: 07/14/16 Time: 22:19
Sample: 1980 2014 Periods included: 35 Cross-sections included: 15
Total panel (balanced) observations: 525
Linear estimation after one-step weighting matrix
Variable Coefficient Std. Error t-Statistic Prob.
GDS_GDP 0.348669 0.014735 23.66231 0.0000
C 0.121781 0.002255 53.99978 0.0000
Weighted Statistics
R-squared 0.516707 Mean dependent var 1.969134 Adjusted R-squared 0.515783 S.D. dependent var 3.312244 S.E. of regression 1.000666 Sum squared resid 523.6964 F-statistic 559.1601 Durbin-Watson stat 1.193379 Prob(F-statistic) 0.000000
Unweighted Statistics
R-squared 0.174699 Mean dependent var 0.153416 Sum squared resid 3.931892 Durbin-Watson stat 0.510289
Model 2
Dependent Variable: GDI_GDP
Method: Panel EGLS (Cross-section SUR) Date: 07/17/16 Time: 13:58
Sample: 1980 2014 Periods included: 35 Cross-sections included: 15
Total panel (balanced) observations: 525
Linear estimation after one-step weighting matrix
Variable Coefficient Std. Error t-Statistic Prob.
GDS_GDP 0.379019 0.014811 25.59074 0.0000
COMLANG -0.050016 0.003455 -14.47647 0.0000
C 0.135396 0.002044 66.24625 0.0000
Weighted Statistics
R-squared 0.596020 Mean dependent var 2.373821 Adjusted R-squared 0.594472 S.D. dependent var 4.189125 S.E. of regression 1.000787 Sum squared resid 522.8225 F-statistic 385.0718 Durbin-Watson stat 1.238391 Prob(F-statistic) 0.000000
26
R-squared 0.236116 Mean dependent var 0.153416 Sum squared resid 3.639287 Durbin-Watson stat 0.536477 Model 3
Dependent Variable: GDI_GDP
Method: Panel EGLS (Cross-section SUR) Date: 07/17/16 Time: 13:42
Sample: 1980 2014 Periods included: 35 Cross-sections included: 15
Total panel (balanced) observations: 525
Linear estimation after one-step weighting matrix
Variable Coefficient Std. Error t-Statistic Prob.
GDS_GDP 0.338926 0.014666 23.10955 0.0000
TDUM 0.001638 0.000176 9.281782 0.0000
C 0.086708 0.004261 20.35125 0.0000
Weighted Statistics
R-squared 0.575900 Mean dependent var 2.513285 Adjusted R-squared 0.574275 S.D. dependent var 3.228049 S.E. of regression 1.001829 Sum squared resid 523.9112 F-statistic 354.4211 Durbin-Watson stat 1.195809 Prob(F-statistic) 0.000000
Unweighted Statistics
R-squared 0.204040 Mean dependent var 0.153416 Sum squared resid 3.792106 Durbin-Watson stat 0.521754
Model 4
Dependent Variable: GDI_GDP
Method: Panel EGLS (Cross-section SUR) Date: 07/17/16 Time: 14:10
Sample: 1980 2014 Periods included: 35 Cross-sections included: 15
Total panel (balanced) observations: 525
Linear estimation after one-step weighting matrix
Variable Coefficient Std. Error t-Statistic Prob.
GDS_GDP 0.373576 0.015006 24.89483 0.0000
COMLANGTDUM -0.001247 0.000152 -8.188283 0.0000
C 0.128560 0.002160 59.52673 0.0000
Weighted Statistics
R-squared 0.547144 Mean dependent var 1.994847 Adjusted R-squared 0.545409 S.D. dependent var 3.702359 S.E. of regression 1.000993 Sum squared resid 523.0368
27
F-statistic 315.3426 Durbin-Watson stat 1.210042 Prob(F-statistic) 0.000000
Unweighted Statistics
R-squared 0.198080 Mean dependent var 0.153416 Sum squared resid 3.820500 Durbin-Watson stat 0.521269 Model 5
Dependent Variable: GDI_GDP
Method: Panel EGLS (Cross-section SUR) Date: 07/20/16 Time: 08:25
Sample: 1980 2014 Periods included: 35 Cross-sections included: 15
Total panel (balanced) observations: 525
Linear estimation after one-step weighting matrix
Variable Coefficient Std. Error t-Statistic Prob.
GDS_GDP 0.369470 0.014583 25.33500 0.0000
COMLANG -0.049716 0.003444 -14.43466 0.0000
TDUM 0.001604 0.000151 10.61526 0.0000
C 0.100980 0.003713 27.19316 0.0000
Weighted Statistics
R-squared 0.646160 Mean dependent var 2.808615 Adjusted R-squared 0.644122 S.D. dependent var 4.273945 S.E. of regression 1.002063 Sum squared resid 523.1520 F-statistic 317.1387 Durbin-Watson stat 1.233701 Prob(F-statistic) 0.000000
Unweighted Statistics
R-squared 0.264265 Mean dependent var 0.153416 Sum squared resid 3.505179 Durbin-Watson stat 0.547509