1
Resource Use Measure Evaluation Form Version 2.0
This form contains the information submitted by measure developers/stewards, organized according to NQF’s measure evaluation criteria and process. For more information about Resource Use Measures and the Resource Use measure evaluation criteria, please visit the Cost & Resource Use Project Page.
Developer submission items are indicated by Blue Text
Questions to be answered by the Steering Committee about the criteria are indicated by Red Text NQF Generic Rating Scale (for use unless otherwise indicated)
High - Based on the information submitted, there is high confidence (or certainty) that the criterion is met
Moderate - Based on the information submitted, there is moderate confidence (or certainty) that the criterion is met
Low - Based on the information submitted, there is low confidence (or certainty) that the criterion is met
Insufficient - There is insufficient information submitted to evaluate whether the criterion is met (e.g., blank, incomplete, or not relevant, responsive, or specific to the particular question)
Reviewer Name:
Date:
Descriptive Measure Information
Measure Number and Name:#2158 Payment-Standardized Medicare Spending Per Beneficiary (MSPB) Steward:Centers for Medicare and Medicaid Services
Description:The MSPB Measure assesses the cost of services performed by hospitals and other healthcare providers during an MSPB hospitalization episode, which comprises the period immediately prior to, during, and following a patient’s hospital stay. Beneficiary populations eligible for the MSPB calculation include Medicare beneficiaries enrolled in Medicare Parts A and B who were discharged from short-term acute hospitals during the period of performance.
Resource Use Measure Type:Per episode Data Source:Administrative claims Level of Analysis:Facility
Costing Method:Standardized pricing Target Population:Senior Care
Resource Use Service Categories:Inpatient services: Inpatient facility services; Inpatient services: Evaluation and management; Inpatient services: Procedures and surgeries; Inpatient services: Imaging and diagnostic; Inpatient services: Lab services; Inpatient services: Admissions/discharges; Ambulatory services: Outpatient facility services; Ambulatory services: Emergency Department; Ambulatory services: Evaluation and management; Ambulatory services: Procedures and surgeries; Ambulatory services: Imaging and diagnostic; Ambulatory services: Lab services; Durable Medical Equipment (DME)
1. Importance to Measure and Report
Resource use measures will be evaluated based on the extent to which the specific measure focus is important to making significant contributions toward understanding healthcare costs for a specific high-impact aspect of healthcare where there is variation or a demonstrated high-impact aspect of healthcare (e.g., affects large numbers, leading cause of morbidity/mortality, variation in resource use [current and/or future], severity of illness, and patient/societal consequences of poor quality) or overall poor performance. Candidate consensus standards must be judged to be important to measure and report in order to be evaluated against the remaining criteria.
1a. High Priority
The measure focus addresses:
A specific national health Goal/Priority identified by DHHS or the National Priorities
To what extent does the summary of evidence of high
Partnership convened by NQF:
OR
A demonstrated high-impact aspect of healthcare (e.g., affects large numbers, leading cause of morbidity/mortality, high resource use [current and/or future], severity of illness, and patient/societal consequences of poor quality).
IM.1. Demonstrated High Impact Aspect of Healthcare Affects large numbers; High resource use
If other: N/A
IM.1.1. Summary of Evidence of High Impact (Provide epidemiologic or resource use data) NQF’s Measure Application Partnership (MAP) has already determined the MSPB Measure is an important measure that has potential for high impact. A 2012 NQF Pre-rulemaking report stated that “MAP strongly supports the direction of this measure pending additional specification and testing.” [1] Similarly, the January 2013 MAP pre-rulemaking draft report states, “Recognizing the need for more measures addressing affordability, MAP agreed that additional cost measures should be included in the program measure set. MAP supported the Medicare Spending per Beneficiary measure”. [2] The content below contains further evidence of the high impact nature of this measure. The scientific acceptability section discussed later in this application provides the additional specification and testing needed to meet NQF’s stringent quality measure standard.
The growth of health care expenditures has put enormous strain on federal and state budgets, employers and families. Health expenditures in the United States neared $2.6 trillion in 2010, over ten times the $256 billion spent in 1980. [3] Although the rate of growth in recent years has slowed relative to the late 1990s and early 2000s, health care spending is still projected to grow faster than national income over the foreseeable future. [4] Further, CBO projects that federal spending on Medicare, Medicaid, and CHIP will increase from 5.6 percent of GDP in 2011 to 19.4 percent of GDP in 2085. [5] The most recent U.S. economic recession has put even more
attention on health spending and affordability. [3] Since 2001, employer-sponsored health coverage for family premiums have increased by 113% and to address the rising cost employers have been shifting an increasing share of the cost burden on employees. [6] The aging of the baby boomer generation into retirement will cause Medicare to direct an increasing proportion of the health care resources in the U.S. [1], [7] Due to this enrollment growth as well as the growth in Medicare per capita spending, federal and state healthcare budgets are strained. In total, health spending accounted for 17.9% of the Nation’s Gross Domestic Product (GDP) in 2010. [8]
Despite the fact that the U.S. leads the world in health expenditures per capita, the value that patients receive for these expenditures may be below that of other countries. [9] In particular, one source of inefficiency that creates rising healthcare costs includes payment systems that reward medical inputs rather than outcomes. [10] Transforming Medicare and other public and private insurers from systems that reward volume of service to ones that reward efficient, effective care and reduce delivery system fragmentation offers the possibility of reducing cost and improving patient outcomes.
To advance this transformation, CMS instituted the MSPB Measure. Recent legislation— specifically Section 1886(o)(2)(B)(ii) of the Social Security Act, as established by Section 3001 of the Patient Protection and Affordable Care Act (Affordable Care Act)—requires that CMS implement a measure of Medicare Spending Per Beneficiary as part of it Hospital Value-Based Purchasing (VBP) initiatives. By measuring the cost of care through a measure of Medicare Spending Per Beneficiary, CMS aims to recognize hospitals that can provide high quality care at a lower cost to Medicare.
Citations available in Appendix B
impact support the categories listed in IM.1.? ☐ High
☐ Moderate ☐ Low ☐ Insufficient
3 1b. Opportunity for Improvement
Demonstration of resource use or cost problems and opportunity for improvement, i.e., data demonstrating variation in the delivery of care across providers and/or population groups (disparities in care).
IM.2.1. Briefly explain the benefits (improvements in performance) envisioned by use of this measure.
Care coordination helps ensure a patient’s needs and preferences for care are understood, and that those needs and preferences are shared between providers, patient, and families as a patient moves from one healthcare setting to another. People with chronic conditions, such as diabetes and hypertension, often receive care in multiple settings from numerous providers. As a result, care coordination among different providers is required to avoid waste, over-, under-, or misuse of prescribed medications and conflicting plans of care.
The MSPB Measure is designed to promote higher quality care for beneficiaries by financially incentivizing hospitals to improve care coordination, deliver efficient, effective care, and reduce delivery system fragmentation. For instance, hospitals can decrease (i.e., improve) their MSPB Amount through actions such as: 1) improving coordination with post-acute providers to reduce the likelihood of hospital readmissions, 2) identifying unnecessary or low-value post-acute services and reduce or eliminate these services, or 3) shifting post-acute care from more expensive services (e.g., skilled nursing facilities) to less expensive services (e.g., home health) in cases that would not affect patient outcomes.
CMS includes the MSPB Measure within the Hospital VBP program as a measure of efficiency; the Hospital VBP program, however, also provides financial incentives to hospitals based on their performance on additional quality measures. By measuring the cost of care through the MSPB Measure in combination with these other quality measures, CMS aims to incentivize value in healthcare by recognizing hospitals that can provide high quality care at a lower cost to Medicare.
IM.2.2. Summary of Data Demonstrating Performance Gap (Variation or overall less than optimal performance across providers)
Improved care coordination in the time period surrounding a hospital admission offers the possibility of reducing post-acute care cost and also decreasing the probability of a hospital readmission. Reducing post-acute care cost is of significant interest to policymakers as increased post-acute care utilization has been one of the key drivers of healthcare spending growth in recent years. From 2004 to 2010, long-term care costs have grown 4.7% to 6.6% per year, or a total increase of 31% to 47%, depending on the type of care. From 2008 to 2010, home health care costs increased an average of 13% - up from the 5% increase from 2006-2008. [1] Yet a number of studies have found that hospitals can identify individuals at high risk of permanent skilled nursing facility placement at the time of hospital discharge. [2] Improved discharge planning may improve the chances that these patients can return home.
In a 2007 report to Congress, the Medicare Payment Advisory Commission (MedPAC) estimated that in 2005, 17.5% of hospital patients were readmitted within 30 days of discharge and that 76% of these readmissions were potentially preventable. [3] Readmissions within 30 days of discharge cost Medicare more than $17 billion annually. [4]
Numerous studies have also found an association between quality of inpatient or transitional care and readmission rates for a wide range of conditions. [5], [6], [7], [8], [9], [10], [11], [12]. Randomized controlled trials, however, have shown that improvement in care coordination—in particular, improved discharge planning—can directly reduce readmission rates. [13], [14], [15], [16], [17], [18].
The MSPB Measure can be one mechanism to alter provider payments from volume-based to outcomes/efficiency based payments. The fee-for-service system of provider payment is also increasingly viewed as an obstacle to achieving effective, coordinated, and efficient care as it rewards the overuse of services, duplication of services, use of costly specialized services, and
To what extent does the information presented demonstrate this
measurement area as a cost problem or that there is variation in resource across entities?
☐ High ☐ Moderate ☐ Low ☐ Insufficient
involvement of multiple physicians in the treatment of individual patients. It does not reward the prevention of hospitalization or re-hospitalization, effective control of chronic conditions, or care coordination. Pay for performance is one strategy for moving from payment based solely on the quantity of services rendered to payment based on the quality or efficiency of care. Most designs reward clinically high-quality care or patient-centered care; few reward care coordination or increased efficiency over time in the treatment of a particular condition. [19], [20]
IM.2.4. Summary of Data on Disparities by Population Group (for example by race/ethnicity, gender, age, insurance status, socioeconomic status, and/or disability, etc. If you do not have data on your specific measure, perform a literature search/review and report data for the measure or similar appropriate concept.)
The MSPB Measure gauges care provided in the period immediately prior to, during, and in the 30 days after a hospital discharge; a number of studies have shown that socioeconomic status affects the amount of resources used during the period in which patients are hospitalized as well as during post-acute care. Whereas one quarter of Medicare beneficiaries with incomes less than $20,000 percent used inpatient services in a given year, only 17 percent of patients earning over $30,000 per year used inpatient services. Beneficiaries with incomes below $20,000 are also twice as likely to use home health services as Medicare beneficiaries earning more than $30,000. [1] End-of-life care for black and Hispanic beneficiaries is substantially different than the end-of-life hospital services that white Medicare beneficiaries receive. Much of the variation is due to differences in utilization levels among hospitalized patients. Blacks and Hispanics are significantly more likely to be admitted to the ICU than whites, and minorities also receive significantly more intensive procedures, such as resuscitation and cardiac convers, mechanical ventilation, and gastrostomy for artificial nutrition. [2] Further, there also exists significant regional variation in the inpatient procedures received by patients of different races. Whites, for example, get almost three times as many carotid endarterectomies as blocks, and 30 percent more angiograms. On the other hand, blacks have higher rates of admission to the ICU in their last six months of life. On average, black enrollees have more money spent on them, particularly near the end of life, but receive less highly effective interventions. [3] In addition, a number of studies have shown that the quality of post-acute care varies across patient socioeconomic status. For example, an analysis of 30-day readmission rates revealed that among elderly Medicare beneficiaries, black patients were more likely to be readmitted after hospitalization for acute myocardial infarction (AMI), congestive heart failure (CHF), and pneumonia, a gap that was related to both race and to the site where care was received. Specifically, black patients had higher readmission rates than white patients across all three conditions, and patients from minority-serving hospitals had higher readmission rates than non-minority-serving hospitals. [4] Citations available in Appendix B
1c. Measure Intent
The intent of the resource use measure and the measure construct are clearly described.
AND
The resource use service categories (i.e., types of resources/costs) that are included in the resource use measure are consistent with and representative of the intent of the measure. IM.3.1. Describe intent of the measure and its components/ Rationale (including any citations) for analyzing variation in resource use in this way.
The Medicare Spending Per Beneficiary efficiency measure aims to incentivize hospitals to coordinate care and reduce unnecessary utilization during the period immediately prior to, during, and in the 30 days after a hospital discharge. Currently, Medicare’s prospective payment system (PPS) reimburses hospitals on a case mix-adjusted, flat-rate basis, incentivizing hospitals to serve patients as efficiently as possible. Hospitals, however, could also have an incentive to discharge patients early to reduce their own cost. Such early discharge of patients decreases quality of care and increases costs to Medicare. For example, early discharge of patients has
To what extent do the categories of costs
represented by the resource use service categories (listed in S.7.7.) support the stated intent of the measure? (i.e., are all of the resource use service categories
represented that should be? Are any missing?)
☐ High ☐ Moderate
5 been shown to lead to avoidable re-hospitalizations. [1] It has been estimated that readmissions
within 30 days of discharge cost Medicare more than $17 billion annually. [2] A 2006
Commonwealth Fund report further estimated that if national readmission rates were lowered to the levels achieved by the top performing regions, Medicare would save $1.9 billion annually. [3] Improved care coordination between acute and post-acute providers could stem the rising cost of post-acute care through avenues such as reducing unnecessary hospital readmission. From 2004 to 2010, long-term care costs have grown by 31% to 47% (i.e., 4.7% to 6.6% per year), depending on the type of care; from 2008 to 2010, home health care costs increased an average of 13% - up from the 5% increase from 2006-2008. [4]
Unlike other measures reported on Hospital Compare, the MSPB Measure is not condition-specific; because a hospital’s MSPB Measure is based on all Medicare Part A and Part B claims data for episodes during the period of performance, the MSPB Measure evaluates hospitals’ efficiency across all conditions. The all-cause nature of the MSPB measure allows it to be applicable to a larger number of hospitals, maximizing its impact. The effect of patient health status and demographics on episode spending is accounted for by the MSPB’s risk-adjustment methodology. Using this all-cause efficiency measure in conjunction with existing quality measures available on Hospital Compare and within the CMS Hospital VBP system, the MSPB Measure can identify efficient providers that provide high-quality, low-cost care. [5] NQF precedent defines efficient care to be a measure of cost of care associated with a specified level of quality of care. [6] One can measure whether hospitals provide efficient care by using the MSPB measure in concert with a variety of quality of care measures already developed as part of Hospital Compare [5].
For the May 15, 2010 to February 14, 2011 period of performance, the MSPB Measure will be calculated from the claims of over 806,000 Medicare beneficiaries and will affect 3,396 hospitals. • [1] Ashton CM, Del Junco DJ, Souchek J, Wray NP and Mansyur CL. “The Association between the Quality of Inpatient Care and Early Readmission: A Meta-Analysis of the Evidence.” Medical Care , Vol. 35, No. 10 (Oct., 1997), pp. 1044-1059
• [2] Jencks SF, et al. “Rehospitalizations among patients in the Medicare fee-for-service program.” New England Journal of Medicine 2009; 360(14): 1418-28.
• [3] “Why Not the Best? Results from a National Scorecard on U.S. Health System Performance. Fund Report. Harrisburg, PA: The Commonwealth Fund, 2006.
• [4] “Long-Term Care Cost Study.” Prudential Research Report. 2010. • [5] U.S. Department of Health & Human Services. Hospital Compare. www.hospitalcompare.hhs.gov.
• [6] National Quality Forum. “Resource Use Measurement White Paper.” S.7.7. Resource Use Service Categories (Units)(Select all categories that apply)
Inpatient services: Inpatient facility services; Inpatient services: Evaluation and management; Inpatient services: Procedures and surgeries; Inpatient services: Imaging and diagnostic; Inpatient services: Lab services; Inpatient services: Admissions/discharges; Ambulatory services: Outpatient facility services; Ambulatory services: Emergency Department; Ambulatory services: Evaluation and management; Ambulatory services: Procedures and surgeries; Ambulatory services: Imaging and diagnostic; Ambulatory services: Lab services; Durable Medical Equipment (DME)
If other: N/A
☐ Low ☐ Insufficient
1. Overall Importance to Measure and Report
1a. High Impact H M L I
1b. Opportunity for Improvement H M L I
1c. Measure Intent H M L I
Based on your rating of the subcriteria, make a summary determination of the extent to which the criterion of Importance to Measure and Report has been met. Please provide a rationale based on specific subcriteria.
Rationale: ☐ High
☐ Moderate ☐ Low ☐ Insufficient
2. Scientific Acceptability of the Measure Properties
Extent to which the measure, as specified, produces consistent (reliable) and credible (valid) results about the cost or resources used to deliver care. Measures must be judged to meet the subcriteria for both reliability and validity to pass this criterion and be evaluated against the remaining criteria.
Construction Logic
S.7.1. Brief Description of Construction Logic
The MSPB Measure assesses the cost to Medicare of services performed by hospitals and other healthcare providers during an MSPB episode. An MSPB episode is risk adjusted and includes Medicare payments for services provided to a beneficiary with start date falling between 3 days prior to an IPPS hospital admission (index admission) through 30 days post-hospital discharge.
S.7.2. Construction Logic (Detail logic steps used to cluster, group or assign claims beyond those associated with the measure’s clinical logic.)
The MSPB Measure is calculated according to the following eight steps:
Step 1: Standardize Claims Payments. To capture differences in beneficiary resource use that a hospital can influence through appropriate practices and care coordination, the MSPB Measure removes local or regional price differences, which are sources of variation not directly related to decisions to utilize care. The MSPB Measure relies on a detailed price-standardization methodology to exclude geographic payment rate differences; in other words, the MSPB Measure adjusts observed payments for Medicare geographic adjustment factors, such as the hospital wage index and geographic practice cost index (GPCI). Specifically, the price-standardization methodology:
•Eliminates adjustments made to national payment amounts to reflect differences in regional labor costs and practice expenses (measured by hospital wage indexes and geographic practice cost indexes);
•Substitutes a national amount in the case of services paid on the basis of state fee schedules;
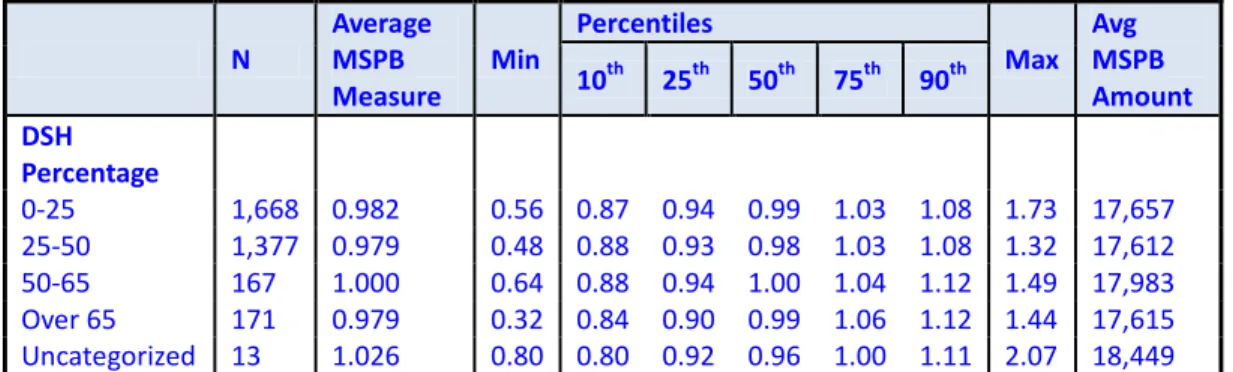
•Eliminates Medicare’s payments to hospitals for graduate indirect medical education (IME) and for serving a disproportionate population of poor and uninsured (i.e., disproportionate share payments (DSH));
•Maintains differences that exist in actual payments resulting from: (i) the choice of setting in which a services is provided, (ii) the choice about who provides the service, (iii) the choice as to whether to provide multiple services in the same encounter, and (iv) differences in provider experience with regard to outlier cases; and
•Treats outlier payments as a given rather than trying to determine what outlier payment would have been in a standardized world. Actual outlier payments are adjusted for differences in wages using the wage index.
Step 2: Calculate Price-Standardized Episode Spending. Standardized spending during an episode is calculated as the sum of all the standardized Medicare claims payments made during the MSPB episode (i.e., between 3 days prior to the hospital admission until 30 days after discharge). [1]
Step 3: Calculate Expected Episode Spending. To estimate the relationship between the independent variables to be described in S.9.3. (i.e., age, HCC, enrollment status, comorbidity interactions, long-term care) and standardized episode cost, the MSPB methodology uses an ordinary least squares (OLS) regression. Using a separate model for episodes within each major diagnostic
7
category (MDC), these variables are regressed on standardized episode cost. The MDC is determined by the MS-DRG of the index hospital stay. [2] The predicted values from this regression are used to measure the spending levels one would expect for each episode given the patient demographics and health status.
Step 4: Truncate Predicted Values. Although including a large number of variables in the regression more accurately captures beneficiary case mix, including a larger number of variables can produce some extreme predicted values due to having only a few outlier individuals in a given cell. To prevent creating extreme predicted values, this step truncates (a.k.a. ‘bottom-codes’) predicted values at the 0.5th percentile. [3], [4] This step also renormalizes the predicted values to ensure that the average expected episode spending levels for each MS-DRG is the same before and after truncating. This normalization occurs by multiplying the truncated predicted values by the ratio of the average predicted spending levels and the average truncated predicted spending levels. Step 5: Calculate Residuals. The residuals for each episode are calculated as the difference between the standardized episode spending level in Step 2 and the truncated predicted value of spending for that episode calculated in Step 4. If the variable Y_ijm represents standardized spending levels for episode i for hospital j of MS-DRG type m, and Y(hat)_ijm equals the predicted spending levels from Step 3, then one can calculate the residual mathematically as: Residual_ijm = Y_ijm - Y(hat)_ijm.
Step 6: Exclude Outliers. To mitigate the effect of high-cost outliers on each hospital’s MSPB Measure score, MSPB episodes whose residuals fall above the 99th percentile or below the 1st percentile of the distribution of residuals within each index admission MS-DRG are excluded from the MSPB calculation. Excluding outliers based on residuals eliminates the episodes that deviate most from their predicted values in absolute terms.
Step 7: Calculate the MSPB Amount for Each Hospital. The MSPB Amount for each hospital depends on three factors: i) the ratio of the average standardized episode spending level from Step 2, ii) the average expected standardized episode spending for each hospital calculated in Step 3, and iii) the average standardized episode spending across all hospitals. To calculate the MSPB Amount for each hospital, one simply finds the ratio of the average standardized episode spending to the average expected standardized episode spending, and then multiplies this ratio by the average episode spending level across all hospitals. Mathematically, the MSPB Amount is calculated as: MSPB Amount_j = [(1/n_j)(the sum of Y_ij over all elements i in the set {I_j})]/](1/n_j)(the sum of Y(hat)_ij over all elements i in the set {I_j})] x [(1/n)(the sum of Y_ij over all i)] where Y_ij is the standardized spending for episode i in hospital j; Y(hat)_ij is the expected standardized spending for episode i in hospital j, using the truncated predicted values from the risk-adjustment regression in Step 3; n_j is the number of episodes for hospital j; n is the number of episodes across all hospitals in the U.S.; and "all elements i in the set {I_j}" indicates all episdoes i in the set of episodes attributed to hospital j.
In words, this equation defines the MSPB Amount for hospital j as the average spending level for a hospital divided by the expected episode spending level for that hospital, multiplied by the average spending over all episodes across all hospitals. Defining a hospital’s MSPB Amount by calculating the ratio of the hospital’s standardized payment total to its expected standardized payment total is a familiar methodology for implementing risk adjustment. The MSPB Amount represents the per-episode spending level for a hospital j assuming its composition of episodes matches that of the national average.
To enhance the usability of the measure for public reporting purposes, one can normalize the MSPB Amount to create the MSPB Measure. The MSPB Measure compares a hospital’s efficiency level to the efficiency level across of the typical hospital. To perform this normalization, one relies on the following step:
Step 8: Calculate the MSPB Measure. The MSPB Measure for hospital j is calculated as the ratio of the MSPB Amount for a hospital (calculated in Step 7) divided by the median MSPB Amount across all hospitals: MSPB Measure_j = (MSPB Amount_j)/[med(MSPB Amount_j)].
The median MSPB Amount for hospital j is a weighted median, where the weights are the number of episodes in each hospital. [5] For public reporting purposes, one can limit the MSPB Measure values reported only to hospitals with a sufficient number of episodes as described in the final step below.
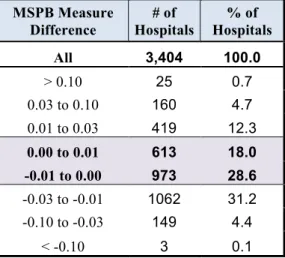
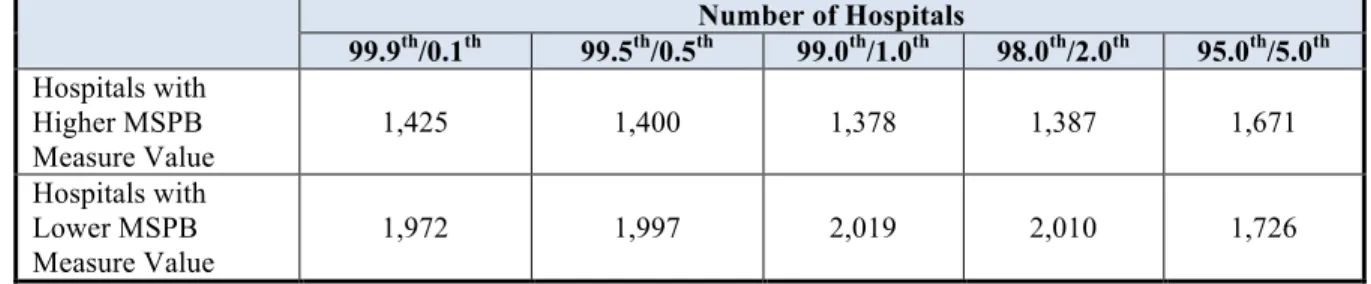
To reduce the likelihood that a hospital’s MSPB score would be affected by only a few high-cost outliers, hospitals with less than a certain number episodes will not have their MSPB Measure publicly reported. In response to (2a2.2) of this measure submission form, Acumen evaluated changing the minimum number of MSPB cases required to be classified as a “hospital” under the Hospital Value-Based Purchasing (VBP) program. In sum, Acumen determined that as the minimum episode threshold increases, there is a trade-off between the size of the confidence interval for the ‘average’ hospital and the number of hospitals receiving an MSPB score. •[1] Price-standardization uses similar methodology as adopted by IOM.
http://iom.edu/Activities/HealthServices/GeographicVariation/Data-Resources.aspx
•[2] Certain MS-DRG’s related to procedures (e.g., transplants) fall into the Pre-MDC category. For risk adjustment purposes, these episodes are grouped into one of the remaining MDCs based on the primary diagnosis code of the index admission.
•[3] In this form, “truncate” is equivalent “Winsorize.” Winsorization is a statistical transformation that limits extreme values in data to reduce the effect of possibly spurious outliers. Thus, all predicted values below the 0.5th percentile are assigned the value of the 0.5th percentile.
•[4] To ensure that the lowest predicted values within an MS-DRG are adjusted even for MS-DRGs with few episodes, this methodology first sets the lowest predicted value within the MS-DRG to the second lowest predicted value within the MS-DRG before truncating at the 0.5th percentile.
•[5] For example, if there are 2 hospitals and one hospital had an MSPB of 1.5 and another had one of 0.5 but the first had 4 episodes and the second only 1, then the median would be 1.5.
Click here to go to the Construction Logic Attachment
S.7.3. Concurrency of clinical events, measure redundancy or overlap, disease interactions (Detail the method used for identifying concurrent clinical events, how to manage them, and provide the rationale for this methodology.)
We do not provide The MSPB Measure methodology does not separate concurrent events.
The MSPB Measure methodology defines an MSPB episode as all claims with start date falling between 3 days prior to an IPPS hospital admission (index admission) through 30 days post hospital discharge. It includes the period 3 days prior-hospital admission and 30 days post-hospital discharge to emphasize the importance of care transitions and care coordination in improving patient care. Please refer to S.8.4., which details the rationale for the construction of the MSPB episode, for a discussion of the advantages of this approach.
Although it is likely that a hospital will have some MSPB episodes whose costs are inflated by unrelated events, most hospitals have a large number of MSPB episodes (the median number of episodes for the period of May 1, 2011 to December 1, 2011 is 885), so averaged across a large number of episodes such random, post-acute events should have a fairly small effect on hospitals’ overall MSPB Measure value.
S.7.4. Complementary services (Detail how complementary services have been linked to the measure and provide rationale for this methodology.)
To promote MSPB episode consistency regardless of where complementary services take place and to incorporate payments for services that may appear on the face of a claim to be unrelated to the original admission, a 3-day window prior to the index admission is included at the start of the MSPB episode. For additional discussion, please refer to S.8.4., which details the rationale for the construction of the MSPB episode.
S.7.5. Clinical hierarchies (Detail the hierarchy of codes or condition groups used and provide rationale for this methodology.) Clinical hierarchies are embedded in the risk adjustment model; see S.9.5. for more details. The MSPB risk-adjustment methodology is discussed in additional detail in S.9.3. and S.9.4.
S.7.6. Missing Data (Detail steps associated with missing data and provide rationale for this methodology (e.g., any statistical techniques to impute missing data)
We do not provide All the data used to calculate hospitals’ MSPB Measure values are included on Medicare claims data. The data fields used to calculate the MSPB Measure (e.g., payment amounts, DRGs, diagnosis and procedure codes, etc.) are included in all Medicare claims because hospitals only receive payments for complete claims. The quality of the diagnostic information on claims, however, is only as reliable as the information completed by providers. Because claims are not paid without the appropriate diagnostic information, missing data is not an issue. Additional information regarding the reliability of diagnostic information on claims is available in 2a2.2.
S.7.7. Resource Use Service Categories (Units)(Select all categories that apply)
Inpatient services: Inpatient facility services; Inpatient services: Evaluation and management; Inpatient services: Procedures and surgeries; Inpatient services: Imaging and diagnostic; Inpatient services: Lab services; Inpatient services: Admissions/discharges; Ambulatory services: Outpatient facility services; Ambulatory services: Emergency Department; Ambulatory services: Evaluation and management; Ambulatory services: Procedures and surgeries; Ambulatory services: Imaging and diagnostic; Ambulatory services: Lab services; Durable Medical Equipment (DME)
9 2a1.The measure is well defined and precisely specified so
that it can be implemented consistently within and across organizations and allow for comparability. Electronic health record (EHR) measure specifications are based on the quality data model (QDM).
To what extent is the construction logic well defined and precisely specified?
☐ High/Moderate (Specifications are unambiguous) ☐ Low (One or more specifications are ambiguous) 2b1.The measure specifications are consistent with the
measure intent described under criterion 1c and captures the most inclusive target population.
To what extent is the clinical logic consistent with the measure intent and captures the broadest target population?
☐ High/Moderate (Measure specifications are consistent with the measure intent and captures the broadest target population)
☐ Low (Measure specifications do not reflect the measure intent)
Clinical Logic
S.8.1. Brief Description of Clinical Logic (Briefly describe your clinical logic approach including clinical topic area, whether or not you account for comorbid and interactions, clinical hierarchies, clinical severity levels and concurrency of clinical events.)
Objective: The MSPB Measure aims to improve care coordination in the period between 3 days prior to an acute inpatient hospital admission through the period 30 days after discharge.
Clinical Topic Area: Inpatient Admissions, all conditions
Accounting for Comorbidities: Application of a variant of the CMS-HCC risk adjustment model. The model includes a select number of interaction terms between comorbidities.
Measure of Episode Severity: Risk Adjustment model includes indicators for the MS-DRG of the index admission.
Concurrency of Clinical Events. The MSPB Episode spans the period 3 days prior to the index hospital admission through 30 days post-discharge. All events that occur during this time period are included in the MSPB episode.
S.8.2. Clinical Logic (Detail any clustering and the assignment of codes, including the grouping methodology, the assignment algorithm, and relevant codes for these methodologies.)
Objective: The MSPB Measure aims to improve care coordination in the period between 3 days prior to an acute inpatient hospital admission through the period 30 days after discharge.
Controlling for Comorbid Conditions and Interactions: The MSPB Measure accounts for comorbid conditions and interactions by broadly following the CMS-HCC risk-adjustment methodology, which is derived from Medicare Part A and B claims and is used in the Medicare Advantage (MA) program. Diagnosis codes on claims that occur during the 90-day period prior to the start of an MSPB episode are used to create HCC indicators. When applying the CMS-HCC framework to the MSPB Measure, the risk adjustment model is stratified by Major Diagnostic Category (MDC), which allows the effect of beneficiary health status and demographics on episode spending levels to vary by the MDC of the MSPB index admission. The MSPB Measure accounts for comorbid interactions by incorporating a number of health status interactions as currently used within the CMS-HCC model. The model includes paired-condition interactions, (e.g., chronic obstructive pulmonary disease (COPD) and congestive heart failure (CHF)) triple-interactions (e.g., diabetes mellitus, congestive heart failure, and renal failure) and interactions between conditions and disability status (e.g., disabled and cystic fibrosis). The full list of variables used in the risk adjustment model can be found in S.9.4.
Episode Severity: To control for the severity of the hospital admission, the risk adjustment model also controls for the MS-DRG of the index hospitalization. The full list of variables used in the risk adjustment model can be found in S.9.4.
Concurrent Clinical Conditions: To simplify the clinical logic and avoid the issue of attributing claims to MSPB episodes in the case of concurrent clinical events, all claims that begin during the period 3 days prior to the index admission through 30 days after discharge are included in a given MSPB episode.
Attribution: MSPB episodes are in turn assigned to the hospital of the index admission. Admissions which occur within 30 days of discharge from another index admission are not considered to be index admissions. In other words, if multiple hospitalizations appear during an episode window, the first hospitalization is consider the index admission and the hospital at which the first hospital admission occurred is assigned the episode; any subsequent hospitalizations that occur within the 30 day post-discharge window are considered re-hospitalizations.
MSPB episode, which is comprised of the period 3 days prior to an inpatient PPS hospital admission (index admission) through 30 days post-hospital discharge. All costs are price-standardized to control for geographic variation in Medicare reimbursement rates. Risk adjusted costs are calculated as the average cost of an MSPB nationally, plus the difference between an episode’s price-standardized episode cost and its expected cost produced from the risk adjustment model described above.
Clustering: None.
Any episodes where at any time during the episode, the beneficiary is enrolled in a Medicare Advantage plan; the beneficiary becomes deceased; or Medicare is the secondary payer will be excluded from the MSPB calculation. Regarding beneficiaries whose primary insurance becomes Medicaid during an episode due to exhaustion of Medicare Part A benefits, Medicaid payments made for services rendered to these beneficiaries are excluded; however, all Medicare Part A payments made before benefits are exhausted and all Medicare Part B payments made during the episode are included.
S.8.3. Evidence to Support Clinical Logic Described in S.8.2 Describe the rationale, citing evidence to support the grouping of clinical conditions in the measurement population(s) and the intent of the measure (as described in IM3)
The MSPB Measure methodology defines an MSPB episode as all claims with start dates falling between 3 days prior to an IPPS hospital admission (index admission) through 30 days post-hospital discharge and does not separate concurrent events. It includes the period 3 days prior-hospital admission and 30 days post-hospital discharge to emphasize the importance of care transitions and care coordination in improving patient care and reducing unnecessary readmissions. This episode definition is consistent with MedPAC’s response to the FY 2012 IPPS proposed rule, in which they recommended that “both CMS and MedPAC should focus on creating parallel incentives for hospitals and post-acute care providers to work to reduce readmissions. The end goal is to align incentives across the sectors to encourage cooperation among providers to improve the quality of the episode of care, reduce the cost of the episode of care, and reduce the number of unnecessary inpatient episodes” (http://www.cms.gov/Medicare/Medicare-Fee-for-Service-Payment/AcuteInpatientPPS/FY-2012-IPPS-Final-Rule-Home-Page.html). The advantages of this approach are twofold. First, this approach is simple, as costs of Medicare services do not need to be divided into separate clinical events. Take for example, a Medicare beneficiary who is hospitalized for Acute Myocardial Infarction (AMI) and then has a doctor’s visit in the 30 days post hospital discharge period where the doctor follows up on the AMI hospitalization as well as other conditions. Under the MSPB Measure methodology, costs do not need to be divided between those more relevant and those less relevant to the episode. Second, this approach incorporates payments for services due to care complications that may appear on the face of a claim to be unrelated to the original admission. For example, if a beneficiary is admitted for AMI, but develops pneumonia due to poor care coordination, these costs will be captured in the episode generated by the AMI admission. Additionally, NQF already has endorsed a number of 30-day all-cause measures. For example, NQF already endorses the Hospital-Wide All-Cause Unplanned Readmission Measure (NQF #1789), which estimates the hospital-level, risk-standardized rate of unplanned, all-cause readmission after admission for any eligible condition within 30 days of hospital discharge for patients aged 19 and older.
(https://www.qualitynet.org/dcs/ContentServer?cid=1228772504318&pagename=QnetPublic%2FPage%2FQnetTier4&c=Page). S.8.4. Measure Trigger and End mechanisms (Detail the measure's trigger and end mechanisms and provide rationale for this methodology)
Trigger Event: Inpatient admission, with the exception of acute-to-acute transfer cases Start Date: 3 days prior to index inpatient admission
End Date: 30 days after discharge from the index hospital admission
As discussed in S.8.2., an MSPB episode is defined as all claims with start date falling between 3 days prior to an inpatient PPS hospital admission (index admission) through 30 days post hospital discharge. In other words, the MSPB Measure’s trigger is an inpatient PPS hospital admission, and the start is 3 days prior to an index admission, while the end is 30 days post hospital discharge. Admissions that occur within 30 days of discharge from another index admission and admissions during which a beneficiary is transferred from one acute hospital to another are not considered to be index admissions. Hospitalizations that occur within the 30-day post discharge window of the index admission are attributed to the index admissions. On the other hand, hospitalizations that begin more than 30 days after the beneficiary is discharged from a hospital trigger a new MSPB episode as an index admission. Diagnostic services and non-diagnostic services related to the reason for admission are captured in the inpatient DRG payment for the hospitalization when they are performed by the hospital during the 3 days prior to admission
(http://www.cms.gov/Medicare/Medicare-Fee-for-Service-Payment/AcuteInpatientPPS/Three_Day_Payment_Window.html); however, if, during the 3 days prior to a hospital admission, a beneficiary receives diagnostic services from a provider other than the hospital or non-diagnostic services that appear on the claim to be unrelated to the reason for admission, those services are
separately payable under Medicare. To promote MSPB episode consistency regardless of where these complementary services take place and to incorporate payments for services that may appear on the face of a claim to be unrelated to the original admission (as
11
described in section S.8.2), a 3-day window prior to the index admission is included at the start of the MSPB episode. The MSPB time frame also includes services that take place during the time period 30 days post-hospital discharge in order to emphasize the importance of care transitions and care coordination in improving patient care. As a result, services whose claim start dates fall between 3 days prior to an index admission through 30 days post hospital discharge are attributed to that index admission. The advantages of this measure trigger and end mechanism are twofold. First, this approach is simple and easily-implementable since it includes all claims during the MSPB episode. An alternative would be to create separate episodes for each type of hospital admission. Although episode-based approaches are attractive for a number of purposes, the MSPB aims to evaluate overall hospital efficiency level across all types of care and creating are over 700 types of hospitals admission episodes (i.e., there are over 700 MS-DRGs) is not practical. Second, the MSPB approach incorporates costs due to care complications unrelated to the original admission, encouraging hospital care coordination. For example, if a beneficiary is admitted for AMI but develops pneumonia due to poor care coordination, these costs will be captured in the episode generated by the initial AMI index admission.
S.8.5. Clinical severity levels (Detail the method used for assigning severity level and provide rationale for this methodology) Clinical Severity levels are embedded in the risk adjustment model, as described in S.9.2. through S.9.5.
S.8.6. Comorbid and interactions (Detail the treatment of co-morbidities and disease interactions and provide rationale for this methodology.)
Co-morbidities and disease interactions are accounted for in the MSPB Measure risk-adjustment methodology, as discussed in S.9.3. and S.9.4. As described in S.8.2., episodes where the beneficiary is not enrolled in both Medicare Part A and Medicare Part B for the 90 days prior to the episode are excluded because information on comorbidities for these beneficiaries will be incomplete. The 90-day period prior to the start of an episode is used to measure the conditions which most directly impact beneficiaries’ health status at the time of the hospital admission and to capture beneficiaries’ comorbidities in the risk adjustment. Additionally, because the relationship between comorbidities’ episode cost may be non-linear in some cases (i.e., beneficiaries may also have more than one disease during a hospitalization episode), the model also takes into account a limited set of interactions between HCCs and/or enrollment status variables. Example variable interaction terms include Diabetes Mellitus/Congestive Heart Failure, Renal
Failure/Congestive Heart Failure, and Disability/Opportunistic Infections (for a complete list of these variable interaction terms and other risk-adjustment variables, please refer to S.9.3 and S.9.4.). The MSPB Measure risk-adjustment methodology includes only a limited set of interaction terms for two reasons. First, inclusion of too many interaction terms will over-fit the model. Second, the MSPB Measure risk-adjustment methodology broadly follows the established CMS-HCC risk-adjustment methodology, which uses similar interaction terms.
2a1.The measure is well defined and precisely specified so that it can be implemented consistently within and across organizations and allow for comparability. Electronic health record (EHR) measure specifications are based on the quality data model (QDM).
To what extent is the clinical logic well defined and precisely specified?
☐ High/Moderate (Specifications are unambiguous) ☐ Low (One or more specifications are ambiguous) 2b1.The measure specifications are consistent with the
measure intent described under criterion 1c and captures the most inclusive target population
To what extent is the clinical logic consistent with the measure intent and captures the broadest target population?
☐ High/Moderate (Measure specifications are consistent with the measure intent and captures the broadest target population)
☐ Low (Measure specifications do not reflect the measure intent)
Adjustments for Comparability – Inclusion/Exclusion Criteria
S.9.1. Inclusion and Exclusion Criteria Detail initial inclusion/exclusion criteria and data preparation steps (related to clinical exclusions, claim-line or other data quality, data validation, e.g. truncation or removal of low or high dollar claim, exclusion of ESRD patients)
The MSPB Measure calculation includes five types of exclusions:
secondary payer, episodes in which the beneficiary is enrolled in a Medicare Advantage plan, episodes in which the beneficiary is enrolled only in Medicare Part A, episodes in which the beneficiary becomes deceased). Episodes in which the beneficiary is enrolled only in Medicare Part A, for example, are excluded because these beneficiaries may receive services not observed in the data. Similarly, episodes in which the beneficiary dies at any point during the episode and episodes in which the patient dies are— by definition—truncated episodes and do not have a complete episode window are excluded. Including episodes without all observable claims or a complete episode window could potentially make hospitals seem efficient not due to any action of their own, but because the data is missing services that would be included in the MSPB Measure calculation.
• [2] Regarding beneficiaries whose primary insurance becomes Medicaid during an episode due to exhaustion of Medicare Part A benefits, Medicaid payments made for services rendered to these beneficiaries are excluded; however, all Medicare Part A payments made before benefits are exhausted and all Medicare Part B payments made during the episode are included.
• [3] Any episode in which the index admission inpatient claim has a $0 actual payment or a $0 standardized payment is excluded; $0 inpatient admissions may represent errors in the data, or payment corrections rather than actual services rendered.
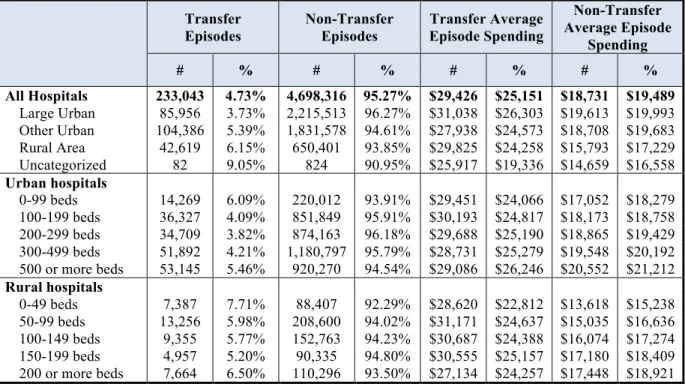
• [4] Due to the uncertainty surrounding attributing episodes to hospitals in cases where the patient was transferred between acute hospitals during the index admission, acute-to-acute transfers during the index admission (where a transfer is defined based on the claim discharge code) are not considered index admissions for the purposes of the MSPB Measure. In other words, these cases will not generate new MSPB episodes; neither the hospital which transfers a patient to another short-term acute hospital, nor the receiving short-term acute hospital will have an index admission attributed to them. Although this exclusion decreases the number of eligible episodes by about 5 percent, it avoids the problem of assigning responsibility to an MSPB episode in a case where multiple hospitals treat the patient during the index admission.
• [5] In response to stakeholder comments, the FY 2012 IPPS Final Rule states that the MSPB Measure will “exclude statistical outliers from the calculation” (76 FR 51626: www.gpo.gov/fdsys/pkg/FR-2011-08-18/pdf/2011-19719.pdf). To mitigate the effect of high-cost outliers on each hospital’s MSPB Measure score, MSPB episodes whose relative scores fall above the 99th percentile or below the 1st percentile of the distribution of residuals within each index admission MS-DRG are excluded from the MSPB calculation. Excluding outliers based on residuals eliminates the episodes that deviate most from their predicted values in absolute terms. When the MSPB Measure is applied to Medicare FFS patients, exclusions are identified based on the following variables.
• [1] Episodes where Medicare is the secondary payer: if a beneficiary was the primary payer any time during the MSPB episode, the beneficiary was excluded (i.e., if bene_prmry_pyr_entlmt_strt_dt (start date of primary payer enrollment)
bene_prmry_pyr_entlmt_end_dt (end date of primary payer enrollment) fell within the episode). In addition, an index
hospitalization with death discharge code (STUS_CD “20” “41”) was excluded. Similarly if a beneficiary’s death was within an MSPB episode, the episode was excluded as well.
• [2] The MSPB Measure is calculated using only Medicare Part A and Part B claims; as a result no Medicaid claims are included in the MSPB Measure calculation.
• [3] Only when the Claim Payment Amount (Pmt_Amt) for the IP stay is greater than 0 OR Standard_allowed_amt is greater than 0 is the amount included in the MSPB Measure calculation.
• [4] An IP stay with discharge code (STUS_CD) in “02” “43” “66” or an IP stay with admission code (SRC_ADMS) in “04” is considered to be a transfer. Any IP stays with the same admsn_dt as the transfer stay or with the admsn_dt same as the dschrgdt of the transfer IP stay is also considered to be a transfer. An acute hospital is defined as those with provider variable’s third position “0”. Cancer hospitals, MD Hospitals (provider variable starting with “21”), emergency hospitals (provider variable last position “E” OR “F”), and Veteran’s Hospitals (provider variable position “V”) are also excluded.
2b.3. Exclusion Analysis
Click here to go to the developer submission for Exclusion Analysis (2b3) 2a1.The measure is well defined and precisely specified so
that it can be implemented consistently within and across organizations and allow for comparability. Electronic health record (EHR) measure specifications are based on the quality data model (QDM).
To what extent are the inclusion/exclusion criteria well defined and precisely specified?
☐ High/Moderate (Specifications are unambiguous) ☐ Low (One or more specifications are ambiguous)
13 2b1.The measure specifications are consistent with the
measure intent described under criterion 1c and captures the most inclusive target population.
To what extent is the clinical logic consistent with the measure intent and captures the broadest target population?
☐ High/Moderate (Measure specifications are consistent with the measure intent and captures the broadest target population)
☐ Low (Measure specifications do not reflect the measure intent)
2b3. Exclusions are supported by the clinical evidence.
AND/OR
There is a rationale or analysis demonstrating that the measure results are sufficiently distorted due to the magnitude and/or frequency of the non-clinical exclusions;
AND
Measure specifications for scoring include computing exclusions so that the effect on the measure is transparent (i.e., impact clearly delineated, such as number of cases excluded, exclusion rates by type of exclusion);
AND
If patient preference (e.g., informed decision-making) is a basis for exclusion, there must be evidence that the exclusion impacts performance on the measure; in such cases, the measure must be specified so that the information about patient preference and the effect on the measure is
transparent (e.g., numerator category computed separately, denominator exclusion category computed separately).
To what extent are the inclusion/exclusion criteria
supported by the clinical evidence or supported by evidence of sufficient frequency and impact on performance results? ☐ High
☐ Moderate ☐ Low ☐ Insufficient
Adjustments for Comparability – Risk Adjustment
S.9.2. Risk Adjustment Type (Select type) Statistical risk model
S.9.3. Statistical risk model method and variables (Name the statistical method - e.g., logistic regression and list all the risk factor variables.)
The model generally follows the CMS hierarchical condition category (HCC) risk-adjustment methodology. This model measures comorbid factors using diagnosis information from Medicare Part A and B claims. CMS uses a variant of the HCC risk-adjustment model in many payment systems including: the Medicare Advantage (MA) Capitation Payment program (implemented in 2004, fully phased-in in 2007), the Shared Savings Program Accountable Care Organizations (implemented in 2012), and the Medicare Physician Quality and Resource Use Reports (implemented in 2009). [1]
Just like the CMS-HCC model, the MSPB risk-adjustment approach uses a linear ordinary least squares (OLS) regression model. The independent variables used in the risk-adjustment model include beneficiary age, health status (as measured by hierarchical condition categories (HCCs)), disability-status, end-stage renal disease (ESRD) status, residence in a long-term care facility, and indicators for the MS-DRG of the index hospital admission. All variables are calculated using Medicare claims data during the period 90 days prior to the start of an episode. No risk-adjustment factors are determined using information contemporaneous with the MSPB episode to avoid circularity problems that would—by construction—cause the risk-adjustment factors to be correlated with episode spending. For a detailed list of explanatory variables in the risk-adjustment model, please the attached response to S.9.4. The OLS model is stratified based on the MDC of the index admission. The use of separate models by MDC permits the effect of risk factors on episode spending to vary based on the bodily system treated during the index admission. More precisely, this approach allows the coefficient on each risk adjuster to vary by MDC.
DETAILED SPECIFICATIONS:
Although broadly relying on the CMS-HCC framework, MSPB risk-adjustment model, however, is tailored for this specific quality measure. To account for case-mix variation and other factors, the MSPB risk-adjustment methodology adjusts the MSPB Measure for five broad risk factors. These include:
•Beneficiary age
•Severity of illness using 70 HCC indicators •Enrollment in Medicare due to disability or ESRD
•Whether the beneficiary recently required long-term care, and •MS-DRG of the index hospitalization.
Although the CMS-HCC risk-adjustment model used in the MA setting includes 24 age/sex variables, the MSPB methodology does not adjust for patient sex; thus it only includes 12 age categorical variables in the risk-adjustment methodology. This policy is consistent with NQF’s position on not adjusting for potential demographic (sex or race) or socioeconomic factors; including sex as a risk adjuster would mean that hospitals would be held to different standards of care based on the patient’s sex. For similar reasons, beneficiary race is also not included as a risk adjuster. Thus, the only demographic variable included in the risk-adjustment model is beneficiary age.
Severity of illness HCC indicators are created based on Medicare Part A and Medicare Part B diagnosis code information during the time 90 days prior to the start of an episode (i.e., 93 days prior to the date of the index admission). Patients without a full 90-day look-back period have their episodes excluded from the MSPB Measure. This 90-day period prior to the start of an episode is used to measure beneficiary health status, which is used in the risk-adjustment model; this look-back period ensures that each beneficiary’s claims record contains sufficient fee-for-service data both for measuring spending levels and for risk-adjustment purposes. As the length of the look-back period increases, there is a trade-off between the number of comorbidities captured and the number of false positives (i.e., diagnoses captured that may have been resolved). A longer look-back period, for example, will capture more
comorbidities, while a shorter look-back period will capture fewer false positives. A longer look-back period will also decrease the number of episodes eligible to be included in the MSPB Measure calculation in the cases where a beneficiary would be required to have 365 of pre-admission Medicare enrollment to be included in the measure. Based on our analysis (see 2b4), increasing the look-back period to 365 days would not only decrease the number of valid episodes, but also would worsen the model fit. Based on these results, a 90-day look-back window is selected for the generation of the independent variables used in this risk-adjustment model. The MSPB risk-adjustment methodology also includes status indicator variables for whether the beneficiary qualifies for Medicare through Disability or End-Stage Renal Disease (ESRD); one can view these enrollment status variables as two additional severity of illness measures, however, these variables are generated from enrollment rather than diagnosis information.
Patients who reside in long-term care facilities typically require more intensive care—particularly more intensive post-acute care— than beneficiaries who live in the community even for patients that may have illness severity measures. Thus, the risk-adjustment method also includes an indicator of whether a beneficiary resides in a long-term care facility as non-diagnostic measures of severity of illness.
This measure assumes that the reason the patient is admitted to the hospital is largely outside the control of the hospital; thus, the risk-adjustment measure also includes MS-DRG indicator variables as well. Additionally, the reason for admission directly affects payments and is predictive of post-acute care.
The relationship between comorbidities’ episode cost may be non-linear in some cases. For instance, the marginal expected episode cost from having diabetes and congestive heart failure (CHF) may not be equal to the sum of the marginal expected cost from having diabetes and the marginal expected cost from having CHF. To account for these non-linearities, the MSPB risk-adjustment model also incorporates a series of interactions terms between HCCs and/or enrollment status variables that are included in the MA model. The final set of explanatory variables in the risk-adjustment model can be found in the "MSPB Measure Information Form" available at the measure-specific web page URL identified in S.1 (see S.9.4.).
For your reference, the "Additional Information" appendix beginning on page 24 of the attached "Scientific Acceptability" section also includes regression coefficients and standard error of the covariates used in the risk-adjustment models. There are 26 tables, one for each risk adjustment by MDC.
• [1] Centers for Medicare and Medicaid Services, Office of the Actuary. “Announcement of Calendar Year (CY) 2009 Medicare Advantage Capitation Rates and Medicare Advantage and Part D Payment Policies.” April 2008.
http://www.cms.gov/MedicareAdvtgSpecRateStats/Downloads/Announcement2009.pdf
S.9.4. Detailed Risk Model Specifications available at measure-specific Web page URL identified in S.1 OR in attached data dictionary/code list Excel or csv file.
Available at measure-specific web page URL identified in S.1
S.9.5. Stratification Details/Variables (All information required to stratify the measure results including the stratification variables, definitions, specific data collection items/responses, code/value sets)
15 (MS-DRG), which CMS uses to classify acute inpatient admissions.
The MS-DRG/MDC crosswalk is available for order here:
http://solutions9.3m.com/wps/portal/!ut/p/c1/04_SB8K8xLLM9MSSzPy8xBz94NS8-NBg_Qj9KLP4IC8Py1BTI2MD9zAvFwMjYzMzCxNHd2OTACP9ggxHRQBm3gTM/ 2b.4. Risk Adjustment Statistics
Click here to go to the developer submission for Risk Adjustment (2b4) 2a1.The measure is well defined and precisely specified so
that it can be implemented consistently within and across organizations and allow for comparability. Electronic health record (EHR) measure specifications are based on the quality data model (QDM).
To what extent is the risk adjustment strategy well defined and precisely specified?
☐ High/Moderate (Specifications are unambiguous) ☐ Low (One or more specifications are ambiguous) 2b1.The measure specifications are consistent with the
measure intent described under criterion 1c and captures the most inclusive target population
To what extent is the clinical logic consistent with the measure intent and captures the broadest target population?
☐ High/Moderate (Measure specifications are consistent with the measure intent and captures the broadest target population)
☐ Low (Measure specifications do not reflect the measure intent)
2b4. An evidence-based risk-adjustment strategy (e.g., risk models, risk stratification) is specified; is based on factors that influence the measured outcome (but not factors related to disparities in care or the quality of care) and are present at start of care; and has demonstrated adequate discrimination and calibration
OR
Rationale/data support no risk-adjustment/-stratification.
To what extent are the risk adjustment factors present at the start of care with adequate discrimination and calibration?
☐ High ☐ Moderate ☐ Low ☐ Insufficient
Adjustments for Comparability – Costing Method
S.9.6. Costing method Detail the costing method including the source of cost information, steps to capture, apply or estimate cost information, and provide rationale for this methodology.
Standardized pricing
S.9.6a. Describe the Costing method
As discussed in S.7.2., the MSPB Measure removes sources of variation which are not directly related to decisions to utilize care, such as local or regional price differences, to capture differences in beneficiary resource use that a hospital can influence through
appropriate practices and care coordination. The MSPB Measure relies on a detailed price standardization methodology to exclude geographic payment rate differences; in other words, the MSPB Measure adjusts observed payments for Medicare geographic adjustment factors. A detailed price standardization description is available at the URL provided in S.1.
http://www.qualitynet.org/dcs/ContentServer?c=Page&pagename=QnetPublic%2FPage%2FQnetTier4&cid=1228772057350
S.9.6b. Attach pricing table here (Select Actual Prices Paid, Relative Value Units [RVUs], Other, or We do not provide specifications for a costing method)
2a1.The measure is well defined and precisely specified so that it can be implemented consistently within and across organizations and allow for comparability. Electronic health record (EHR) measure specifications are based on the quality data model (QDM).
To what extent is the costing method well defined and precisely specified?
☐ High/Moderate (Specifications are unambiguous) ☐ Low (One or more specifications are ambiguous) 2b1.The measure specifications are consistent with the
measure intent described under criterion 1c and captures the most inclusive target population
To what extent is the clinical logic consistent with the measure intent and captures the broadest target population?
☐ High/Moderate (Measure specifications are consistent with the measure intent and captures the broadest target population)
☐ Low (Measure specifications do not reflect the measure intent)
Adjustments for Comparability – Scoring
S.10. Type of Score (Select the most relevant) Ratio; Attachment
Click here to go to the sample score report
S.11. Interpretation of Score (Classifies interpretation of a ratio score(s) according to whether higher or lower resource use amounts is associated with a higher score, a lower score, a score falling within a defined interval, or a passing score, etc.)
An MSPB Measure of 1 indicates that a hospital had average risk-adjusted spending levels which are equal to those of the median hospital. An MSPB Measure of greater than 1 indicates that a hospital had higher than average risk-adjusted spending levels compared to those of the median hospital. For example, an MSPB Measure of 1.1 indicates that the hospital had average risk-adjusted spending levels that are 10 percent higher than the median hospital. On the other hand, an MSPB Measure of less than 1 indicates that a hospital had lower than average risk-adjusted spending levels compared to those of the median hospital. For example, an MSPB Measure of 0.9 indicates that the hospital had average risk-adjusted spending levels that are 10 percent lower than the median hospital.
S.12. Detail Score Estimation (Detail steps to estimate measure score.)
A hospitals’ MSPB Measure score is calculated as a hospital’s average MSPB Amount divided by the median MSPB Amount across all hospitals. A hospital’s MSPB Amount is defined as the sum of standardized, risk-adjusted spending across all of a hospital’s eligible episodes divided by the number of episodes for that hospital. S.7.2. provides additional details describing the eight steps used to calculate hospitals’ MSPB Measure values.
2a1.The measure is well defined and precisely specified so that it can be implemented consistently within and across organizations and allow for comparability. Electronic health record (EHR) measure specifications are based on the quality data model (QDM).
To what extent is the scoring method well defined and precisely specified?
☐ High/Moderate (Specifications are unambiguous) ☐ Low (One or more specifications are ambiguous) 2b1.The measure specifications are consistent with the
measure intent described under criterion 1c and captures the most inclusive target population
To what extent is the clinical logic consistent with the measure intent and captures the broadest target population?
☐ High/Moderate (Measure specifications are consistent with the measure intent and captures the broadest target population)
☐ Low (Measure specifications do not reflect the measure intent)
17 2b5.
Data analysis demonstrates that methods for scoring
and analysis of the specified measure allow for identification of statistically significant and practically/clinically meaningful differences in performance.
To what extent does the scoring method allow for identification of statistically significant and
practically/clinically meaningful differences in performance? ☐ High
☐ Moderate ☐ Low ☐ Insufficient
Comparability of Multiple Data Sources
Measure not specified for multiple data sources – Not Applicable 2b6.
If multiple data sources/methods are specified, there is
demonstration that they produce comparable results. To what extent do the multiple data sources/methods produce comparable results? ☐ High ☐ Moderate ☐ Low ☐ Insufficient ☐ Not Applicable Reliability Testing
Click here to go to the developer submission for Reliability Testing (2a2) 2a2. Reliability testingdemonstrates the measure data
elements are repeatable, producing the same results a high proportion of the time when assessed in the same population in the same time period and/or that the measure score is precise.
☐ High (Data element AND measure score reliability testing done and is acceptable)
☐ Moderate (Data element OR measure score reliability testing is done and acceptable)
☐ Low (There is empirical evidence of Unreliability for either data elements or measure score)
☐ Insufficient (Inappropriate method or scope of reliability testing)
Validity Testing
2b2. Validity testingdemonstrates that the measure data elements are correct and/or the measure score correctly reflects the quality of care provided, adequately identifying differences in quality.
☐ High