CRANFIELD UNIVERSITY
Yuan’an Xie
Prognostics for Electronics Components of Avionics – NASA IGBT
Accelerated Ageing Case Study
School of Engineering
MSc by Research
MSc Thesis
Academic Year: 2012 - 2013
Supervisor: Dr. Tarapong Sreenuch & Prof. Antonois Tsourdos
Dec. 2013
CRANFIELD UNIVERSITY
School of Engineering
MSc by Research
MSc Thesis
Academic Year 2012 - 2013
Yuan’an Xie
Prognostics for Electronics Components of Avionics – NASA IGBT
Accelerated Ageing Case Study
Supervisor: Dr. Tarapong Sreenuch & Prof. Antonios Tsourdos
Dec. 2013
© Cranfield University 2013. All rights reserved. No part of this
publication may be reproduced without the written permission of the
ABSTRACT
Insulate gate bipolar transistors (IGBTs) are widely used in electric vehicles, railway locomotive and new generation aircrafts, due to the IGBTs have advantages in small conduction resistance and small drive current. Hence, the reliability of IGBTs directly affect the reliability and performance of these vehicle systems. In recent years, a series of research works about IGBT reliability, failure mode and ageing analysis have been carried out widely, and a suitable prognostics method for IGBT and an efficient algorithm for predicting the IGBT Remaining Useful Life (RUL) become increasingly important.
In recent years, despite the research works on IGBT reliability, failure mode and effect analysis are carried out widely, the prognostics and prediction of the IGBT remaining useful life are still the bottleneck in the research work to develop IGBT health management system.
In this thesis, a framework and algorithm of IGBT prognostics and RUL prediction were developed. The research was based on the IGBT accelerated ageing experiments. The IGBT ageing data were processed and analysed, and the mechanism of the IGBT degeneration was studied. Additionally, the IGBT degradation models were built to simulate the IGBT degeneration process which were utilised to develop the prognostics algorithm for predicting the IGBT RUL.
Gamma distribution model, Exponential distribution model, Poisson distribution model and the combining distribution model were established, and Monte Carlo simulation was utilised in the algorithm to compute the IGBT remaining useful life. The collector emitter voltage (VCE) was used as precursor parameter in prognosis to predict the RUL. Seven IGBTs were experimented in this prognostics research.
The RUL prediction results were analysed and compared, and the prognostics algorithm was developed and summarised. The accuracy of the RUL prediction was presented, and the root mean square error was utilised to analyse and compare the efficiency and applicability of different models. The study of the
IGBT prognostics and algorithm development were summarised and demonstrated.
ACKNOWLEDGEMENTS
Firstly, I thank my supervisors, Dr. Tarapong Sreenuch, for his guidance and support during my research course. I thank Prof. Antonios Tsourdos for his help and advice during my study.
I want to thank my family and friends encourageing me and giving me confidence in the way on my research.
I thank my sponsor COMAC and CSC, for their necessary scholarship helping me to finish my study.
I thank the current and former researchers on IGBT and Prognostics, who gave me advice and information to perfect my work, I also want to thank the staff in Cranfield who provided convenience through the duration of my study.
TABLE OF CONTENTS
ABSTRACT ... i
ACKNOWLEDGEMENTS... iii
LIST OF FIGURES ... vii
LIST OF TABLES ... x
LIST OF EQUATIONS ... xi
LIST OF ABBREVIATIONS ... xii
1 Introduction ... 1
1.1 Research Project Overview ... 1
1.2 Motivation ... 1
1.2.1 IGBT Accelerated Ageing Experiment ... 1
1.2.2 Market Condition and Industry Requirements ... 2
1.3 Background ... 3
1.3.1 Prognostics Approach ... 3
1.3.2 IGBT Prognostics ... 5
1.4 Dissertation Scope and Outline ... 5
2 Research Aim & Objectives and Contributions ... 7
2.1 Research Aim & Objectives ... 7
2.2 Contributions ... 7
2.3 Publication ... 8
3 Literature Review ... 9
3.1 IGBTs ... 9
3.2 IGBT Failures and Degradation Process ... 10
3.3 IGBT Ageing Experiment and Prognostics ... 12
3.4 Prognostics Approach and RUL Prediction ... 13
3.5 Summary ... 14
4 IGBT Degradation Modelling ... 15
4.1 IGBT Ageing Data Collection and Processing ... 15
4.1.1 IGBT Ageing Experiments System ... 15
4.1.2 IGBT Prognostics Data set ... 22
4.2 Data Analysis of Degradation Process ... 25
4.2.1 Data Processing ... 25
4.2.2 IGBT Degradation ... 28
4.2.3 Degradation Profile... 29
4.3 Modelling IGBT Degradation Profile... 31
4.3.1 IGBT Degradation Modelling ... 31
4.3.2 Gamma Model ... 34
4.3.3 Exponential Model ... 35
4.3.4 Poisson Model ... 36
4.4 Maximum Likelihood Estimation ... 37
4.4.2 Gamma Model ... 38
4.4.3 Exponential Model ... 39
4.4.4 Poisson Model ... 39
4.5 Monte Carlo Simulation ... 40
5 IGBT Prognostics and RUL Prediction ... 43
5.1 Prognostics Approach ... 43
5.2 RUL Estimation for IGBTs ... 45
5.2.1 RUL Prediction ... 45
5.2.2 Gamma Distribution... 47
5.2.3 Exponential Distribution ... 49
5.2.4 Poisson Distribution... 49
5.2.5 Combining Distribution ... 50
5.3 Prediction Implementation of the Statistic Models ... 52
5.3.1 Prediction for IGBT No.1 ... 52
5.3.2 Prediction for IGBT No.2 ... 53
5.3.3 Prediction for IGBT No.3 ... 53
5.3.4 Prediction for IGBT No.4 ... 54
5.3.5 Prediction for IGBT No.5 ... 54
5.3.6 Prediction for IGBT No.6 ... 55
5.3.7 Prediction for IGBT No.7 ... 55
5.4 Prognostics Algorithm ... 56
6 Results Analysis ... 59
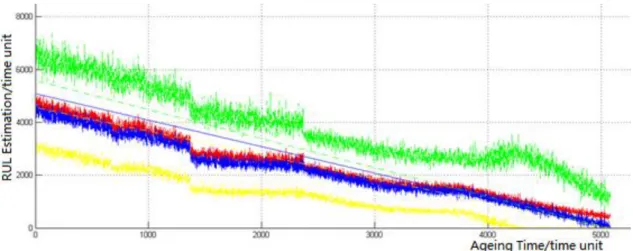
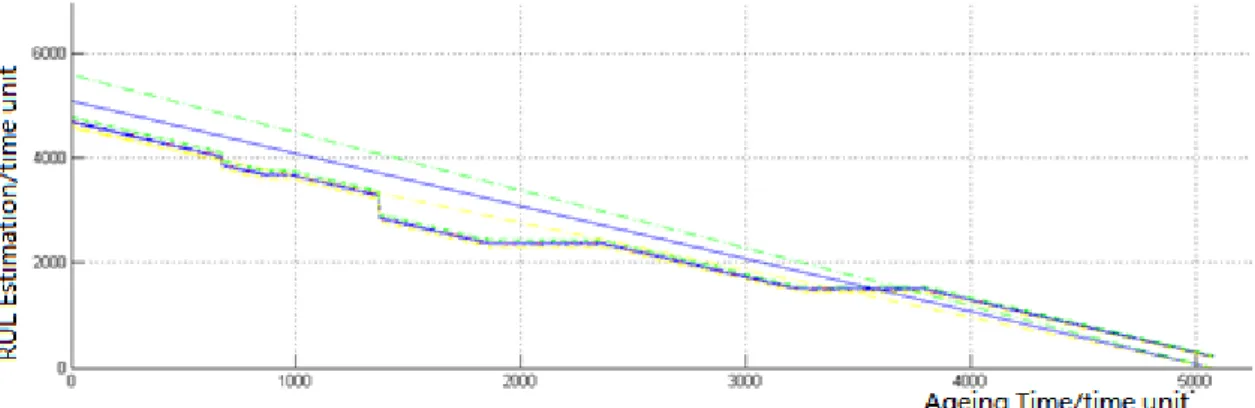
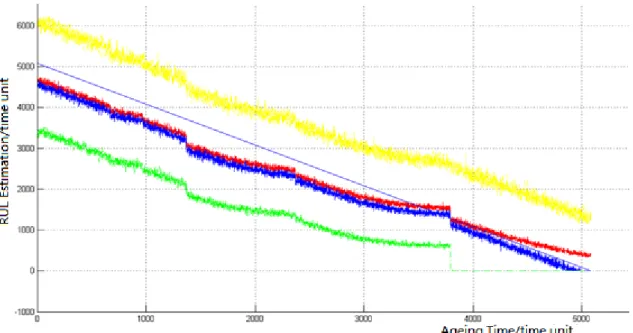
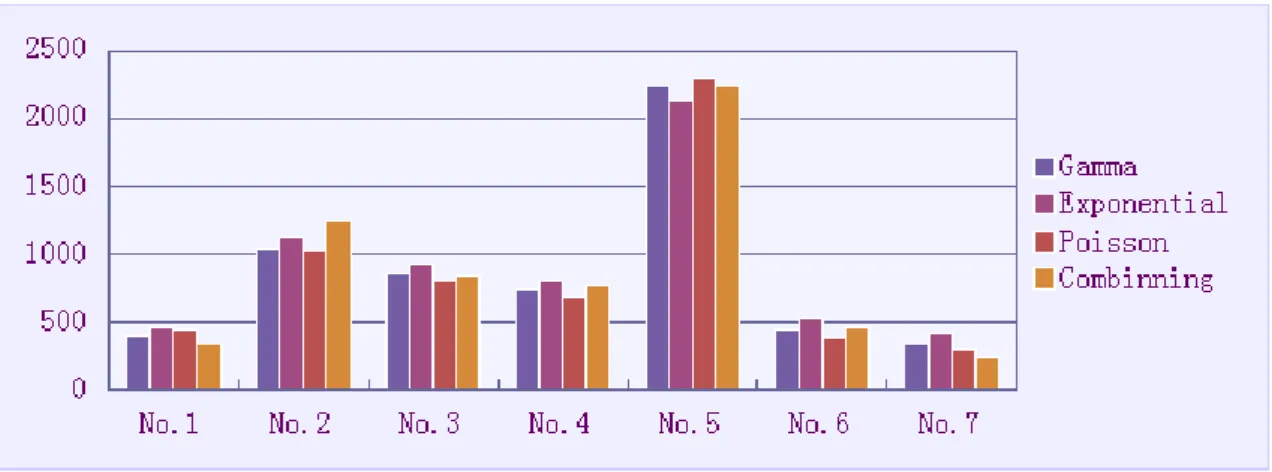
6.1 Prediction Results ... 59
6.2 Accuracy Analysis ... 62
6.3 Root Mean Square Error Comparing ... 66
6.4 Benefits and Challenges of Different Stochastic Model ... 71
7 Conclusions and Further Work ... 73
7.1 Conclusions ... 73
7.2 Future Work ... 73
REFERENCES ... 75
APPENDICES ... 81
Appendix A Prognostics codes ... 81
LIST OF FIGURES
Figure 3-1 IGBT ... 9
Figure 4-1 IGBT accelerated ageing experiments hardware ... 17
Figure 4-2 Process of IGBT prognostics algorithm development ... 18
Figure 4-3 IGBT faults analysis experiment ... 19
Figure 4-4 IGBT accelerated ageing system ... 20
Figure 4-5 Schematic of the ageing process ... 21
Figure 4-6 Matlab structure array ... 22
Figure 4-7 Temperature measurements in the ageing experiments ... 23
Figure 4-8 Currents measurements in the ageing experiments ... 24
Figure 4-9 Collector emitter voltage profile before processing ... 26
Figure 4-10 K-mean data processing method ... 26
Figure 4-11 Collector emitter voltage profile after processing ... 27
Figure 4-12 IGBT degradation profile ... 30
Figure 4-13 IGBT degeneration phase ... 33
Figure 4-14 IGBT degradation models ... 34
Figure 4-15 Gamma distribution ... 35
Figure 4-16 Exponential distribution ... 36
Figure 4-17 Poisson distribution ... 37
Figure 5-1 The IGBT prognostic ... 44
Figure 5-2 RUL predicting process ... 46
Figure 5-3 Gamma model to predict RUL ... 47
Figure 5-4 Exponential model to predict RUL ... 49
Figure 5-5 Poisson model to predict RUL ... 50
Figure 5-6 Combining model to predict RUL ... 51
Figure 5-7 Prediction for IGBT No.1 ... 52
Figure 5-8 Prediction for IGBT No.2 ... 53
Figure 5-9 Prediction for IGBT No.3 ... 54
Figure 5-11 Prediction for IGBT No.5 ... 55
Figure 5-12 Prediction for IGBT No.6 ... 55
Figure 5-13 Prediction for IGBT No.7 ... 56
Figure 5-14 IGBT RUL prediction algorithm flow chart ... 57
Figure 6-1 RUL Prediction Result in Gamma Model ... 59
Figure 6-2 RUL Prediction Result in Exponential Model ... 60
Figure 6-3 RUL Prediction Result in Poisson Model ... 61
Figure 6-4 RUL Prediction Result in Combining Model ... 62
Figure 6-5 Errors computed by Gamma model ... 64
Figure 6-6 Errors computed by Exponential model ... 64
Figure 6-7 Errors computed by Poisson model ... 65
Figure 6-8 Precision of the predicted RUL in the whole process ... 66
Figure 6-9 RMSE for the mean value of predicted RUL in different models ... 68
Figure 6-10 RMSE for the median value of predicted RUL in different models 68 Figure 6-11 RMSE of mean RUL value in Gamma model ... 69
Figure 6-12 RMSE of median RUL value in Gamma model ... 69
Figure 6-13 RMSE of mean RUL value in Exponential model ... 70
Figure 6-14 RMSE of median RUL value in Exponential model ... 70
Figure 6-15 RMSE of mean RUL value in Poisson model ... 71
Figure 6-16 RMSE of median RUL value in Poisson model ... 71
Figure B-1 RUL Prediction result of IGBT No.2 with Gamma model ... 88
Figure B-2 RUL Prediction result of IGBT No.2 with Exponential model ... 88
Figure B-3 RUL Prediction result of IGBT No.2 with Poisson model ... 89
Figure B-4 RUL Prediction result of IGBT No.2 with Combining model ... 89
Figure B-5 RUL Prediction result of IGBT No.3 with Gamma model ... 90
Figure B-6 RUL Prediction result of IGBT No.3 with Exponential model ... 90
Figure B-7 RUL Prediction result of IGBT No.3 with Poisson model ... 91
Figure B-8 RUL Prediction result of IGBT No.3 with Combining model ... 91
Figure B-10 RUL Prediction result of IGBT No.4 with Exponential model ... 92
Figure B-11 RUL Prediction result of IGBT No.4 with Poisson model ... 93
Figure B-12 RUL Prediction result of IGBT No.4 with Combining model ... 93
Figure B-13 RUL Prediction result of IGBT No.5 with Gamma model ... 94
Figure B-14 RUL Prediction result of IGBT No.5 with Exponential model ... 94
Figure B-15 RUL Prediction result of IGBT No.5 with Poisson model ... 95
Figure B-16 RUL Prediction result of IGBT No.5 with Combining model ... 95
Figure B-17 RUL Prediction result of IGBT No.6 with Gamma model ... 96
Figure B-18 RUL Prediction result of IGBT No.6 with Exponential model ... 96
Figure B-19 RUL Prediction result of IGBT No.6 with Poisson model ... 97
Figure B-20 RUL Prediction result of IGBT No.6 with Combining model ... 97
Figure B-21 RUL Prediction result of IGBT No.7 with Gamma model ... 98
Figure B-22 RUL Prediction result of IGBT No.7 with Exponential model ... 98
Figure B-23 RUL Prediction result of IGBT No.7 with Poisson model ... 99
LIST OF TABLES
Table 4-1 IGBT ageing experiments parameters ... 24
Table 4-2 IGBT data processing result ... 28
Table 4-3 IGBT fault modes ... 29
Table 4-4 IGBT degeneration phase ... 30
Table 4-5 IGBTs degradation phases ... 31
Table 4-6 Model parameters ... 38
Table 4-7 Gamma models parameters ... 39
Table 4-8 Exponential models parameter ... 39
Table 4-9 Poisson models parameter ... 40
Table 6-1 RUL prediction results ... 63
Table 6-2 The RUL prediction errors ... 63
Table 6-3 RMSEs for the mean value of predicted RUL ... 67
LIST OF EQUATIONS
(4-1) ... 27 (4-2) ... 32 (4-3) ... 34 (4-4) ... 35 (4-5) ... 36 (4-6) ... 36 (4-7) ... 37 (4-8) ... 37 (4-9) ... 38 (4-10) ... 38 (4-11) ... 38 (4-12) ... 39 (4-13) ... 39 (5-1) ... 47 (5-2) ... 48 (5-3) ... 48 (5-4) ... 48 (5-5) ... 48 (5-6) ... 51 (6-1) ... 62 (6-2) ... 65 (6-3) ... 66 (6-4) ... 66 (6-5) ... 66LIST OF ABBREVIATIONS
AAS Accelerated Ageing System BiFET Bipolar Field Effect Transistor CCD Charge Coupled Device CH Calinski-HarabaszCOMAC Commercial Aircraft Corporation of China, Ltd. COMFET Conductivity-Modulated Field Effect Transistor CU Cranfield University
GEMFET Gain-Enhanced Metal Oxide Semiconductor Field Effect Transistor ICE Collector Emitter Current
IGBT Insulate Gate Bipolar Transistor IGR Insulated Gate Rectifier
IVHM Integrated Vehicle Health Management
MOSFET Metal Oxide Semiconductor Field Effect Transistor NASA National Aeronautics and Space Administration
PC Personal Computer
RMSE Root Mean Square Error RUL Remaining Useful Life
RULP Predicted Remaining Useful Life RULR Real Remaining Useful Life RVM Relevance Vector Machine
Ti Duration Time of the degeneration phase VCE Collector Emitter Voltage
VGE Gate-Emitter Voltage VI Virtual Instrument VTB Virtual Test Bed
1 Introduction
1.1 Research Project Overview
In this thesis, the study is based on the NASA IGBT accelerated ageing experiments and ageing data sets. IGBT accelerated ageing experiments and ageing data are studied and analysed in this thesis. According to the IGBT failure mechanism and degradation characterization, the IGBT degeneration models are built. Monte Carlo simulation method and the precursor parameter, collector emitter voltage (VCE), are integrated to develop the prognostics algorithm on predicting the IGBT remaining useful life (RUL), and then the RUL prediction results are analysed, and the advantage of different models in predicting the IGBT RUL is compared and analysed. Finally, the conclusion is summarised.
1.2 Motivation
1.2.1 IGBT Accelerated Ageing Experiment
Nowadays in order to provide warning and predict failures to avoid calamitous failure of products and systems, there has been an increasing tendency in monitoring the ongoing "health" of them [1]. The IGBT modules play an increasing significant role in on-wing for avionics system, such as communication system in autonomous working, radar system and navigation system and so on. The failures of IGBT components can degrade the efficiency of the systems or result in system failures [2].
In order to be able to predict its failure, a process that can cause an IGBT module to fail must be devised. In general, IGBT modules have several thousand hours' lifetime expectancy [3], but in order to analyse failures from several of them, the lifetime of the modules needs to be reduced. Therefore the process that causes it to fail must still operate the module within its specifications, but in a greatly reduced time frame.
Ergo IGBT accelerated ageing experiments system was developed to investigate the degradation of IGBT and the adoption of precursors for diagnosis and prognosis.
IGBT Accelerated Ageing System is to design and implement a system capable of performing robust experiments on gate controlled power transistors to induce and analyse prognostics indicators [4]. The main goal for the development of experiment system was to identify precursor parameters for device failure, Precursor parameters are parameters of the device that change with time wherein the change can be mapped to degradation in the device. Once the precursor parameters are identified, suitable diagnostics and prognostics algorithms can be implemented using these parameters to provide early warning of failure and predict remaining useful life [5].
Hence, a comprehensive approach to the development of a prognostics framework for IGBTs is required, there is a necessity to develop methods to predict the remaining useful life (RUL) of IGBTs to prevent system stoppage and costly failures. In this study, a framework and study of IGBT prognostics and RUL prediction were developed.
1.2.2 Market Condition and Industry Requirements
Prognostics is very commonly used in high technology sectors, for example the automotive and aerospace industries, for ensuring safety and customer satisfaction. Most modern vehicles monitor their systems to ensure correct operation [6]. If a fault is detected or predicted the user of the vehicle is usually notified before the fault has had a detrimental effect on the vehicle. Modern vehicles also monitor their usage and change their service intervals accordingly. Insulate gate bipolar transistors (IGBTs) are widely used in electric vehicles, railway locomotive and new generation aircrafts, due to the IGBTs have advantages in small conduction resistance and small drive current [7]. Hence, the reliability of IGBTs directly affects the reliability and performance of these vehicle systems. In recent years, a series of research works about IGBT reliability, failure mode and ageing analysis have been carried out widely, and a
suitable prognostics method for IGBT and an efficient algorithm for predicting the IGBT RUL become increasingly important.
In recent years, although the research works on IGBT reliability, failure mode and effect analysis are carried out widely, the prognostics and prediction of the IGBTs remaining useful life (RUL) are still the bottleneck in the research work to develop IGBT health management system.
As electronic components have an increasing application in new generation aircrafts and vehicles, and the amount of electronic failure will also become significant. Fault diagnosis and prognostics, estimation of remaining useful life and health management have a vital role to avoid hazard failure and improve aircraft reliability, reduce maintenance cost and increase performance [8].
Hence, this study is research on IGBT to develop algorithm to estimate remaining useful life of components, and it is considered to contribute to the prognostics technology development in Integrated Vehicle Health Management (IVHM) field and advance the electronic components prognosis.
1.3 Background
1.3.1 Prognostics Approach
Prognostics is the approach of predicting the future situation or health of products or systems by estimating the extent of degradation or deviation from their expected normal working conditions, and by using appropriate models and algorithms to predict the behaviour to failure thresholds [9].
Prognostics is used to predict the remaining useful life (RUL), and this is one of the most significant goals for the prognostics system. It is also the aim of this thesis to develop the algorithm of prognostics. Presently, the most prevailing prognostics approaches include data-driven methods and model-based methods [10]. Data driven prognostics methods utilise precursor data recorded by sensor, which are used to monitor the conditions of the research object, to predict the future operating condition of the system. Relationship between sensor data and mechanisms of degradation and fault will be analysed and
utilised to forecast the healthy condition. Model based methods use modelling approach to predict the remaining useful life of the system.
There are several approaches that have been developed for electronic prognostics. A few examples of these prognostics approaches will be described. The current state of research on prognostics of IGBTs will be discussed in detail. The issues unaddressed in previous IGBT prognostics studies will form the basis for the motivation of the current study.
Saha et al. [11] used a system model approach to estimate the remaining useful life of lithium ion batteries. The battery was represented by a lumped parameter model. The parameters of the model were calculated using relevance vector machine (RVM) regression on experimental data. An extended Kalman filter and particle filter algorithms were used to determine the battery RUL.
Goodman et al. [12] described the use of prognostics cells to predict failure in integrated circuits. The prognostics cell is developed to fail prior to the circuit on the same chip for all realistic operating conditions. Prognostics monitors in the test cell see the exact environment that the actual circuit sees, but at an accelerated rate, thereby providing failure prediction.
Kumar et al. [13] used the data-driven approach to detect anomalies of notebook computers by monitoring performance parameters and comparing them against the historical data using Mahalanobis distance.
A physics-based prognostics approach was used by Cristaldi [14] in the development of a diagnostic system based on a virtual system. Using a Virtual Test Bed (VTB), system faults found in a real world system were simulated along with a normally operating real world system.
For the development of a fault diagnostic system for a brake-by-wire system, Murphey [15] used a similar fuzzy system approach. Six failure modes of the system were identified and three measurement points chosen. The input signals were processed on a segment-by-segment basis, by a feature extraction process, and by fault detection.
1.3.2 IGBT Prognostics
IGBT has been reported to fail suffering extreme electrical and thermal stresses in variable speed drives, and are considered as reliability problems in wind turbines [16], inverters in hybrid electric vehicles and railway traction motors [17]. There is a need to develop methods to detect anomalous behaviour and predict the remaining useful life (RUL) of IGBT to prevent system downtime and costly failures.
IGBT prognostics is a relatively new field with limited studies reported in literature. The majority of the studies are on development of diagnostic techniques to detect anomalies in applications such as automotive, motor drive [7] and railway traction systems.
1.4 Dissertation Scope and Outline
In this thesis, a framework and study of IGBT prognostics and RUL prediction was developed. The IGBT ageing data were processed and analysed, and the mechanism of the IGBT degeneration was studied. Additionally, the IGBT degradation models were built to simulate the IGBT degeneration process and utilised to develop the prognostics algorithm for predicting the IGBT RUL. The RUL prediction results were analysed and compared, and the prognostics algorithm was developed and summarised. The accuracy of the RUL prediction was presented, and the root mean square error was utilised to analyse and compare the efficiency and applicability of different models.
The research scope and research contents of this study is presented in chapter 1, additionally the motivation of researching IGBT ageing experiment and prognostics is introduced. The background of the prognostics is described. In chapter 2, the research contributions and research aim, objectives are presented. Chapter 3 is the literature review, and the IGBT mechanism and characterization, failure mode and degeneration are studied. IGBT accelerated ageing experiments are also investigated. The current research works on IGBT are summarised.
Chapter 4 involves IGBT accelerated ageing experiments, IGBT ageing data and degradation modelling. The ageing data are processed and the degradation profiles of IGBT are analysed. Maximum likelihood method is utilised to computing the model parameters. In chapter 5, Monte Carlo simulation method and IGBT degradation models are used to predict the RUL, and the algorithm of IGBT prognostics is developed.
The RUL prediction results are analysed in chapter 6 and the errors and root mean square errors are analysed to compare the efficiency of different models in predicting the RUL. In chapter 7, the conclusion is summarised and the future works are discussed.
2 Research Aim & Objectives and Contributions
2.1 Research Aim & Objectives
The research aims to develop a degradation model and approach for predicting remaining useful life of power electronics components (e.g. IGBTs) critical to avionics systems, all of which are required for an aircraft system level health management.
The objectives are:
To study failure mechanisms and degradation profiles of a power electronics component (e.g. IGBT).
To apply stochastic processes in modelling degradation (from experimental data) of a power electronics component.
To develop an estimation algorithm to determine degradation level of a power electronics component based on sensor measurements.
To develop a predictive algorithm for, based on current degradation level, estimating the remaining useful life of a power electronics component.
2.2 Contributions
The main contribution of this study is the development and implementation of a prognostics framework for IGBTs, and a prognostics algorithm with Monte Carlo simulation and with the collector emitter voltage as a precursor parameter is developed.
Specifically, the IGBT prognostics approach in this thesis developed by the author, which uses probability distributions to model the IGBT degeneration phases and Monte Carlo simulation to predict IGBT remaining useful life, is novel in the field of the IGBTs prognostics and health management. In contrast with the conventional Hidden Markov approach which computes for each time step of the whole ageing process, this new prognostics approach which computes according to the duration time based on the degeneration phase is more suitable for real-time prognostics and implemented in a low computational power devices, like embedded hardware.
Additionally, a combining model which combines one stochastic model based on the duration time of the IGBT degeneration phase and one stochastic model based on the ending time of the IGBT degeneration phase is developed to implement in RUL prediction. Especially, this combining model performs better than other conventional models in the prognostics of IGBT No.1 and No.7
Furthermore, seven IGBT in ageing experiments were implemented in prognostics, and the remaining useful life of the IGBTs were predicted. The results of the prediction were analysed. The efficiency of different stochastic models on predicting the IGBTs were compared.
Finally, in this study, a prognostics approach based on the Monte Carlo simulation and stochastic models is developed, compared with other prognostics approaches, less precursor parameters are required and the prediction efficiency is as high as some other complex prognostics approaches, this prognostics approach is, probably, to be easier to be used in application.
2.3 Publication
Parts of this thesis have been published by the authors:
•T. Sreenuch , A. Alghassi and Y. Xie (2013). Probabilistic Monte-Carlo Method for Modelling and Prediction of Electronics Component Life. Submitted to: International Journal of Advanced Computer Science and Applications.
•Y. Xie (2014). Prognosis of Power Electronics Components Applies in Aircraft Maintenance. Submitted to: Science & Technology Information (China).
3 Literature Review
3.1 IGBTs
The insulated-gate bipolar transistor or IGBT is widely applied as its character of electronic switch, is a three-terminal power semiconductor device [18]. It is mainly used to fast switch and combine electrical circuit in high efficiency in newer devices [19]. The insulated-gate bipolar transistor is also called the conductivity-modulated field effect transistor (COMFET), insulated gate rectifier (IGR), bipolar field effect transistor (BiFET), gain-enhanced metal oxide semiconductor field effect transistor (GEMFET) and injector field effect transistor [20].
Figure 3-1 IGBT [2]
An IGBT unit is similar to an n-channel vertical construction power Metal Oxide Semiconductor Field Effect Transistor (MOSFET), while the former is constructed by the p+ collector layer, the MOSFET with n+ drain. Which is the same construction as a vertical PNP bipolar junction transistor [21] as seen in Figure 3-1. The main characteristic of the IGBT configuration is that the bottom of the device is formed by the collector (drain) while the emitter (source) region is the same as a traditional MOSFET. Figure 3-1 indicates the schematic
construction of the n-channel IGBT. The additional p+ layer in the IGBT is injected into the drift region which acts as a source of holes during operation. These injected holes enable switch-off rapidly when they recombine with the excess electrons remained in the body of the IGBT after turned-off [22].
IGBT has been reported to fail suffering extreme electrical and thermal stresses in variable speed drives, and are considered as reliability problems in wind turbines [16], inverters in hybrid electric vehicles and railway traction motors [17]. There is a need to develop methods to detect anomalous behaviour and predict the remaining useful life (RUL) of IGBT to prevent system downtime and costly failures.
3.2 IGBT Failures and Degradation Process
The most common failure modes for IGBT modules used in power converters of the power and voltage associated with this thesis, as described in Chapter 4, is bond wire lift off and stress cracks in the solder that joins the various parts of the IGBT modules [23].
Degradation means the performance of products is reducing, the reliability is decreasing and their life is shortening. The covariates of the products age or deteriorate are the main reason of degradation. In other words, reliability declines and products failure caused by degradation usually [24]. Many failure mechanisms can be traced to an underlying degradation process, and degradation models represent the underlying prognostics.
Degradation could be classified into two types: forced degradation and natural degradation. Forced degradation is external to systems, where its loading according to the increased demand increases gradually, when the threshold is reached exceed which the systems cannot carry the load safely. However, natural degradation is based on age or is time-dependent. The term ageing refers to a gradual degradation that occurs in systems as an internal process, thus it makes the systems fail [25].
A major reason for the failure of IGBTs is bond wire lift-off [26], which results from the thermal cycles the device is subjected to in operation. As the
temperature of the device cycles, the difference in the thermal expansion coefficients of the two materials causes stress to build up in the bonding interface between the wire and the silicon. The bond wires then become disconnected and the device fails into an open circuit. If the device has multiple bond wires, the wires closest to the centre of the chip experience the stress, as this is where the junction temperature is at a maximum. When they fail, the remaining bond wires have to carry the full current of the device and as a result they will subsequently also fail. This phenomenon is not only confined to the high current carrying wires; Ciappa has shown that gate bond wires can also fail as a result of stress induced by thermal cycling [27]. He developed a model to predict the failure of IGBTs using experimental data for bond wire lift-off failures. However, he notes that this model is for aluminium bond wires and does not take into consideration countermeasures to bond wire lift-off that have been developed and are now increasingly being used on new IGBT modules, e.g. strain buffers and bond wire coatings.
IGBTs can also fail through partial discharge [28]. This is a particular problem for high voltage IGBTs (over 1.5kV). Partial discharge has been found to occur in the silicon gel on the metallisation edges and interfaces of the device and is the result of imperfect etching of the silicon during manufacture. Fabian has taken this research further using Charge Coupled Device (CCD) technology to record the small light intensities that are emitted by electro-luminescence effects as well as the light caused by actual partial discharge [29]. He found that the main causes for insulation ageing are water trees, partial discharge and electrical trees. Water trees are formed when the silicon gel comes into contact with an aqueous electrolyte. Ions penetrate the insulation and a diffuse structure of micro voids are formed. Electrical trees are similar but are a result of the breakdown of the insulation by an electric field. They propagate into the insulation in a tree-like shape with a branch-like spiky structure. Both Mitic [30] and Fabian [31] concur that these insulation breakdowns take place at high electric field strengths and therefore partial discharge does not have to be considered for IGBTs operating below 1kV.
3.3 IGBT Ageing Experiment and Prognostics
Nowadays, in order to provide warning and predict failures to avoid calamitous failure of products and systems, there has been an increasing tendency in monitoring the ongoing "health" of these products [1]. The IGBT modules play an increasingly significant role in on-wing for avionics system, such as communication system in autonomous working, radar system and navigation system and so on. The failures of IGBT components can degrade the efficiency of the systems or result in system failures [2].
In order to be able to predict its failure, a process that can cause an IGBT module to fail must be devised. In general, IGBT modules have several thousand hours' lifetime expectancy [3], but in order to analyse failures from several of them, the lifetime of the modules needs to be reduced. Therefore the process that causes it to fail must still operate the module within its specifications, but in a greatly reduced time frame.
Ergo, IGBT accelerated ageing experiments system was developed to investigate the degradation of IGBT and the adoption of precursors for diagnosis and prognosis.
IGBT Accelerated Ageing System (AAS) is to design and implement a system capable of performing robust experiments on gate controlled power transistors to induce and analyse prognostics indicators [4]. The main goal for the development of the experiments system was to identify precursor parameters for device failure. Precursor parameters are parameters of the device that change with time wherein the change can be mapped to degradation in the device. Once the precursor parameters are identified, suitable diagnostic and prognostics algorithms can be implemented using these parameters to provide early warning of failure and predict remaining useful life [5].
Implementation of the accelerated ageing system involved developing the hardware and software to perform power cycling of power semiconductor devices. The experimental test bed for this project was developed by Sonnenfeld et al [13].
The device parameters that are monitored include the gate-emitter voltage (VGE), collector-emitter current (ICE), collector-emitter voltage (VCE) and case and package temperatures. The data are stored in a structure array that is compatible with Matlab. This allows for easy interface with diagnostics and prognostics algorithms that are developed using Matlab. The accelerated ageing system is autonomous. The user only initiates the test sequence. When the device under test fails, the system shutdown is initiated automatically [4]. IGBT prognostics is a relatively new field with limited studies reported in literatures. The majority of the studies are on development of diagnostics techniques to detect anomalies in applications such as automotive, motor drive, avionics [7] and railway traction systems.
3.4 Prognostics Approach and RUL Prediction
Prognostics is used to predict the remaining useful life (RUL), and this is one of the most significant goals for the prognostics system. It is also the aim to develop the algorithm of prognostics. Presently, the most prevailing prognostics approaches include data-driven methods and model-based methods [10]. Data driven prognostics methods utilise precursor data recorded by sensors, which are used to monitor the condition of the research object, to predict the future operating condition of the system. Relationship between sensor data and mechanism of degradation and fault will be analysed and utilised to forecast the health condition. Model based methods use modelling approach to predict the remaining useful life of the system.
There are several approaches that have been developed for electronic prognostics. A few examples of these prognostics approaches will be described. The current state of research on prognostics of IGBTs will be discussed in detail. The issues unaddressed in previous IGBT prognostics studies will form the basis for the motivation of the current study.
Saha et al. [11] used a system model approach to estimate the remaining useful life of lithium ion batteries. The battery was represented by a lumped parameter model. The parameters of the model were calculated using relevance vector
machine (RVM) regression on experimental data. An extended Kalman filter and particle filter algorithms were used to determine the battery RUL.
Goodman et al. [12] described the use of prognostics cells to predict failure in integrated circuits. The prognostics cell is developed to fail prior to the circuit on the same chip for all realistic operating conditions. Prognostics monitors in the test cell see the exact environment that the actual circuit sees, but at an accelerated rate, thereby providing failure prediction
Kumar et al. [13] used the data-driven approach to detect anomalies of notebook computers by monitoring performance parameters and comparing them against the historical data using Mahalanobis distance.
A physics-based prognostics approach was used by Cristaldi [14] in the development of a diagnostic system based on a virtual system. Using a Virtual Test Bed (VTB), system faults found in a real world system were simulated along with a normally operating real world system.
For the development of a fault diagnostic system for a brake-by-wire system, Murphey [15] used a similar fuzzy system approach. Six failure modes of the system were identified and three measurement points chosen. The input signals were processed on a segment-by-segment basis, by a feature extraction process, and by fault detection.
3.5 Summary
From this review, although several approaches have been investigated for specific applications, it could be concluded that an efficient IGBT prognostics approach based on the IGBT degradation mechanism and features for predicting remaining useful life with finite precursor parameters is required to be developed.
4 IGBT Degradation Modelling
4.1 IGBT Ageing Data Collection and Processing
4.1.1 IGBT Ageing Experiments System
The main goal of the IGBT accelerated ageing experiments system is designed to study the ageing characters of the IGBT and develops the algorithm of prognostics for prediction of the remaining useful life. The IGBT degradation data set is acquired from the ageing process system, which was provided by the Ames laboratory of NASA [32], and the data set is utilised to develop and design prognostics algorithm for semiconductor components such as IGBTs having an increasing application in modern multiple vehicle systems.
IGBT accelerated ageing experiments belong to the project in NASA to investigate the degradation characterizations of electronic components [32], as electronic components have an increasing utilisation in new generation aircrafts and vehicles, and the amount of electronic failure will also become significant. Fault diagnosis and prognostics, estimation of remaining useful life and health management have a vital role to avoid hazard failure and improve aircraft reliability, reduce maintenance cost and increase performance. The degradation mechanism of electronic components are generally different from mechanical systems [33], ergo IGBT accelerated ageing experiments system was developed to investigate the degradation of IGBT and the adoption of precursors for diagnosis and prognosis. In additional, algorithm of prognosis for IGBT which used to predict the remaining useful life will be studied and developed via these experiments and research [32].
IGBT accelerated ageing experiments provide prognostics data set which are utilised to develop and compare various algorithms for IGBT prognosis and RUL estimation. Several variables are recorded including experimental environment condition parameters and IGBT degradation characterization parameters [34], which are the main research object in this thesis. Prognostics algorithm development now is the main bottlenecks in IVHM domain [32]. Hence, IGBT accelerated ageing experiments are the significant input to the prognostics
algorithm development, which is used to estimate remaining useful life of components. It is also considered to contribute to the prognostics technologies development in the broader field and advance the electronic components prognosis.
IGBT accelerated ageing experiments are based on the ageing platform which induces the degradation and electronic faults into the test system. Prevalently, four kinds of accelerated ageing methods are widely used in accelerated ageing experiments, which are thermal cycling, hot carrier injection, electrical over-stress and time-dependant dielectric breakdown stimulus [33]. The IGBT functional failure such as die solder degradation and wire lift are brought by the thermal cycling accelerated ageing approach. Hot carrier injection could accelerate electrons and holes pass into gate oxide, which could result in the increase of IGBT threshold voltage. IGBT condition mutation and lighting could be caused by the electrical overstress due to the excessive voltage, current or power. The breakdown of IGBT gate oxide would happen when the charge injection exceeds the threshold which is caused by accumulating of the temperature in the gate oxide when it is being operated [33].
Accelerated ageing approaches such as thermal cycling and electrical overstress are used in IGBT accelerated ageing experiments to speed up the degradation and failure of the IGBT in experimental environments which simulate the scenarios of industrial practical application. Precursor parameters, such as collector voltages, collector currents, gate voltages and currents, and environmental parameters such as temperature are monitored and recorded to be utilised for IGBT diagnosis and prognosis technology research [35].
Hardware experiment platform as shown in figure 4-1 is used in IGBT accelerated ageing experiments, and various experiment scenarios are simulated. Accelerated ageing stresses such as thermal cycling and electrical overstress are injected to stimulate the failure of IGBT happened in shorter operating time [20]. Failure mechanism and failure mode could be analysed by researchers after considerably shorter running time than that in practical application, and precursor parameters would also be selected and adopted. The
running to failure data, which are used to analyse and develop the prognostics algorithm. Hence, IGBT accelerated ageing experiments are advantageous to the investigation and development of IGBT prognostics algorithm.
Figure 4-1 IGBT accelerated ageing experiments hardware [32]
Ames laboratory of NASA provided a series of standards for IGBT accelerated ageing experiments and the platform designing, the experiments data and measurements are shared in the website of NASA as an open databases used in developing prognostics algorithm for researchers in the world [32].
IGBT accelerated ageing data sets are measurements and sensor data collected from IGBT accelerated ageing experiment platform, which include the measurements being recorded from IGBT experimental (or operating) environment and survey data representing the deterioration of IGBT in the experiments. The data sets from NASA contain mass data from thermal overstress ageing experiments, including several parameters being recorded continuously such as collector current, collector voltage, gate voltage, package temperature etc. [34]. These data and parameters are monitored and recorded constantly until the IGBT failure in accelerated ageing experiments. The data
sets are formatted in a data array which could be read by Matlab to facilitate analysis and processing for the data in the subsequent research and investigation. Prognostics algorithm would be developed with these data as samples and research objects.
As shown in the following figure 4-2, the process of the prognostics algorithm development is indicated. Firstly, IGBTs are tested in accelerated ageing experiments following standard experiment procedures in an environmental simulation scenario to accelerate ageing and failure. The monitoring data and experiments parameters are recorded and collected to transport into the software platform which are used as data formation and data storage. IGBT diagnostic and prognostics investigation will based on these data sets. Prognostics algorithm for RUL prediction will be developed, and Monte Carlo simulation will be utilised in the algorithm and which will be elucidated in the subsequent chapters. IGBT accelerate aging experiments platform IGBT aging data set MOSFET/ IGBT Precursors parameters Prognostic algorithm development
Figure 4-2 Process of IGBT prognostics algorithm development
Currently, IGBTs are widely used in the field of industrial control, such as automotive, motor drive and railway traction systems [28], the IGBT failure modes and degradation mechanism were investigated and researched extensively. For instance, Patil et al. [26] studied IGBT deterioration characterization and failure mode mechanism. As shown in figure 4-3, it is an IGBT with extreme damage in IGBT faults analysis experiment. However, Prognostics algorithm development is still the bottleneck in the domain of Prognostics and health management system, and which reduced the application
in industrial domain of health management monitoring technology. Hence, the investigation focusing on the prognostics algorithm development and algorithm comparison analysis highlights its importance and significance. IGBT ageing data sets are utilised to diagnose and predict the RUL, and algorithm for estimation of IGBT RUL will also use them as valuable research resource.
Figure 4-3 IGBT faults analysis experiment [32]
IGBT accelerated ageing experiments system includes hardware and software to induce failure, simulate scenario, control the progress of the experiments and record the experiments data. Sonnenfeld et al. [33] developed and defined the experimental test platform and requirements. Figure 4-4 shows the schematic of the IGBT Accelerated Ageing System (AAS). The hardware consists of a 300MHz Agilent DSO5034A oscilloscope with 1ns sample time and 1MB memory, a 20 MHz Agilent 33220A function generator for generating gate signals, a National Instruments PCI-6229 data acquisition and source card, a input/output connector block containing SCC-TC02 thermocouple measurement modules, a Agilent 6652A 25A/20V DC programmable power supply and a PC with LabVIEW [28].
Figure 4-4 IGBT accelerated ageing system [20]
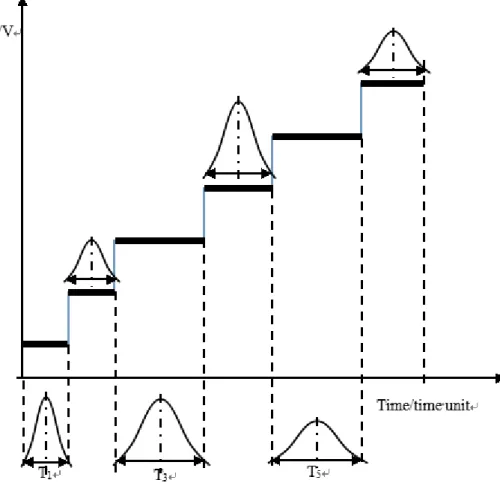
The ageing software consists of programs to control the ageing process, initiate and record measurements, and shut the system down upon device failure [26]. The schematic of the ageing process used to age the IGBTs in this study is shown in Figure 4-5. The IGBTs were power cycled under a resistive load with a predefined frequency, duty cycle, gate voltage and collector-emitter voltage. The device switching was controlled by temperature limits. The device under test was switched on and off using a function generator. The device temperature increased with switching as a result of conduction and switching losses. When the temperature rose beyond a pre-set level Tmax, device switching was stopped. Switching was resumed again when the temperature fell below a pre-set value of Tmin. No external heat-sink was attached to the device and no external cooling was provided.
Figure 4-5 Schematic of the ageing process [20]
Labwiew programs/subroutines are called virtual instruments (VIs). Two Labview virtual instruments (VIs) were developed. The first VI, called the ageing VI was used to control the function generator based on temperature measurements. The second VI called the data storage VI was used to acquire and store voltage, current and temperature data.
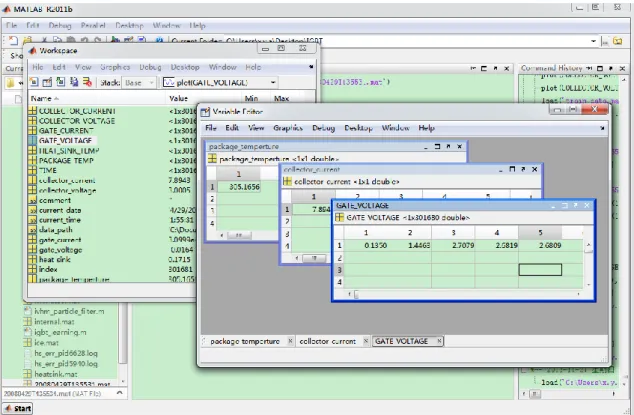
The data storage VI stores data into a Matlab structured array file. The Matlab structure array is shown in Figure 4-6. The benefit of a structure array is the ability to store information of different data types within a given array.
Figure 4-6 Matlab structure array
4.1.2 IGBT Prognostics Data set
IGBT ageing data set contains several device parameters that are monitored including the gate-emitter voltage (VGE), collector-emitter current (ICE), collector-emitter voltage (VCE) and case and package temperatures. The data are stored in a structure array that is compatible with Matlab [32]. This allows for easy interface with diagnostic and prognostics algorithms that are developed using Matlab. As shown in figure 4-6.
IGBT ageing data set was acquired from the standard IGBT accelerated ageing experiments procedures. Ames laboratory of NASA collected and shared all ageing data surveyed in the standard ageing experiments donated by various universities, agencies and companies. In this thesis, the study of IGBT prognostics algorithm for prediction of remaining useful life is also based on the ageing data set from NASA [33].
The IGBT ageing data provided by Ames laboratory of NASA contain different sets of data collected from thermal overstress accelerated ageing experiments.
These ageing data were surveyed and recorded from the IGBT accelerated ageing experiments following the standard test procedures which were defined in literature [33].
The figure 4-7 shows the package temperature variation during the IGBT degradation in the ageing experiment. As the thermal cycling stress is induced into the IGBT experiment system, the package temperature indicates a cycling vibration following a certain plus frequency. At first the package temperature fluctuates between about 268℃ and 272℃, but the amplitude of the package temperature fluctuation increases from the 299000th time unit until the IGBT becomes fail. The temperature of the package increases constantly and the ageing experiment is stopped when the IGBT fails [34].
Figure 4-7 Temperature measurements in the ageing experiments [33]
As shown in figure 4-8, the IGBT collector emitter currents (ICE) data is recorded. The profile indicates that the ICE waves in a form of plus during the ageing process, and the ICE plus interval begins to increase gradually when the
IGBT is going to fail, the features of which is similar to the change of the package temperature before the IGBT failure.
Figure 4-8 Currents measurements in the ageing experiments [33]
The IGBT ageing data recorded in the Matlab from the IGBT accelerated ageing experiments include parameters in table 4-1.
Table 4-1 IGBT ageing experiments parameters
Item List of the ageing experiment parameters
1 Collector Current
2 Collector Voltage
3 Gate Current
4 Gate Voltage
5 Heat Sink Temperature
6 Package Temperature
7 Time
As shown in figure 4-7 and figure 4-8, the phenomena of which the package temperature and the collector emitter current indicating in profiles during the
IGBT degradation process before its failure reflect the harbinger features of the IGBT degeneration [35]. This kind of parameters could be used as precursor parameters in prognostics and diagnostics. In the study of this thesis, collector emitter voltage (VCE) is used as precursor parameter in IGBT prognoses to predict the RUL and develop the prognostics algorithm.
4.2 Data Analysis of Degradation Process
4.2.1 Data Processing
The aim of data processing is to gain useful information from the data with the approach of analysis and sorting [21]. In this thesis, the IGBT ageing data VCE are processed by the K-means clustering method which is presented in the literature [35] and Alghassi has described and processed the ageing data in state-based prognostics models. In this study, the research will be based on these processed data.
Collector emitter voltage is utilised as precursor parameter for the IGBT ageing prognostics in this study, the profile of the VCE collected from the ageing
experiment is presented in figure 4-9. The collector emitter voltage of the IGBT presents a monotonically increasing in the whole ageing process and the VCE also presents a fluctuation and oscillation during this process [36], but the VCE falls quickly at the end of the ageing process when the IGBT fails. The overall ageing process is more than 10000 time units.
Figure 4-9 Collector emitter voltage profile before processing
The ageing data of collector emitter voltage as precursor parameter are processed by K-mean clustering method. As shown in figure 4-10, the K-mean clustering method includes 2 steps, clustering and cluster evaluation.
Training samples Clustering Cluster evaluation Trained model Expected RUL calculation Expected RUL
Figure 4-10 K-mean data processing method [35]
The computing formula is present as equation 4-1. Alghassi [35] has described this method in detail and the research in this thesis will be based on the result of this work.
[∑ ‖ ‖
] [
∑ ∑ ‖ ‖
]
⁄ (4-1)
Where CH is the evaluation parameter in the K-mean clustering method which is defined by Calinski-Harabasz (CH)
k is the number of clusters in k-means clustering zc is the cluster validity index
x is the given data for clustering
The figure 4-11 shows the profile of the VCE after being processed with the K-mean method. As shown in the figure the voltage of the VCE presents an increase step by step during the whole IGBT ageing process. It is much easier to analyse the IGBT degeneration process by the ageing data VCE after being processed. The variation of the VCE voltage in the whole ageing process could be separated into seven stages, and the VCE voltage of each stage is different.
Figure 4-11 Collector emitter voltage profile after processing
In this study, seven IGBTs have been researched and analysed, and seven IGBTs ageing data were processed. According to the K-mean method, the seven IGBTs VCE processed data were computed in Matlab. From figure 4-11, seven stages are separated from the whole IGBT ageing process, and the
duration times for which the IGBT VCE stays in each stage are computed and listed in table 4-2. This data will be used in IGBT prognostics and RUL prediction.
Table 4-2 IGBT data processing result
IGBT degradation process IGBT No. 1st phase failure time (time unit) 2nd phase failure time (time unit) 3rd phase failure time (time unit) 4th phase failure time (time unit) 5th phase failure time (time unit) 6th phase failure time (time unit) Failure Time (time unit) 1 670 970 1368 2369 3793 5079 10740 2 827 827 1389 1389 2306 3208 5075 3 1099 1099 1905 2490 2900 3889 6799 4 894 894 1733 2384 2789 3887 5141 5 927 1055 2115 2544 3388 7449 10285 6 578 578 1560 2109 3403 4236 12164 7 750 1631 2755 3001 3757 5079 6861
time unit: represents time durations at a given unit in the experiments 4.2.2 IGBT Degradation
Because there are many uncertain factors effecting the quality of IGBT during the process of IGBT manufacturing and packaging, the IGBT may have various uncertain and potential defects after the completion of IGBT producing due to these uncertain factors. The defects are the main cause which results in the ageing and failure in the process of working. Table 4-3 lists the main IGBT internal fault making the IGBT degeneration in using. Due to the uncertainty and randomness of internal defects in IGBT, the failure of the IGBT is random and the ageing and degeneration process of the IGBT are also uncertain and random.
Table 4-3 IGBT fault modes
Item Fault Mode
1 Thermal Runaway 2 Latch Up 3 Dielectric Gate Breakdown 4 Collector/emitter degradation 5 Piping/Contact Migration 4.2.3 Degradation Profile
As shown in figure 4-12, it indicates the profile of the IGBT collector emitter voltage in the whole process of the IGBT degradation. The voltage of the VCE presents an increase step by step during the whole IGBT ageing process. The variation of the VCE voltage in the whole ageing process could be separated into seven stages, and the VCE voltage of each stage is different.
The voltage of the VCE starts at about 2.45V at the beginning of the ageing process, and the whole process is separated into seven phases according to the variation of the VCE. Then the voltage of the VCE increases about 0.5V each time phase by phase, but within each phase the voltage of the VCE basically keeps at a constant level with littler fluctuation.
Figure 4-12 IGBT degradation profile
Hence, according to the analysis of the IGBT VCE profile, the IGBT degradation process could be separated into several phases based on the different voltage of the VCE.
In this thesis, the IGBT process will be defined as 6 phases, and when the voltage of VCE increases at 5.45V the IGBT fails. The research and prognostics in this thesis will be based on this.
After data processing, the duration of each degeneration phase for IGBT No.1 is listed in table 4-4
Table 4-4 IGBT degeneration phase
IGBT Degradation Process
Degradation Phase 1st 2nd 3rd 4th 5th 6th
Collector Emitter Voltage 2.45V 2.95V 3.45V 3.95V 4.45V 4.95V Duration Time (time unit) 670 300 398 1001 1424 1286
4.3 Modelling IGBT Degradation Profile
4.3.1 IGBT Degradation Modelling
IGBT Degradation Modelling is to utilise the IGBT ageing data according to the probability of statistical distribution to establish the stochastic statistical model, which is used to predict the remaining useful life of IGBTs [38].
IGBT degradation process is considered to be random and the process of IGBT deterioration could be described by the numbers in table 4-5 after the data processing, and the table 4-5 indicates the IGBT degradation of the whole run to a failure. As shown in the table, there are 7 IGBTs ageing data, the process for the IGBT degradation of running-to-fail is separated into 6 steps, and each number in the table represents the duration of the step. In other words, before the IGBTs completely fail, the IGBTs would deteriorate and undergo 6 degeneration phases, and each phase sustains a period until the IGBTs continue to degenerate into the next degradation phase. The IGBTs would completely fail when they have finished the whole six degeneration phases. After the data processing, the time spans of six degeneration phases are recorded in table 4-5. Take the first IGBT for example, the operational useful life of IGBT-No.1 is 5079 time units, and the duration of the IGBT staying in its first degeneration phase is 670 time units, then the IGBT downgrades into the second degeneration phase and stays 300 time units before its further degeneration to step into the third degeneration phase. And so on, until the IGBT has stayed for 1286 time units in the last phase, the IGBT continues to degrade and becomes a complete failure.
Table 4-5 IGBTs degradation phases
Duration of Each Phase IGBT No. duration time 1st layer
(time unit) 2nd layer duration time (time unit) 3rd layer duration time (time unit) 4th layer duration time (time unit) 5th layer duration time (time unit) 6th layer duration time (time unit) IGBT life (time unit) 1 670 300 398 1001 1424 1286 5079 2 827 0 562 0 917 902 3208 3 1099 0 806 585 410 989 3889 4 894 0 839 651 405 1098 3887
5 927 128 1060 429 844 4061 7449
6 578 0 982 549 1294 833 4236
7 750 881 1124 246 756 1322 5079
time unit: represents time durations at a given unit in the experiments
According to the characterization of the IGBT and the mechanism of failure, the occurrence of the IGBT degeneration is random. In other words, the time duration of each degradation phase is considered to be random and follow a stochastic statistical probability distribution. Hence, the IGBTs degradation models are established from these considerations, and RUL prediction would be based on the degradation models. The durations of each IGBTs degeneration phase are utilised as samples to build stochastic models, specifically, the whole process of IGBT running-to-fail has 6 steps and IGBTs become failed until which have degenerated total 6 degeneration phases. 6 independent stochastic process models could be built to represent the homologous degeneration phases which follow the random statistical probability distribution. In this thesis, Gamma distribution, Exponential distribution and Poisson distribution are utilised in the degradation modelling.
As shown in figure 4-13, the IGBT degeneration and failure are considered to be random, so the duration time (Ti) of the degeneration phase is considered to be a random variable. The y-axis in the figure represents the collector emitter voltage of the IGBT, and the x-axis represents the ageing time of the experiment. The figure indicates that the duration time (Ti) in which the IGBT was measured in different voltage of VCE is a random variable and it could be represented by the stochastic statistical probability models. The probability distribution function could be represent by equation 4-2.
( ) (4-2)
Where p is the probability of the distribution Ti is the duration time (time unit)
Figure 4-13 IGBT degeneration phase
As shown in figure 4-14, the IGBT degradation process is separated into 6 phases, the duration time (Ti) of each phase is an independent random variable. Hence, the whole IGBT ageing process could consist of 6 independent stochastic distribution models.
Figure 4-14 IGBT degradation models
4.3.2 Gamma Model
Gamma Model is a degradation model that uses the Gamma probability distribution to develop prognostics algorithm to predict the RUL of IGBTs. During the whole process of IGBT degeneration, the IGBT operational time in each degeneration phase follows the Gamma probability distribution. In other words, the duration time (Ti) of the IGBT degeneration phase is a random variable with a Gamma distribution.
The probability density function of the Gamma distribution is:
( ) (
( )
⁄ ) (4-3)
Where κ is the shape parameter and θ is scale parameter, so that the duration time (Ti) of the IGBT degeneration phase could be represented by equation 4-4:
( ) (
( )
⁄ ) (4-4)
Where Ti is the duration time of the IGBT degeneration phase (time unit)
x is the random variable
P is the probability of the distribution
The profile of the Gamma probability density function is shown in figure 4-15.
Figure 4-15 Gamma distribution [36]
4.3.3 Exponential Model
Exponential Model is a degradation model that uses the Exponential probability distribution to develop prognostics algorithm to predict the RUL of IGBTs. During the whole process of IGBT degeneration, the IGBT operational time in each degeneration phase follows the Exponential probability distribution. In other words, the duration time (Ti) of the IGBT degeneration phase is a random variable with an Exponential distribution.
( ) (4-5)
Where λ is the parameter of the distribution, so that the duration time (Ti) of the IGBT degeneration phase could be represented by equation 4-6
( ) (4-6)
Where Ti is the duration time of the IGBT degeneration phase (time unit)
x is the random variable
The profile of the Exponential probability density function is shown in figure 4-16.
Figure 4-16 Exponential distribution [36]
4.3.4 Poisson Model
Poisson Model is a degradation model that uses the Poisson probability distribution to develop prognostic algorithm to predict the RUL of IGBTs. During the whole process of IGBT degeneration, the IGBT operational time in each degeneration phase follows the Poisson probability distribution. In other words, the duration time (Ti) of the IGBT degeneration phase is a random variable with a Poisson distribution.
( )
(4-7)
Where λ is the parameter of the distribution, so that the duration time (Ti) of the IGBT degeneration phase could be represented by equation 4-8
( )
(4-8)
Where Ti is the duration time of the IGBT degeneration phase (time unit)
x is the random variable
The profile of the Poisson probability density function is shown in figure 4-17.
Figure 4-17 Poisson distribution [36]
4.4 Maximum Likelihood Estimation
4.4.1 Model Parameters
There are unknown parameters to be determined in the Gamma models, Exponential models and Poisson models. The Maximum Likelihood Method is used to calculate the model parameters. Table 4-6 lists the parameters of each model.
Table 4-6 Model parameters
Item Models Parameters
1 Gamma κ, θ
2 Exponential λ
3 Poisson λ
In order to calculate the model parameters, the duration times of seven IGBTs in degradation process are used as statistical samples, and the six degradation phases are independent stochastic process. According to the maximum likelihood method, the parameters of the models could be estimated and determined.
4.4.2 Gamma Model
There are two modelling parameters, κ and θ which should be figured out in the Gamma distribution, and the IGBT degradation process consists of 6 degradation phases, the duration of each phase is an independent stochastic process following the Gamma probability distribution in Gamma modelling. Hence, there are 6 different sets of Gamma modelling parameters which consist of κ and θ. According to the maximum likelihood method.
( ) ∏ ( )
(4-9)
From which the estimators of κ and θ are:
̂ ∑ (4-10) ̂ ( ) ( ) ( ) (4-11)
As listed in table 4-7, we also could calculate the Gamma distribution parameters using Matlab’s maximum likelihood function for the 6 independent models of the IGBT degradation. These 6 models present the 6 independent degeneration phases of the whole IGBTs ageing process.
Table 4-7 Gamma models parameters
Parameter Model 1 Model 2 Model 3 Model 4 Model 5 Model 6 κ 25.77 0.0883 9.3663 0.2818 5.1662 3.3289
θ 31.8 211.67 88 1754.4 167.3 450.2
4.4.3 Exponential Model
There is only one modelling parameter λ which should be figured out in the Exponential distribution, and the IGBT degradation process consists of 6 degradation phases, the duration of each phase is an independent stochastic process following the Exponential probability distribution in Exponential modelling. Hence, there are 6 different Exponential models. According to the maximum likelihood method.
̂
̅ ∑
(4-12)
As listed in table 4-8, we can also calculate the Exponential distribution parameter using Matlab’s maximum likelihood function for the 6 independent models of the IGBT degradation.
![Figure 4-1 IGBT accelerated ageing experiments hardware [32]](https://thumb-us.123doks.com/thumbv2/123dok_us/968734.2627000/33.892.152.745.231.644/figure-igbt-accelerated-ageing-experiments-hardware.webp)
![Figure 4-4 IGBT accelerated ageing system [20]](https://thumb-us.123doks.com/thumbv2/123dok_us/968734.2627000/36.892.145.753.129.518/figure-igbt-accelerated-ageing-system.webp)