Post adoption evaluation model for cloud computing services
utilization in universities in Kenya
Muhambe Titus Mukisa
1, Daniel Orwa Ochieng
2C/o School of Computing, University of Nairobi, P.O. Box 30197, Nairobi
[email protected]
School of Computing and Informatics University of Nairobi, P.O. Box 30197, Nairobi
[email protected]
ABSTRACT
Cloud Computing, a recent technology development presents a paradigm shift in computing, a move away from personal computers and enterprise server systems, to a “cloud” of computers located on the internet. Applications and resources are accessed from the “cloud”. The introduction of cloud computing services in Kenya by some telecommunication company like Safari Cloud from Safaricom Limited is an indicator that cloud computing technology is gaining ground and popularity locally. Technology adoption studies, which include Cloud computing adoption, have mainly been carried out in United State of America, Europe, Japan and Australia. No previous study has analyzed the acceptance and use of cloud computing services in a university setting in Kenya. In addition, no model has been advanced to explain the factors that influence acceptance and use of cloud services in the same setting. A conceptual model derived from the Unified Theory of Acceptance and Use of Technology (UTAUT) was used as a guide in this study. Survey (n=217) and Focus Group Discussion (n=12) were used as data collection instruments in an attempt to understand cloud services adoption and use. The results of partial correlation showed that Performance Expectancy and Facilitating Condition were the two main factors that significantly influence cloud services acceptance and use in the universities in Kenya. The Focus Group Discussion results established that personal ego was a factor that prevented individuals from admitting that they were socially influenced towards adoption and use of cloud services. The findings will be useful to multiple stakeholders that include; academic researchers, technology adoption and perception researchers and cloud services providers and vendors.
Indexing terms/Keywords
Cloud Computing, Software as a Service (SaaS), Platform as a Service (PaaS), Infrastructure as a Service (IaaS), Technology Adoption, Technology Adoption, Unified Theory of Acceptance and Use of Technology (UTAUT)
Academic Discipline And Sub-Disciplines
Science; Technology
SUBJECT CLASSIFICATION
Information Technology
TYPE (METHOD/APPROACH)
Survey and focused group discussion
Council for Innovative Research
Peer Review Research Publishing System
Journal:
International Journal of Management & Information Technology
Vol. 5, No. 3
[email protected]
INTRODUCTION
Cloud Computing is recent computing technology development that presents a paradigm shift in computing (Luis et al., 2008). The shift represents a move away from personal computers and enterprise server systems to a “cloud” of computers. According to Voas and Zhang (2010) and Grossman (2009), there is no standard definition of cloud computing. This argument seems to be validated by the existence of varied definitions (NIST, 2011; Catteddu & Hogben, 2009; Buyya et al, 2008; McFedries, 2008; Staten, 2008; Vaquero et al, 2009). In this paper we define cloud computing as; a computing paradigm that allows on demand access to a pool of metered computing resources located on the internet that include software, platform and hardware infrastructure, offered as a service by a provider/vendor via the internet infrastructure. The term cloud is used basically to illustrate the fact that the applications and resources are available for access at all times and the user does not need to know where they are located on the internet. The purpose of this paper is to first examine and establish the factors influencing students in a university setting to accept and use cloud computing services, secondly to identify moderators to the established factors and thirdly, develop a model that can be used for post adoption evaluation of cloud computing services.
1. LITERATURE REVIEW
1.1 Cloud Computing Development
According to Aderemi, and Oluwaseyi (2011), cloud computing came into the foreground as a result of advances in virtualization, distributed computing with server clusters and an increase in the availability of broadband internet access.
1.2 Cloud service Models
In cloud computing, each available resource is delivered as a service (Aderemi and Oluwaseyi, 2011). The Cloud computing technology can be visualized and described using the XaaS taxonomy that was first used by Scott Maxwell in 2006 to describe the various services available in the cloud infrastructure (Ranjan, 2012; Aderemi and Oluwaseyi, 2011). The “X”, in the XaaS taxonomy can be substituted with Software, Platform or Infrastructure, while the “S” represents Service. Zhang and Chen (2010) organized the different types of services available in the cloud, into a layered architecture, where service models can take any of the three formats; Software as a Service (SaaS), Platform as a Service (PaaS) and Infrastructure as a Service (IaaS), see Figure 1.
Figure 1, Source: Aderemi and Oluwaseyi, 2011
Software as a Service (SaaS)
The Software as a Service (SaaS) forms the top layer of the cloud pyramid (Figure 1) where applications hosted on the provider’s network are run and interacted with via a web browser, which is a thin client interface that is normally hosted on a remote client. Examples of SaaS service model are; Google Doc, YouTube and Gmail by Google (Chappell, 2009) and Salesforce’s Customer Relationship Management software (Varia, 2009).
Platform as a Service (PaaS)
The middle layer of the cloud pyramid (Figure 1) forms the platform, which is an environment on the provider/vendors cloud infrastructure designed to enable developers create/develop, test and even deploy applications on the vendor’s/provider’s platform (Bret and George, 2010; Allan, 2010). Currently, the most popular examples of this service model include Google App Engine (Rayport and Heyward, 2009) and Microsoft Azure (Pastaki et al, 2009).
Infrastructure as a Service (IaaS)
The foundational layer (Figure 1) is a virtualized environment that makes it possible to access and configure a physical piece of hardware on the cloud providers infrastructure, into independent, self-governed environments, which can be scaled in terms of CPU, RAM and Disk space (Victorde, 2010). In this service model, users acquire computing resources that may include processing power, memory and storage from an IaaS provider. The acquired resources can then be used to deploy and run the users applications (Mel, 2010). This service model permits users to access the underlying
infrastructure in order to configure virtual machines. Common examples of IaaS service models include Sendspace.com services, Amazon Web Services, EC2 and S3 (Khajeh-Hosseini, 2010).
1.3 Cloud Services Deployment Models
There are four main deployment models in cloud computing.
Public Cloud
Public cloud is the traditional and most common way of providing cloud services, where a cloud services vendor or company provides various cloud services; SaaS, IaaS and PaaS via the internet infrastructure. In this deployment model, the services are visible to everybody and accessible to multiple users at the same time but may not necessarily be for free. This model traverses national and regional geographical boundaries. The management and control of the cloud infrastructure is the responsibility of the company that provides or sells the services (Armbrust et al., 2010; IBM, 2010; Victor et al., 2010).
Private Cloud
Private cloud or internal cloud or corporate cloud is a proprietary cloud architecture that provides hosted services to a limited number of people. It is separated from the internet or public networks by a firewall and is primarily accessed by employees of the particular organization. It is built, managed, and directly controlled by a single organization that owns the cloud infrastructure (Armbrust et al., 2010; IBM, 2010; Victor et al., 2010).
Community Cloud
Here, the cloud infrastructure is shared by several organizations (Dillon et al, 2010), that together form the community. The management of the infrastructure may be shared between the organization through provision of a common management policy, while in some cases the management and control may be done by a third party on behalf of the organizations that form the community (Thomas, 2009).
Hybrid Cloud
It incorporates components of both public and private clouds (Babcock, 2010). Mostly applied where an organization builds a private cloud for the most sensitive or essential services and outsources cloud services for the non-essential services from a public cloud (Dustin and Scott, 2009; Victor et al., 2010).
1.4 Technology Adoption
Reviews of literature on technology adoption show that research concerning technology adoption has been done for close to three decades (Agarwal & Prasad, 1999; Davis, 1986; Venkatesh & Davis, 2000; Taylor, 2011; Ochieng, 2012; Venkatesh et al., 2003; Wang and Shih, 2009). Most of this research has been carried out in the United States of America, Europe, Australia and Japan and china, but gradually the research on technology adoption is gaining momentum in Africa (Ochieng, 2012) and the rest of the developing world.
In technology adoption studies, the human factors present the most complex and challenging elements of the research, which has led to increased research activities. Among the research activities that are of interest to researchers include establishing the factors that influence the Behavioral Intention and Use Behavior (Al-Adawi et al., 2005) towards a certain technology. A number of theories and models have been developed for the purpose of evaluating and explaining technology adoption by individual users and from individual users perspective. Research findings from various adoption studies focusing on acceptance/adoption and usage of different technologies have shown variations in factors that influence adoption and levels of technology acceptance; the model or theory applied in the research and region of the world where the research was carried out have been found to be among the key factors.
The most cited models and theories include; Theory of Reasoned Action (TRA), Theory of Planned Behavior (TPB), Technology Acceptance Model (TAM) and its improved version called TAM 2, Social-Cognitive Theory (SCT) and the Unified Theory of Acceptance and Use of Technology (UTAUT). Each of the models or theory has its own defined independent and dependent variables. Some variables have been found to overlap across models (Morris and Dhillon, 1996), even though they assume different names under the respective models. The existence of various technology adoption models and theories has given birth to many debates on the suitability and comprehensiveness of some of the models in explaining technology acceptance and adoption.
1.5 Unified Theory of Acceptance and Use of Technology
To confront and address some the limitations and uncertainties that multiple models may pose to researchers, the Unified Theory of Acceptance and Use of Technology (UTAUT) model was developed. The model aimed at simplifying the understanding of Behavioral Intention and Use Behavior as the dependent variables (Venkatesh et al., 2003) and achieving of a unified view of user acceptance of technology (Abdulwahab and Dahalin, 2010; Venkatesh et al., 2003). UTAUT model was developed by consolidating previous technology acceptance theories and models (Venkatesh et al, 2003). It combines eight previous adoption theories through empirical studies. The models include; the Theory of Reasoned Action (Davis et al. 1989, Technology Acceptance Model (Davis, 1989), the Motivational Model (Davis et al., 1992), The Theory of Planned Behaviour (Ajzen, 1991), a model combining the technology acceptance model and the
Theory of Planned Behaviour (Taylor and Todd 1995), the model of PC utilization (Thompson et al., 1991), the Innovation Diffusion Theory (Rogers, 1995), and Social Cognitive Theory (Compeau and Higgins, 1995).
The theory holds that four key constructs; Performance Expectancy, Effort Expectancy, Social Influence and Facilitating Conditions are direct determinant of intention and usage behavior (Venkatesh et al., 2003). Gender, Age, Experience and Voluntariness of use are posited to mediate the impact of the four primary constructs on behavioral intention and use behavior (Venkatesh et al., 2003). Subsequent validation of UTAUT in longitudinal study by Venkatesh et al., (2003) found it to account for 70% of the variance in usage intention, making the UTAUT a broad, robust and powerful model in IS adoption.
Figure 2, Source: Venkatesh et al., (2003)
Venkatesh et al., (2003) tested the UTAUT model in four different organizational settings for a period of six months and the study showed that three primary constructs; Performance Expectancy, Effort Expectancy and Social Influence, had a significant and direct effect on behavioral intention while Facilitating Conditions and behavioral intention are direct determinants of use behavior (Venkatesh et al., 2003; Wang, 2003).
Critics of this model have argued that it is a recent model and therefore requires more validation. Scholars have argued for UTAUT by stating that it is based on a strong theoretical foundation that results from rigorous development process of combining eight models (Schaper and Pervan, 2005, Han et al., 2004). The strength of UTAUT model is in its ability to explain up to 70% of variance (adjusted R2) Use Behavior, whereas the other models are known to account for between 17% and 53% (Han et al., 2004; Venkatesh et al., 2003). UTAUT also includes aspects of the user‘s characteristics, as well as some prevailing conditions at the time of adoption and possible use of the technology, system or service. Further, by including voluntariness as a moderating factor, it able to account for scenarios where technology adoption is mandatory or voluntary, which is ignored by many other models (Venkatesh et al., 2003).
2. METHODOLOGY
Our approach to this study had both quantitative and qualitative aspects. The quantitative dimension was a cross sectional survey design where data was collected using questionnaires from the targeted population, while the qualitative dimension involved using the focus group discussion (FGD).
To guarantee the reliability of the results, we obtained an optimum sample that fulfills the requirements of efficiency, representativeness, reliability and flexibility by computing the sample size as a function of the targeted population, based on the formula developed by Yamane (1967:886).
We used questionnaire and focus group discussion as the data collection instruments. The questionnaire was the most appropriate for collecting quantitative data because of several reasons. First, it has been successfully used before in technology adoption studies using UTAUT model and other models, secondly it helps prevent bias and thirdly, it is the appropriate tool that enabled us to reach as many respondents as stipulated in the sample size. The focus group discussion allowed us capture first-hand information that helped to explain certain phenomenon resulting from quantitative data analysis.
To ensure validity of the data collection instruments, the questionnaire was pre-tested using 30 respondents from the University of Nairobi, for meaning and semantics, against the definition of the constructs by literature review and consulted
experts. Further, the Cronbach’s Alpha coefficient was computed to test consistency between multiple measurements of each construct (Table 1).
The study targeted four universities; two private (Strathmore University and Catholic University of East Afric) and two public universities (University of Nairobi and The Technical University of Kenya), all located in Nairobi Kenya.
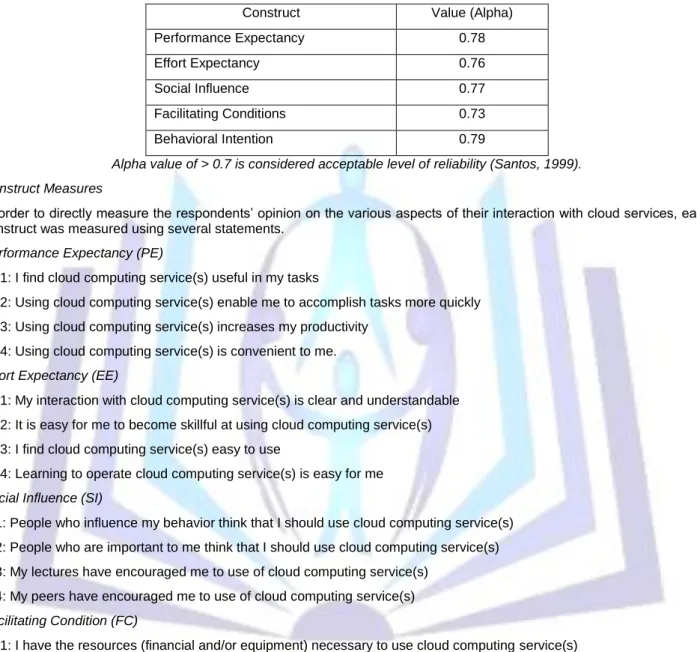
Table 1: Cronbach Alpha reliability test results summary Construct Value (Alpha) Performance Expectancy 0.78 Effort Expectancy 0.76 Social Influence 0.77 Facilitating Conditions 0.73 Behavioral Intention 0.79
Alpha value of > 0.7 is considered acceptable level of reliability (Santos, 1999). Construct Measures
In order to directly measure the respondents’ opinion on the various aspects of their interaction with cloud services, each construct was measured using several statements.
Performance Expectancy (PE)
PE1: I find cloud computing service(s) useful in my tasks
PE2: Using cloud computing service(s) enable me to accomplish tasks more quickly PE3: Using cloud computing service(s) increases my productivity
PE4: Using cloud computing service(s) is convenient to me.
Effort Expectancy (EE)
EE1: My interaction with cloud computing service(s) is clear and understandable EE2: It is easy for me to become skillful at using cloud computing service(s) EE3: I find cloud computing service(s) easy to use
EE4: Learning to operate cloud computing service(s) is easy for me
Social Influence (SI)
SI1: People who influence my behavior think that I should use cloud computing service(s) SI2: People who are important to me think that I should use cloud computing service(s) SI3: My lectures have encouraged me to use of cloud computing service(s)
SI4: My peers have encouraged me to use of cloud computing service(s)
Facilitating Condition (FC)
FC1: I have the resources (financial and/or equipment) necessary to use cloud computing service(s) FC2: I have the knowledge necessary to use cloud computing service(s)
FC3: Cloud computing service(s) is compatible with the university systems I use
FC4: There are people available for assistance with cloud computing service(s) difficulties
Behavioral Intention (BI)
BI1: I intend to continue using cloud computing services BI2: I predict I would continue to use cloud computing services BI3: I will always use cloud computing services
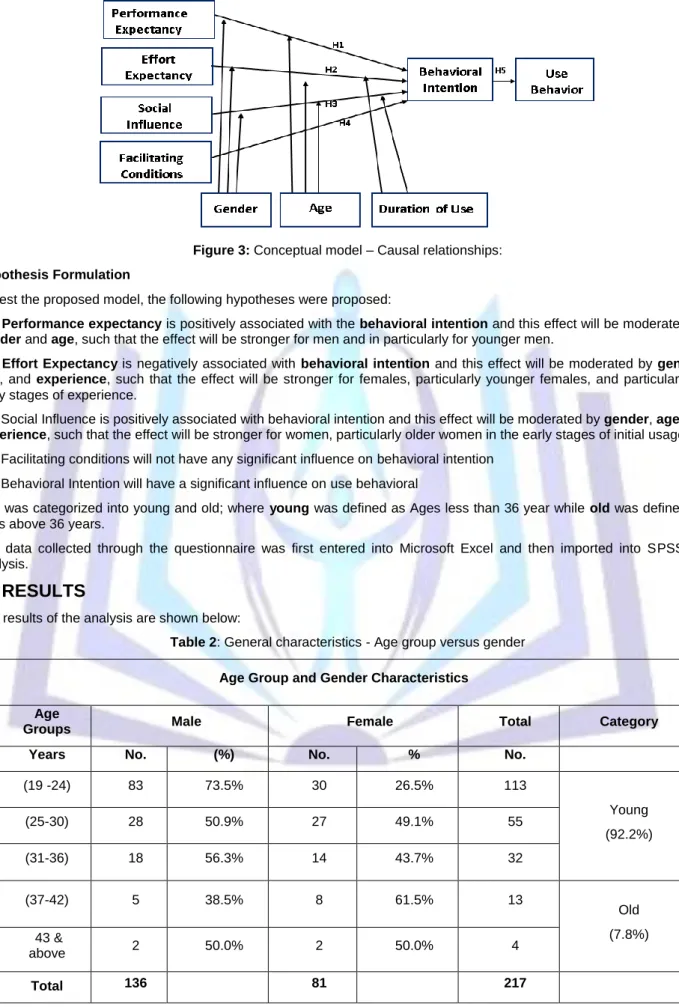
Figure 3: Conceptual model – Causal relationships:
Hypothesis Formulation
To test the proposed model, the following hypotheses were proposed:
H1:Performance expectancy is positively associated with the behavioral intention and this effect will be moderated by
gender and age, such that the effect will be stronger for men and in particularly for younger men.
H2: Effort Expectancy is negatively associated with behavioral intention and this effect will be moderated by gender,
age, and experience, such that the effect will be stronger for females, particularly younger females, and particularly at early stages of experience.
H3: Social Influence is positively associated with behavioral intention and this effect will be moderated by gender, age and
experience, such that the effect will be stronger for women, particularly older women in the early stages of initial usage.
H4: Facilitating conditions will nothave any significant influence onbehavioral intention
H5: Behavioral Intention will have a significant influence onusebehavioral
Age was categorized into young and old; where young was defined as Ages less than 36 year while old was defined as ages above 36 years.
The data collected through the questionnaire was first entered into Microsoft Excel and then imported into SPSS for analysis.
3. RESULTS
The results of the analysis are shown below:
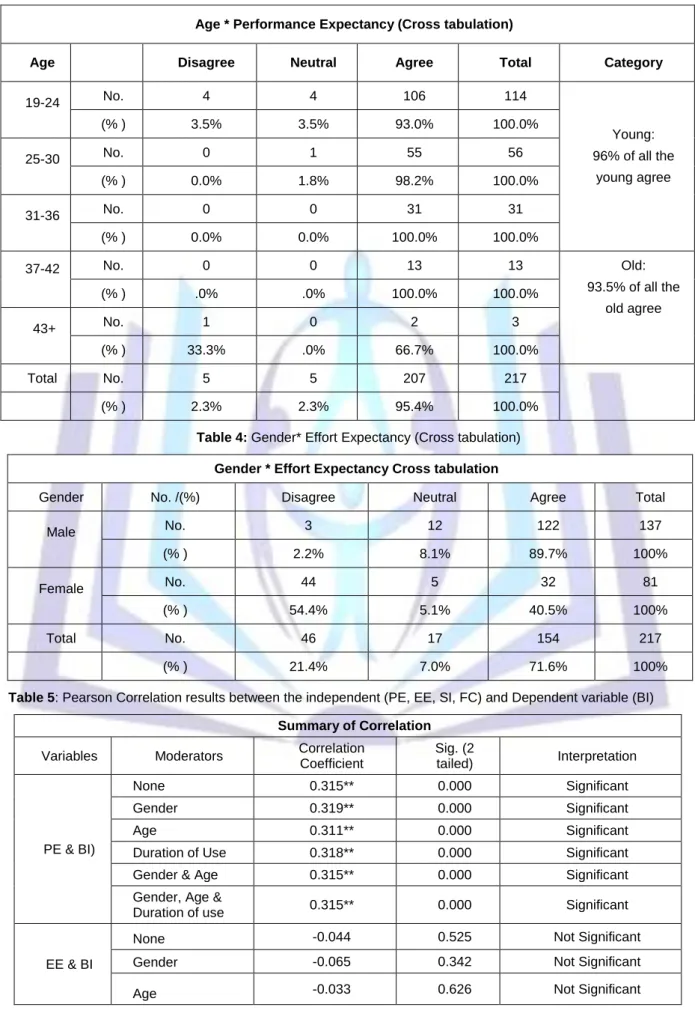
Table 2: General characteristics - Age group versus gender
Age Group and Gender Characteristics Age
Groups Male Female Total Category
Years No. (%) No. % No.
(19 -24) 83 73.5% 30 26.5% 113 Young (92.2%) (25-30) 28 50.9% 27 49.1% 55 (31-36) 18 56.3% 14 43.7% 32 (37-42) 5 38.5% 8 61.5% 13 Old (7.8%) 43 & above 2 50.0% 2 50.0% 4 Total 136 81 217
Table 3: Age * Performance Expectancy (Cross tabulation)
Age * Performance Expectancy (Cross tabulation)
Age Disagree Neutral Agree Total Category
19-24 No. 4 4 106 114 Young: 96% of all the young agree (% ) 3.5% 3.5% 93.0% 100.0% 25-30 No. 0 1 55 56 (% ) 0.0% 1.8% 98.2% 100.0% 31-36 No. 0 0 31 31 (% ) 0.0% 0.0% 100.0% 100.0% 37-42 No. 0 0 13 13 Old: 93.5% of all the old agree (% ) .0% .0% 100.0% 100.0% 43+ No. 1 0 2 3 (% ) 33.3% .0% 66.7% 100.0% Total No. 5 5 207 217 (% ) 2.3% 2.3% 95.4% 100.0%
Table 4: Gender* Effort Expectancy (Cross tabulation)
Gender * Effort Expectancy Cross tabulation
Gender No. /(%) Disagree Neutral Agree Total
Male No. 3 12 122 137 (% ) 2.2% 8.1% 89.7% 100% Female No. 44 5 32 81 (% ) 54.4% 5.1% 40.5% 100% Total No. 46 17 154 217 (% ) 21.4% 7.0% 71.6% 100%
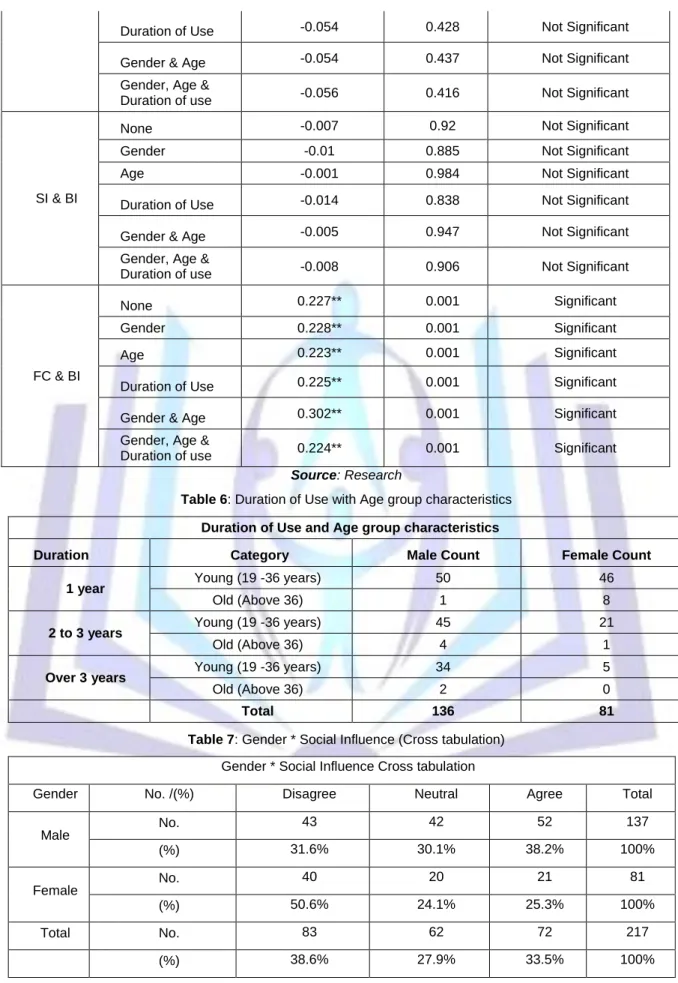
Table 5: Pearson Correlation results between the independent (PE, EE, SI, FC) and Dependent variable (BI)
Summary of Correlation
Variables Moderators Correlation Coefficient Sig. (2 tailed) Interpretation PE & BI) None 0.315** 0.000 Significant Gender 0.319** 0.000 Significant Age 0.311** 0.000 Significant
Duration of Use 0.318** 0.000 Significant Gender & Age 0.315** 0.000 Significant Gender, Age &
Duration of use 0.315** 0.000 Significant
EE & BI
None -0.044 0.525 Not Significant Gender -0.065 0.342 Not Significant Age -0.033 0.626 Not Significant
Duration of Use -0.054 0.428 Not Significant Gender & Age -0.054 0.437 Not Significant Gender, Age &
Duration of use -0.056 0.416 Not Significant
SI & BI
None -0.007 0.92 Not Significant Gender -0.01 0.885 Not Significant Age -0.001 0.984 Not Significant Duration of Use -0.014 0.838 Not Significant Gender & Age -0.005 0.947 Not Significant Gender, Age &
Duration of use -0.008 0.906 Not Significant
FC & BI
None 0.227** 0.001 Significant Gender 0.228** 0.001 Significant
Age 0.223** 0.001 Significant
Duration of Use 0.225** 0.001 Significant Gender & Age 0.302** 0.001 Significant Gender, Age &
Duration of use 0.224** 0.001 Significant
Source: Research
Table 6: Duration of Use with Age group characteristics
Duration of Use and Age group characteristics
Duration Category Male Count Female Count
1 year Young (19 -36 years) 50 46
Old (Above 36) 1 8
2 to 3 years Young (19 -36 years) 45 21
Old (Above 36) 4 1
Over 3 years Young (19 -36 years) 34 5
Old (Above 36) 2 0
Total 136 81
Table 7: Gender * Social Influence (Cross tabulation) Gender * Social Influence Cross tabulation
Gender No. /(%) Disagree Neutral Agree Total
Male No. 43 42 52 137 (%) 31.6% 30.1% 38.2% 100% Female No. 40 20 21 81 (%) 50.6% 24.1% 25.3% 100% Total No. 83 62 72 217 (%) 38.6% 27.9% 33.5% 100%
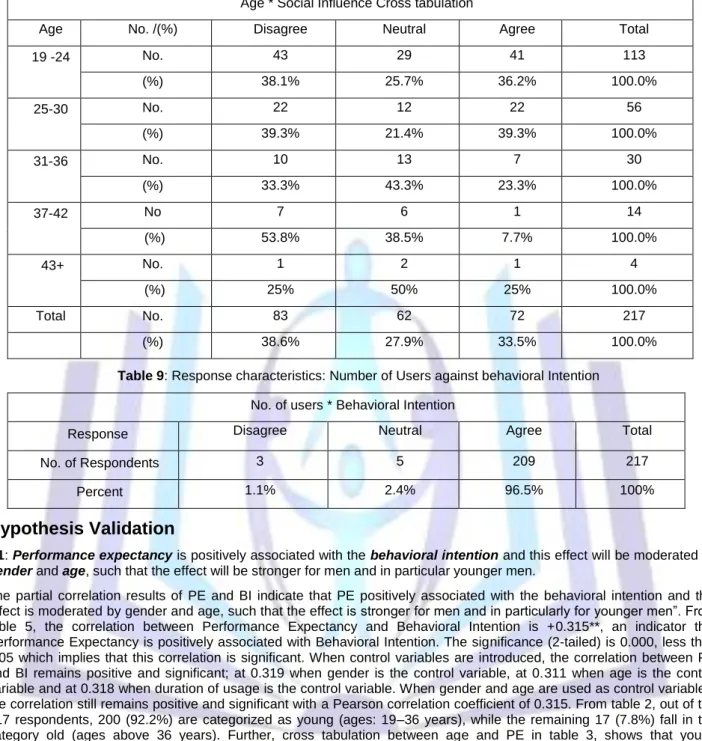
Table 8: Age * Social influence (Cross tabulation) Age * Social Influence Cross tabulation
Age No. /(%) Disagree Neutral Agree Total 19 -24 No. 43 29 41 113 (%) 38.1% 25.7% 36.2% 100.0% 25-30 No. 22 12 22 56 (%) 39.3% 21.4% 39.3% 100.0% 31-36 No. 10 13 7 30 (%) 33.3% 43.3% 23.3% 100.0% 37-42 No 7 6 1 14 (%) 53.8% 38.5% 7.7% 100.0% 43+ No. 1 2 1 4 (%) 25% 50% 25% 100.0% Total No. 83 62 72 217 (%) 38.6% 27.9% 33.5% 100.0%
Table 9: Response characteristics: Number of Users against behavioral Intention No. of users * Behavioral Intention
Response Disagree Neutral Agree Total
No. of Respondents 3 5 209 217
Percent 1.1% 2.4% 96.5% 100%
Hypothesis Validation
H1: Performance expectancy is positively associated with the behavioral intention and this effect will be moderated by
gender and age, such that the effect will be stronger for men and in particular younger men.
The partial correlation results of PE and BI indicate that PE positively associated with the behavioral intention and this effect is moderated by gender and age, such that the effect is stronger for men and in particularly for younger men”. From table 5, the correlation between Performance Expectancy and Behavioral Intention is +0.315**, an indicator that Performance Expectancy is positively associated with Behavioral Intention. The significance (2-tailed) is 0.000, less than 0.05 which implies that this correlation is significant. When control variables are introduced, the correlation between PE and BI remains positive and significant; at 0.319 when gender is the control variable, at 0.311 when age is the control variable and at 0.318 when duration of usage is the control variable. When gender and age are used as control variables, the correlation still remains positive and significant with a Pearson correlation coefficient of 0.315. From table 2, out of the 217 respondents, 200 (92.2%) are categorized as young (ages: 19–36 years), while the remaining 17 (7.8%) fall in the category old (ages above 36 years). Further, cross tabulation between age and PE in table 3, shows that young respondents (ages 19 -36), which translates to 96% compared to the old (ages above 36) at 93.5% agree with performance measure statements. Given that the younger respondent are made up of more males (64.5%), compared to the female (35.5%*, then we conclude that the performance expectancy is stronger for males, particularly the younger male. Hypothesis 1 is supported
H2:Effort Expectancy is negatively associated with behavioral intention and this effect will be moderated by gender,
age, and experience, such that the effect will be stronger for females, particularly younger females, and particularly at early stages of experience.
The partial correlation between of EE and BI shows that EE is negatively associated with BI and this effect will be moderated by gender, age, and experience, such that the effect will be stronger for females, particularly younger females, and particularly at early stages of experience”. The results in table 5 show that the correlation between Effort Expectancy and Behavioral Intention is -0.056479 (-ve) an indicator that Effort Expectancy is negatively associated with Behavioral Intention, but the association is weak. The results in table 4 show a cross tabulation between gender and EE. It is evident that more male (89.7%) agree with the EE measure statements compared to female (40.5%). As shown in table 6, the number of young women; those between 19 - 36 years with an experience of up to 1 year were 46, which is 56.8% of the total number of women sampled. Out of the 46, 33 (71.7%) disagree, while 13(28.3.2%) agree with the EE measure statements. There were 21 young female respondents with experience of between 2 – 3 years, and out of these 8 (38.1%)
disagree with the EE measure statements, while 13 (61.9%) agree. These results show that with growing experience, young female find that they need to use less effort. However, the correlation between EE and BI in this study was found to be weak and not significant; Significance (2-tailed) is more than 0.05 which implies that this correlation is not significant.
Hypothesis 2 is not supported;
H3: Social Influence is positively associated with behavioral intention and this effect will be moderated by gender, age
and experience, such that the effect will be stronger for women, particularly older women in the early stages of initial usage.
From the results in table 5.0, the correlation between Social Influence and Behavioral Intention is -0.007 (-ve) an indicator that Social Influence is negatively associated with Behavioral Intention. The result of cross tabulation between gender and social in table 7 showed that 50.6% of the 81 women respondents disagree with the social influence measure statements compared to31.6% the 136 males. Most women generally feel that social influence plays an insignificant role in the acceptance and use of cloud computing services. Out of the 40 (50.6%) women who agree, 33 (82.5%) were young (ages; 19 – 36) while the remaining 7 (17.5%) were old. In addition the correlation between Social Influence and Behavioral Intention is negative and weak. This results therefore nullify the hypothesis; social influence has a negative association with behavioral intention contrary to the stated hypothesis. The significance (2-tailed) is more than 0.05 which implies that this correlation is not significant. Hypothesis 3 is not supported.
H4:Facilitating conditions will not have any significant influence on behavioral intention.
The partial Correlation between facilitating conditions and behavioral Intention in table 5 is positive at 0.227** and the correlation is significant. When control variables are introduced, the partial correlation coefficient is 0.228, 0.223 and 0.225, when gender, age and duration of use respectively. Furthermore, table 5 shows that when the three moderators are together introduced as control variables, the correlation is still significant with a Pearson correlation coefficient of 0.224. This provides contrasting result compared to the findings of Venkatesh et al (2003) which stated that facilitating conditions construct does not have any significant effect on behavioral intention. Hypothesis 4 is not supported:
H5: Behavioral Intention will have a significant influence on use behavior
The results of the study show that the independent variables PE and FC have significant influence on BI. All respondents who agree with the measure statements for behavioral intention are using the cloud computing services, then we argue that the high percentage (96.5%) of agree in table 9 explains the fact that the respondents are currently using the services and intend to do so in future. Hypothesis 5 is supported;
Based on the partial correlation between independent (PE & EE) and dependent (BI) in results of table 5, an improved model was realized that incorporates the two independent variables that have significant influence on Behavioral Intention and Use Behavior in the voluntary adoption and use of cloud computing services in the universities in Kenya.
Table 10: Summary of the findings:
Code Dependent Variable
Independent
Variable Moderators Explanation
H1 BI PE Gender & Age
PE positively associated with BI and the effect is stronger for men;
particularly the young. The correlation is significant.
H2 BI EE Gender, Age & Duration of use
EE is negatively associated with BI and the effect is stronger for young females in their initial stages of adoption. The correlation is not significant.
H3 BI SI Gender, Age & Duration of use
SI is negatively associated with BI and the effect is stronger for older women. The correlation is not significant.
H4 BI FC Gender, Age & Duration of use
FC has a significant effect BI. This effect is moderated by Gender, Age and Duration of usage.
H5 Use
Behavior BI None
The BI has a significant influence on the behavioral intention
4. DISCUSSION
Several previous studies have shown variation in factors that influence behavioral intention and use behavior towards acceptance and use of new technology.
He and Lu (2007) in their research on factors that influence consumer’ behavioral intention to accept and use mobile advertising established that performance expectancy and social influence were the main determinants of behavioral intention towards consumer’s acceptances of mobile advertising, while facilitating condition and behavioral intention
directly influenced use behavior. Using UTAUT, AlAwadhi and Morris (2008) investigated the adoption of e-government services in Kuwait and their findings showed that performance expectancy, effort expectancy and peer influence were the determinants of behavioral intention to adopt and use e-government services while facilitating conditions and behavioral intention directly influenced the use behavior. In an attempt to establish the role played by motivation in e-learning technology adoption, Maldonado, Khan, Moon and Rho (2009) found that facilitating conditions did not play a significant role in predicting the use behavior.
Also, Tibenderana and Ogao (2008) found that performance expectancy and social influence were non-significant factors in predicting behavioral intention to accept and use electronic Library services in Ugandan Universities. Further, Adell, E. (2009), while studying driver experience and acceptance of driver support systems established that performance expectancy and social influence had a significant effect on behavioral intention, while facilitating conditions directly influenced the use behavior. Adell, E. (2009) further established that effort expectancy did not have an effect on behavioral intention, unlike in most cases of information technology adoptions.
While examining the behavioral intention towards the adoption and use of Medical Teleconferencing Application, Biemans, Swaak, Hettinga & Schuurman (2005) found that performance expectancy and effort expectancy were the main determinants of behavioral intention while social influence did not play a significant role in determining behavioral intention towards acceptance ad use of the medical teleconferencing application.
Pardamean and Susanto (2011), while assessing user acceptance of blog technology using, the UTAUT Model established that both social influence and performance expectancy had a significant relationship with behavioral intention, whereas effort expectancy did not. The study further showed that behavioral intention did not have a significant relationship with actual usage level of blogs as a learning tool. Yahya et al (2011) using UTAUT model researched on measuring user acceptance of E-Syariah portal in syariah courts in Malaysia and found that performance expectancy,
effort expectancy and social influence appeared to be significant and direct determinants of user acceptance and usage behavior. Jong, D and Wang, T (2009) studied the student acceptance of web-based learning system and the research results showed that performance expectancy, facilitating conditions and social influence have significant influence on behavior intention and additionally, behavior intention and social influence have direct impact on system usage. Rahman et al., (2011) found that the Intention to Use Digital Library among Malaysian Postgraduate students was mainly determined by Performance Expectancy and Effort Expectancy in addition to information quality and service quality. Our results of the cross sectional survey and focus group discussion in this study indicated that in the Kenya University setting, Performance Expectancy and Facilitating conditions are the two main determinants of Behavioral Intention to accept cloud computing technology, while behavioral intention influenced use behavior.
There was a strong correlation between PE and BI, which is an indicator that Performance expectancy significantly influences the behavioral intention to adopt cloud services. The Focus Group Discussion further established that the students were eager to learn and know how to use cloud services, but they paid attention to those that significantly contributed towards making their work easier or those that helped them accomplish their task much faster and this confirms that the PE construct is a primary determinant of adoption of cloud computing services in Kenyan Universities. As one participant summed it up “it would not hurt to learn all that there is to learn about available cloud services and how to use them, but I tend to pay close attention to those cloud services that appear to help me in my daily tasks”
The influence of Effort Expectancy on Behavioral Intention was insignificant. We used focus group discussion (n=12) to establish why respondents did not find the Effort Expectancy as an important factor in the acceptance and use of cloud computing. Through the FGD we established that the whenever the respondents found that a cloud service was useful to them, they did not consider the effort required to learn and gain skills on how to use it as a hindrance to the adoption and use of cloud services. They were sufficiently motivated to learn and use cloud services. Further, some of the respondents in the FGD learnt how to use additional cloud services voluntarily, over a long period of time, out of fun and not out of an urgent pressing need to use the cloud service for an important task. There was therefore individual willingness to learn how to use the service. Another contributing factor as one of the participant put it; “Given that most cloud services providers include a help guide on their website, in addition to availability of numerous sites on the internet with clear and straight forward “how to do procedures”, I did not have to exert much effort to learn how to use the services”. Therefore, whereas the association between EE and BI confirms Venkatesh et al., (2003) findings, in that EE anBI they are inversely related, the association between the two was not significant and hence the conclusion that it does not influence behavioral intention in cloud computing services adoption in the institutions of higher learning in Kenya.
Social influence was also found to have no significant influence of behavioral intention. The FGD established that the ego factor; unwillingness of individuals to accept that they were influenced by other individuals towards acceptance and use of cloud services played a significant role. The results also show that Behavioral Intention directly influences the use behavior of cloud computing services.
A strong correlation was found to exist between the Facilitating condition (FC) and Behavioral Intention, contrary to earlier findings by Venkatesh et al. (2003) which stated that FC directly influences the use behavior. FGD established that the universities information technology infrastructure were compatible with the cloud services and therefore allowed students to access cloud services. In addition, most students own portable wireless modems and portable computing devices that allowed them to access the cloud services when access through the university network was not possible.
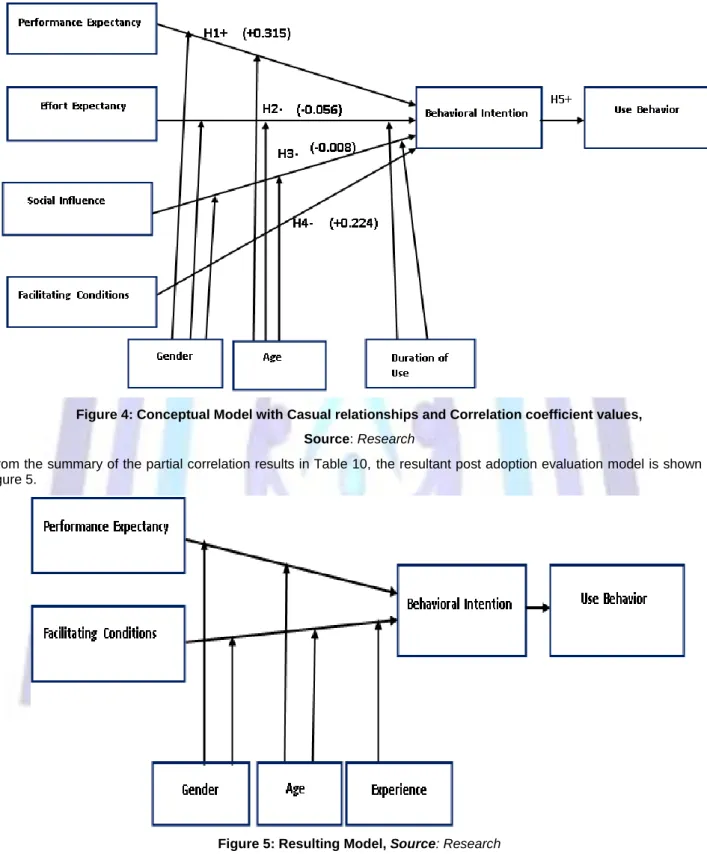
Figure 4: Conceptual Model with Casual relationships and Correlation coefficient values, Source: Research
From the summary of the partial correlation results in Table 10, the resultant post adoption evaluation model is shown in figure 5.
Figure 5:Resulting Model, Source: Research
5. CONCLUSION
The finding of this study show that in the Kenyan University setting, social influence and effort expectancy are negatively associated with behavioral intention but this association is not significant and therefore they do not have any significant influence on behavioral intention to accept and use cloud computing services among the Kenyan university students. The performance expectancy and facilitating conditions on the other hand are both positively associated with behavioral intention towards acceptance and use of cloud computing services and that the two are main determinants of behavioral intention to accept and use cloud computing services in the Universities in Kenya. The correlation between performance expectancy and the behavioral intention is moderated by gender and age. The study established that; there is minimal assistance available to the students towards use of cloud computing services in the Universities in Kenya, the female
students and especially younger ones feel that more effort is required to learn and acquire skills necessary for use of cloud computing services compared to the male students and, with growing experience, the students find it easier to learn and become skillful at using cloud computing services. Finally, students tend to adopt and use cloud services that significantly contribute to accomplishment of their tasks faster and in a much more effective way.
6. RECOMMENDATIONS FOR FURTHER WORK
There were two major limitations to this study that have implication for further research work. The improved model was derived from analysis of data obtained from the respondents who were already using cloud services. We did not introduce cloud computing services to the respondent in order to learn the adopter’s behavior before, during and after adoption of the cloud computing services. It would be important for future research work to observe the adoption process and behavior change of the respondents before, during and after adoption. This would allow for the validation of the improved model presented in this study.
Random sampling may not have allowed us to collect fair samples as relates to factors such as age, gender and duration of use, which are factors that may have moderating effects on the relationships between the independent and dependent variables of the model. It is therefore recommended that future research should adopt or use purposeful sampling in order to gain proper representation of respondents in terms of age, gender and duration of use.
REFERENCES
[1] Adell, E. (2009) Driver experience and acceptance of driver support systems – a case of speed adaptation, Bulletin 251, Lund University
[2] Aderemi, A. & Oluwaseyi, F., (2011). “Security Issues in Cloud Computing: The Potentials of Homomorphic Encryption”: Journal of Emerging Trends in Computing and Information Sciences VOL. 2, NO. 10
[3] Agarwal, R. & Prasad, J., (1999) “Are individual differences germane to the acceptance of new technologies?”,
Decision Sciences, Vol. 30(2), 1999, 361-391.
[4] Alawadhi, A and Morris,A (2008). “The use of the UTAUT model in the adoption of egovernment services in Kuwait”. Proceedings of the 41st Hawaii International Conference on System Sciences, Hawaii, 2008.
[5] Al-Adawi, Z., S. Yousafzai, and J. Pallister. (2005) Conceptual model of citizen adoption of e-government. Citeseer
[6] Allan Carey, (2010) “Cloud Assurance Still Missing,” Information Assurance Newsletter, Vol. 13, No. 1 (Winter 2010), 34.
[7] Armbrust, M., Fox, A., Griffith, R., Joseph, A., Katz, R., Konwinski, A., Lee, G., Patterson, D., Rabkin, A., Stoice, I., and Zaharia, M. (2010). A View of Cloud Computing, Communications of the ACM, 53(4), April.
[8] Babcock, C. (2010). Management Strategies for the Cloud Revolution, McGraw-Hill, New York.
[9] Biemans,M, Swaak,J, Hettinga,M and Schuurman,J.G (2005). “Involvement Matters: The Proper Involvement of Users and Behavioural Theories in the Design of a Medical Teleconferencing Application”. Proceeds of GROUP’05, November 6–9, 2005, Sanibel Island, Florida, USA.
[10] Bret Michael and George Dinolt, (2010) “Establishing Trust in Cloud Computing,” Information Assurance Newsletter, Vol. 13, No. 2 (Spring 2010).
[11] Buyya R., Yeo, C.S., and Venugopal, S., (2008). Market-oriented cloud computing: Vision, hype, and reality for delivering it services as computing utilities. In High Performance Computing and Communications. HPCC’08. 10th IEEEInternational Conference on, pages 5–13. IEEE, 2008.
[12] Chappell, D., (2009). Introducing the Azure Services Platform. David Chappell & Associates
[13] Compeau, D. R., and Higgins, C. A., (1995a). “Application of Social Cognitive Theory to Training for Computer Skills,” Information Systems Research (6:2), 1995a, pp. 118-143.
[14] Catteddu, D. & Hogben, G. (2009): Cloud Computing: Benefits, risks and recomendations for information security; European Network and Information Security Agency (ENISA);
[15] Davis, F.D., (1989). “Perceived usefulness, perceived ease of use, and user acceptance of information technology”,MIS Quarterly, Vol. 13, No. 3, pp. 319-340.
[16] Davis, F.D., Bagozzi, R.P., Warshaw, P.R.(1989),“User acceptance of computer technology: a comparison of two theoretical models”,Management Science,Vol. 35,No. 8, pp. 982-1003.
[17] Dillon, T. Wu, C. and Chang, E., (2010) “Cloud Computing: Issues and Challenges,” Advanced Information Networking and Applications (AINA), 2010 24th IEEE International Conference on, 2010, pp. 27-33
[18] Dustin, A. & Scott, Q., (2009) “Cloud computing for the enterprise [online]”, 2009, Available from http://www.ibm.com/developerworks/websphere/techjournal/0904_amrhein/0904_amrhein.html, Accessed [13th Sept 2012].
[19] Grossman, R.L., (2009). “The case for cloud computing”. IT Professional, 11 (2), 23-27.
[20] He, D and Lu,Y (2007). “Consumers Perceptions and Acceptances towards Mobile Advertising: An Empirical Study in China”. In proceedings of International Conference Wireless Communications, Networking and Mobile Computing
[21] IBM., (2010) “Cloud Deployment and Delivery Models [online]”, , Available from https://www.ibm.com/developerworks/mydeveloperworks/ c2028fdc, Accessed[13th Sept 2012].
[22] Khajeh-Hosseini, A., Sommerville, I. and Sriram, I., (2010). "Research Challenges for Enterprise Cloud Computing," (unpublished).( Submitted to 1st ACM Symposium on Cloud Computing, Indianapolis, Indiana, USA, June 2010, under paper id 54)
[23] Luis, M. V. & Luis, R.M., (2008) A break in the clouds: towards a cloud definition. SIGCOMM Comput. Commun. Rev., 39, 50-55.
[24] McFedries, P. (2008) The Cloud is the Computer; IEEE Spectrum,
www.spectrum.ieee.org/computing/hardware/the-cloud-is-the-computer, 15/10/2012.
[25] Mel, Beckman (2010), “Cloud Options that IT will Love,” An Interactive eBook: Cloud Computing, July 15, 2010. [26] Morris, M. G. & Dhillon, T., (1997). How user perceptions influence software use. IEEE software. 14:58-65 [27] Ochieng, D.O., Waema, T.M. and Onsomu, J.O. (2012) ‘Mobile Interfaced Crops Diagnosis Expert System
(MICDES): a case for rural Kenyan farmers’, Int. J. Services, Economics and Management, Vol. 4, No. 1, pp.4–
26
[28] Pardamean, B. and Susanto, M. (2011). Assessing User Acceptance toward Blog Technology Using the UTAUT Model. International journal of mathematics and computers in simulation, Issue 1, Volume 6, 2012
[29] Pastaki rad, M., Sajedi badashian, A., Meydanipour, G., Ashurzad delcheh, M., Alipour, M. and Afzali, H., (2009). A Survey of Cloud Platforms and Their Future.
[30] Ranjan, S.,(2012). Trusted E-Governance Based Application through cloud computing. International Journal of Computer Science and Communication Engineering Volume 1 Issue 1 October 2012.
[31] Rayport, J. F. & Heyward, A., (2009). Envisioning the Cloud: The Next Computing Paradigm. Marketspace. [32] Rogers, E. M. (1995). Diffusion of innovations (4th ed.). New York: Free Press.
[33] Taylor, S., & Todd, P. A. (1995) “Understanding Information Technology Usage: A Test of Competing Models,”
Information Systems Research (6:4), pp. 144-176.
[34] Taylor, C., (2011). “A Study of Student Use of Cloud Computing Applications”. Journal of Information. Technology Management
[35] Tibenderana,P.K and Ogao,P.J (2008) “Acceptance and Use of Electronic Library Services in Ugandan Universities”. In Proceedings of JCDL 2008, Pittsburgh, Pennsylvania, USA.
[36] Thomas Claburn (2009), “Google Plans Private Government Cloud,” Information Week Government, September 16, 2009, at: http://www.informationweek.com/news/government/cloudsaas/ showArticle.jhtml?articleID=220000732&pgno=1&queryText=&isPrev (accessed August 11, 2010).
[37] Staten, J., Yates, S., Gillett, F. E., Saleh, W. and Dines, R.A. (2008). Is cloud computing ready for the enterprise?
Forrester Research, Cambridge, MA.
[38] Varia, J., (2009). Cloud Architectures. Amazon Web Services
[39] Vaquero, L. M., Luis R. M. and Caceres J, (2009). A break in the clouds: towards a cloud definition. ACM SIGCOMM Computer Communication Review 39 (1):50-55.
[40] Venkatesh, V. & Davis, F.D. (2000). A theoretical extension of the technology acceptance model: Four longitudinal field studies. Management Science, 46 (2), 186-204.
[41] Venkatesh, V., Morris, M.G., Davis, G.B., and Davis, F.D. (2003). User acceptance of information technology: Toward a unified view. MIS Quarterly, 27 (3), 425-478.
[42] Victor Chang, David Bacigalupo, Gary Wills, and David De Roure., (2010). A Categorisation of Cloud Computing Business Models. Proc. 10th IEEE/ACM Int. Conf. Cluster, Cloud & Grid Comput. (CCGRID '10). IEEE Comput. Soc., Washington, DC, USA. pp: 509-512.
[43] Victorde, l., (2010). “Exploring the limits of cloud computing” Masters Thesis: KTH information and communication technology Trita-ict-ex-2010:277
[45] Yahya, M., Nadzar, F., Masrek, N and Rahman B. A.,(2011). Determinants of UTAUT in Measuring User Acceptance of E-Syariah Portal in Syariah Courts in Malaysia. The 2nd International Research Symposium in Service Management Yogyakarta, INDONESIA, 26 – 30 July 2011(242 -250)
[46] Zhang, W., Chen, Q., 2010. From E-government to C-government via Cloud Computing. International on E-Business and E-Government
Author’ biography with Photo Muhambe Titus Mukisa
Bsc: Moi University, MSc: University of Nairobi, PhD (on going): Student (School of Computing - University of Nairobi)
Dr. Daniel Orwa Ochieng: Bsc: University of Nairobi, MSc: Shanghai University, PhD: University of Nairobi, (Lecturer and Researcher – University of Nairobi, Kenya)